Why the ocean’s carbon sink has gotten stronger
DOI: 10.1063/PT.3.3515
In just over a century, the atmosphere’s carbon dioxide concentration has risen from around 280 ppm to 400 ppm. That increase is a consequence of the burning of fossil fuels, conversion of forests into farm lands, and other human activities. Yet if all anthropogenic carbon stayed in the atmosphere, the rate at which atmospheric CO2 concentration is presently increasing would be more than double its actual value. Instead, terrestrial plants, soils, and the ocean have taken up a significant tranche of the anthropogenic CO2. (See the article by Jorge Sarmiento and Nicolas Gruber, Physics Today, August 2002, page 30 .) Some 30–40% of all anthropogenic CO2 emitted since the late 18th century is thought to have been absorbed by the ocean.
The net flow of CO2 across the air–sea boundary depends on the relative concentrations of the greenhouse gas in the ocean and the atmosphere. Attention has understandably focused on rising CO2 levels in the atmosphere, but the ocean is no passive bystander. The 1990s saw a weakening of the ocean’s carbon sink, which was attributed to the strengthening of westerly winds over the Southern Ocean, the waters encircling Antarctica. 1 Those winds combine with the Coriolis force to drive the northward flow of surface waters, which in turn draws carbon-rich deep waters to the surface. Puzzlingly, the ocean’s carbon sink recovered in the 2000s even though the westerly winds remained strong. 2
To tease out what other factors might be at play, Timothy DeVries at the University of California, Santa Barbara, Mark Holzer at the University of New South Wales in Australia, and François Primeau at the University of California, Irvine, took a look below the ocean surface. The researchers ran model simulations of the global ocean overturning circulation—the transport of surface waters downward and deep waters upward—for the 1980s, 1990s, and 2000s and then fed the results into an ocean carbon-cycle model. Their findings identify changes in the pace of circulation in the upper 1000 m of the global ocean as the primary driver of the observed trends in the ocean’s net carbon uptake. 3
The ups and downs
Global ocean overturning circulation involves water at all depths—from the surface down to the abyss some 4000–6000 m below—and operates at 1000-year time scales. (See the article by Adele Morrison, Thomas Frölicher, and Jorge Sarmiento, Physics Today, January 2015, page 27 .) For decadal variability in the ocean carbon sink, though, DeVries and his colleagues focused on the upper 1000 m of ocean, because deeper waters are unlikely to reach the surface in those time frames.
Ocean general-circulation models typically start with an at-rest ocean with some initial distribution of temperature and salinity. Turning on hydrodynamic and thermodynamic processes gets the waters moving, and then the model is stepped through time, often for thousands of simulated years, until an equilibrium circulation pattern emerges. Observational data serve mostly to set reasonable initial conditions.
DeVries and his colleagues opted for a different approach that places at center stage observational data for temperature, salinity, naturally occurring carbon-14, and chlorofluorocarbon distributions, each of which helps to reveal when a parcel of water last contacted the ocean surface. Chlorofluorocarbons, the ozone-depleting gases once widely used as refrigerants (see the article by Anne Douglass, Paul Newman, and Susan Solomon, Physics Today, July 2014, page 42 ), are a particularly good tracer because their history in the atmosphere is well known and their distribution in the ocean has been extensively measured.
Rather than relying solely on simulated ocean dynamics, the group iteratively minimized the differences between simulated and measured tracer distributions to reach a solution that’s consistent with observations. “Essentially, we give the model the data,” explains DeVries, “and ask it to find the circulation that best matches the data.”
“In some sense you get the best of the underlying physical theory, and you get the best of the observations,” says Galen McKinley of the University of Wisconsin–Madison. “This is definitely a new approach, and I think it’s a really great addition to the toolkit of being able to understand the ocean carbon cycle,” she adds.
DeVries and Primeau debuted their model six years ago to determine the long-term average ocean circulation. 4 What’s new this time around is that the researchers have accounted for data from the 1980s, 1990s, and 2000s separately to examine how the circulation changed over time.
Figure

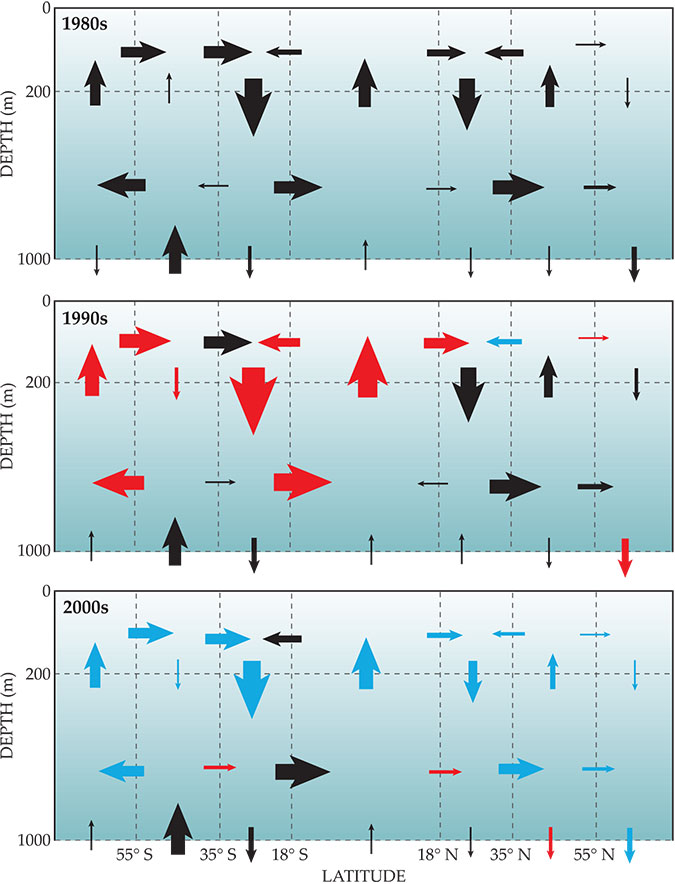
Figure 1. Overturning in the upper 1000 m of the ocean in the 1980s (top), 1990s (middle), and 2000s (bottom). The arrows indicate the directions and magnitudes of longitude-summed fluid transport rates across various latitude and depth boundaries. They range from less than 1 sverdrup (1 sverdrup = 106 m3/s) for the thinnest arrows to 37 sverdrup for the thickest. Red arrows indicate that the magnitude of volume flow has increased relative to the previous decade, and blue arrows indicate a decrease. (Adapted from ref.
The computational cost for getting that decade-resolved view meant foregoing a strictly realistic continuous evolution of the ocean circulation. The model simply computes a mean steady-state circulation for each of the three decades.
In addition, measurements at many locations have been infrequent, in some cases only once every 5 or even 10 years. The use of robotic instrumentation in recent years has led to improved data coverage for temperature and salinity. But for chlorofluorocarbons, “we still have to go out on ships and do those measurements the hard way,” DeVries says. “Unfortunately, we can’t go back in time and fill in the gaps we have.”
Still, DeVries is hopeful that in the future he and his colleagues will be able to capture circulation changes not from just one decade to the next but from one year to the next. They could then see how quickly the changes took place and perhaps figure out what physical processes drove them.
What’s circulation got to do with it?
Once they established the decadal circulation patterns, DeVries and his colleagues used them in an ocean carbon-cycle model to see how changing circulation would affect the ocean’s ability to absorb CO2. As illustrated in figure

Figure 2. Circulation’s role in the ocean’s carbon dioxide uptake. The overturning circulation in the upper 1000 m of the ocean transports absorbed atmospheric CO2 downward but simultaneously brings up natural CO2 from the deep. Combined with increased atmospheric CO2 concentrations, weakening overturning circulation in the 2000s resulted in greater net uptake (brown) of CO2 in that decade. (Adapted from ref.
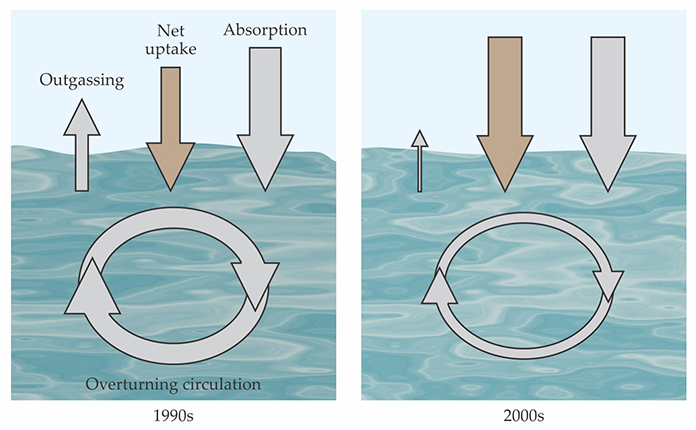
However, the overturning also brought carbon-rich deep waters to the surface. Once there, the abundant carbon in the upwelled water could escape into the atmosphere. The overall balance tipped toward a weakening of the ocean’s net carbon uptake from 1.7 Pg C/year in the 1980s to 1.3 Pg C/year in the 1990s (1 Pg = 1015 g). The largest reduction occurred in the subantarctic (latitudes 55° S to 35° S), where newly risen deep water in the Southern Ocean encounters the atmosphere.
When the overturning circulation weakened in the 2000s, less anthropogenic CO2 was sent down to the depths, but even less deep-ocean carbon escaped into the air. On balance, therefore, the ocean took up more CO2 than before. That might sound like good news; after all, it means less CO2 accumulated in the atmosphere. However, coral bleaching and other consequences of ocean acidification make increased CO2 uptake by the ocean a mixed blessing at best.
Besides, says DeVries, “we think that the effect is going to gradually wear off.” The amount of deep ocean CO2 rising to the surface will eventually plateau even as ever more fossil-fuel CO2 makes its way into the atmosphere. The balance will tip in favor of reduced ocean CO2 uptake. Then the slowing ocean overturning circulation will seem to be bad news all around.
References
1. C. Le Quéré et al., Science 316, 1735 (2007). https://doi.org/10.1126/science.1136188
2. P. Landschützer et al., Science 349, 1221 (2015);https://doi.org/10.1126/science.aab2620
D. Munro et al., Geophys. Res. Lett. 42, 7623 (2015). https://doi.org/10.1002/2015GL0651943. T. DeVries, M. Holzer, F. Primeau, Nature 542, 215 (2017). https://doi.org/10.1038/nature21068
4. T. DeVries, F. Primeau, J. Phys. Oceanogr. 41, 2381 (2011). https://doi.org/10.1175/JPO-D-10-05011.1


