The triggering and persistence of the Little Ice Age
DOI: 10.1063/PT.3.1506
For more than 500 years until the middle of the 19th century, much of the Northern Hemisphere experienced the “Little Ice Age,” the most extended period of anomalous cold—winter and summer—in 8000 years. Picturesque aspects of the LIA are familiar from paintings of winter scenes in northern Europe. But more somber manifestations include numerous famines in Europe and Asia and the extinction of the Norse settlements in southern Greenland.
The LIA’s start and finish dates, as well as its cause, have long been subjects of debate and puzzlement. Variations in solar irradiation and volcanic eruptions have been invoked as possible causes. But the one seems too weak and the other too ephemeral.
Since the end of the last full-fledged ice age 10 000 years ago, Earth’s 26 000-year axial-precession cycle has gradually been reducing solar irradiation of the Northern Hemisphere in summer as the June solstice migrates toward the orbit’s aphelion. Furthermore the Sun’s total output exhibits century-long troughs—for example the 17th-century Maunder minimum, characterized by a near absence of sunspots. Computer simulations, however, seem to show that the two solar mechanisms, even in concert, cannot account for the LIA’s depth and duration.
The LIA was preceded by an atypical profusion of volcanism. Big eruptions spew out sulfates that create stratospheric aerosols which reflect enough solar radiation to significantly decrease surface heating worldwide. The monstrous 1815 eruption of Indonesia’s Mount Tambora famously robbed the following year of its summer in Europe and North America. But each eruption’s aerosol lasts only a few years, making volcanism an unlikely instigator of a multicentury climate anomaly.
Unlikely or not, four major tropical eruptions in the late 13th century are identified as the LIA’s triggering mechanism in a recent paper, by Gifford Miller (University of Colorado at Boulder) and coworkers in the US and Iceland. They present precise new carbon-14 dating results and a model simulation of reinforcing feedbacks to pinpoint the LIA’s abrupt onset and understand its duration. 1
Refining the chronology
An important manifestation of the LIA was the expansion of glaciers and year-round icecaps at high latitudes and elevations. Expansion chronology is often measured by 14C dating of biological debris swept into glacial moraines. But much of the vegetation in those dumping grounds of glacial scouring was killed decades or centuries after the initial shift to colder summers and the consequent advance of perennial ice cover. So Miller and company chose to concentrate on small, localized icecaps that would have reacted much faster and preserved rooted vegetation precisely where it was killed by the expanding ice.
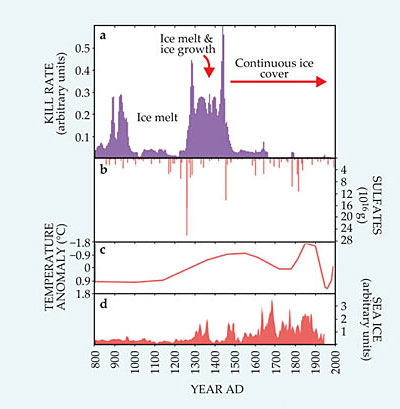
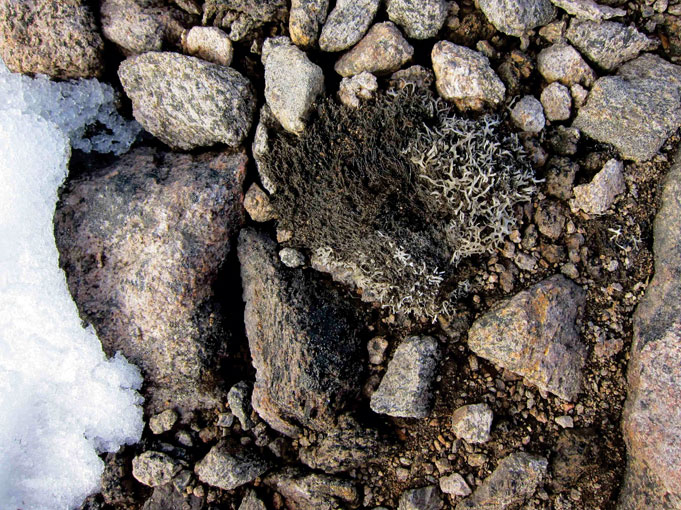
At several dozen such highland sites across Baffin Island in the Canadian Arctic where the surface has only now been exposed after centuries of icy entombment, the team obtained precise 14C kill dates for more than 100 clusters of freshly exposed moss (see figure 1). Recalibrating raw 14C ages for known temporal variations of the atmosphere’s 14C concentration, the team was able to reveal and date prominent kill-rate peaks with almost decadal resolution, as shown in figure 2a.

Figure 2. Geological data covering the last millennium. (a) Relative kill rates of moss by expanding local icecaps on Baffin Island, determined by carbon-14 dating. (b) Global mass of volcanic sulfate aerosol in the stratosphere, estimated from sulfates in ice cores. (c) Temperature anomalies in southern Greenland (relative to the 1880–1980 mean), determined from borehole measurements. (d) Concentration of ice-loving microplankton in sediment cores from the shelf off Iceland’s north coast, a proxy for sea-ice accumulation there. (Adapted from ref.


Figure 1. Long-dead but still rooted moss, just emerged from a receding local icecap on Canada’s Baffin Island. Carbon-14 dating of such clumps provides an impressively detailed chronology of the onset of the Little Ice Age around 1300 AD and its intensification around 1450.
GIFFORD MILLER

The team concludes that the peak near 1300 AD marks the LIA’s sudden onset, and that it was triggered by the four major volcanic explosions in the previous half century, shown in figure 2b. The figure estimates the global stratospheric load of sulfate aerosol based on dateable sulfate concentrations in Arctic and Antarctic ice cores. Though each eruption would have produced just a few cold summers before its aerosol precipitated out, the millennium’s greatest eruption, followed in quick succession by three more, seems to have initiated the very long chill recorded in figure 2c.
By itself, figure 2a presents ambiguities. Long stretches with low kill rates on Baffin Island—for example, the three centuries preceding the 1300 peak—might reflect either a warm period with receding perennial ice or unrelenting cold with continuous maximal ice cover. To resolve such ambiguities, the team dated and measured thicknesses of annual sediment layers under a glacier-fed lake in central Iceland. The more massive the icecap that drives the glacier, the greater (on average) is the thickness of the debris layer it deposits each summer. In that way the team was able to conclude that the pre-1300 trough was indeed a warm spell and that the falloff after the great kill peak around 1450 marks the onset of continuous maximal ice coverage through the end of the 19th century. The 1450 peak is thought to be associated with the well-documented 1452 Kuwae eruption on an island east of New Guinea.
Advancing sea ice
Figure 2d shows the accumulation of sea ice off Iceland’s north coast, as evidenced by the concentration of ice-loving microplankton in sediment cores. The Iceland record, in particular, suggests feedback mechanisms that would account for the LIA’s persistence. Sea ice doesn’t form near Iceland. It only appears when there’s an unusually large export of ice from the Arctic Ocean along Greenland’s east coast. The panel records the sudden appearance of significant ice off Iceland after the volcanism of the late 13th century, and its persistence after the great 1452 eruption.
”The problem with volcanic explanations for the LIA has always been that the sulfate aerosol is gone after three years,“ says Miller. “But the sea-ice data have impelled us to undertake a model simulation to see if decadal volcanic triggering, reinforced by interaction between expanding sea ice and ocean currents, might do the trick.”
If eruptions recur faster than surface water temperatures can recover, the cumulative ocean cooling could be much greater than from any single eruption. In the Arctic Ocean, the anomalously cold surface water might inhibit summer ice melt enough to cause an extended southward expansion of sea ice into the Atlantic.
Expanded sea ice in the North Atlantic reflects more sunlight in summer. And in winter it acts as insulation that inhibits the ocean heat reservoir’s radiant warming of the colder air. Furthermore, the southward expansion would create more desalinated meltwater, whose lower density can disrupt the northward transport of heat by ocean currents that would normally reverse a transient expansion.
Simulating the feedbacks
Though the LIA was felt in varying degrees almost everywhere north of the tropics, the geographic and oceanographic details of the North Atlantic region, which bore its brunt, seem to have played a crucial role in its onset and perpetuation. Availing themselves of a widely used climate-system model maintained by the National Center for Atmospheric Research in Boulder, Miller and company simulated the long-term Northern Hemisphere consequences of the known volcanic record since 1150 AD.
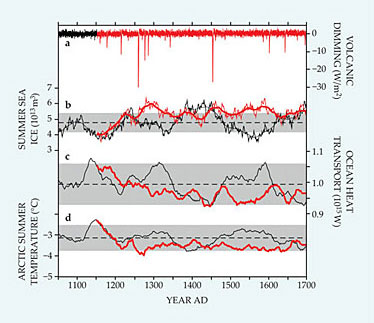
Key results of the volcanically impelled simulation, carried out to 1700, are shown by the red curves in figure 3. For comparison, they branch off a reference simulation that ignores the volcanic data and begins 150 years earlier. Figure 3 translates the empirical year-by-year sulfate aerosol load of figure 2b into a global-average calculation of the consequent transient dimming of radiant solar heat reaching the surface.

Figure 3. Model simulation results (red curves) for climate perturbed since 1150 AD by episodic volcanic dimming of sunlight. That simulation branches off a reference simulation (black) that ignores volcanic effects. Dashed black lines and gray bars show reference-simulation averages and standard deviations. (a) Ice-core sulfate data translated into mean global dimming of radiant solar heating by volcanic aerosols. (b) Total Northern Hemisphere sea-ice volume at the end of summer. The smoothed curves are 30-year running averages. (c) Mean northward heat transport across 26° N in the Atlantic Ocean. (d) Mean summer land-surface temperature north of 60° N between 90° W and 30° E. Comparisons with the reference model show the immediate and extended effects of the episodic volcanism. (Adapted from ref.

The simulation’s degree of randomness is suggested by the fluctuations in the black reference-simulation curves in figures
”Model simulation is always tenuous,” cautions Miller, “but this one does suggest a plausible mechanism for the centuries-long persistence of a decade-scale perturbation. I’m particularly pleased that the empirical evidence for the sudden accumulation of ice off Iceland’s north coast around 1300 supports the simulation’s massive export of arctic ice into the North Atlantic and the consequent disruption of warming ocean circulation.”
References
1. G. H. Miller et al., Geophys. Res. Lett. 39, L02708 (2012). https://doi.org/10.1029/2011GL050168


