Science board warns of global S&T competition as US K–12 education lags
DOI: 10.1063/1.2216951
The US remains the world leader in science and technology, but China, with total R&D spending that reached $84.6 billion in 2003, is rapidly moving toward the front of the line. And while China’s S&T development is rushing forward, many other countries, particularly those in East Asia, are steadily increasing their investments in science, engineering, and mathematics and are becoming serious competitors in the S&T race. Those are the basic findings of the National Science Board’s 2006 Science and Education Indicators, a biannual report that assesses the state of science worldwide.
The extent of investment by China and other East Asian countries, particularly South Korea and Taiwan, has turned what the NSB’s 2004 report called the “potential” S&T competition with the US into “reality,” the new report says. The emerging East Asian countries are Singapore, Malaysia, and Thailand, which have “boosted their market strength and showed potential for further increases in competitiveness.”
But China is the elephant in the room. According to the report, “China is growing at the most rapid pace, and its government has declared education and S&T to be the strategic engines of sustainable economic development.” Data from the Organization for Economic Cooperation and Development indicates that China’s R&D spending reached $84.6 billion in 2003, up from $12.4 billion in 1991. The NSB notes that it is difficult to draw precise comparisons with R&D spending and investment data from different countries, but if the numbers are accurate, they “put China in third place, behind only the United States and Japan, and ahead of Germany.”
While R&D investment in the US, Japan, and the European Union increased between 4% and 5% annually from 1991 to 2003, China raised its R&D spending by an annual average of 17%, the report says. For the past few years, “China’s R&D expenditures have registered 24% average annual increases,” the report says.
Overall, according to the report, international spending on research and development is growing rapidly, with global investment in R&D having increased from $377 billion to $810 billion between 1990 and 2003, the latest year for which figures were available. The US accounted for an estimated $292 billion in combined government and private investment in R&D in 2003, and that number was expected to rise to $312 billion for 2004.
The emergence of China and other East Asian countries is “recasting the international S&T scene,” the report says. “In a relative sense, the major European nations and the EU countries as a group are losing ground, as is Japan, whereas the United States is maintaining its position across a variety of measures.” And while China and other Asian economies are making gains, “Eastern Europe, central Asia, the Middle East, Latin America, and Africa are slowly and selectively entering the international S&T scene but do not yet play a major role in the world’s S&T system.”
The growth of high-technology industries in Asian countries is reflected in the US high-tech trade balance, which has been negative for the past several years, according to the NSB. Data indicate that beginning in 1998, imports exceeded exports in US industries in five categories—aerospace, pharmaceuticals, office and computing equipment, communications equipment, and scientific instruments.
The indicators report highlights scores of S&T trends in the US economy and academic community. Some of those trends are as follows:
-
‣ Science and engineering jobs are playing a growing role in the US economy, with 4.6 million people working in “S&E occupations.” However, from 1980 to 2000, S&E degree production in the US increased at a slower rate than the 4% annual growth in S&E jobs.
-
‣ The 1990s showed “strong increases in the number of foreign-born individuals holding US S&E jobs,” the report says. The largest increase was for those who hold PhDs, up from 24% in 1990 to 38% in 2000. “More than half of the engineers holding doctorates, and 45% of doctorate holders in the physical sciences, computer sciences, and life sciences were foreign born,” the report says.
-
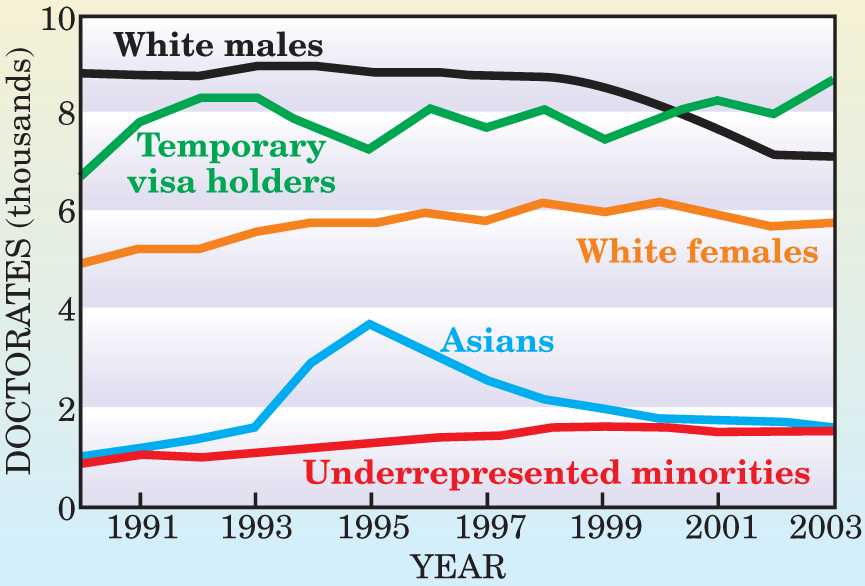
‣ From 1990 through 2003, foreign students earned 33% of US S&E doctorates and 55% of engineering doctorates, while doctorates earned by US-born white males dropped sharply. The share of all doctoral S&E degrees earned by white males, which peaked at more than 11 000 in 1975, declined to less than 7000 in 2002 and 2003. Since the mid-1990s, about 6500 to 7000 foreign-born students annually who earned an S&E doctorate planned to stay in the US. Of those who received their doctorates in 1998, 61% remained in the US in 2003. Increasing international competition for foreign students “raises questions about the continued viability of these high rates,” the report says.
-
‣ Women and minorities earned increased shares of S&E degrees. Beginning in 2000, women received half of these degrees, Asians 10%, and other minorities 18%.
-
‣ Many retirements from the US S&E labor force are impending. In 2003, 13% of those with bachelor’s degrees, 20% of those with master’s degrees, and 28% of those with doctorates were at least 55 years old. Based on historical trends, about half of those people can be expected to retire by age 64.
While the US remains dominant in most aspects of government, industry, and academic S&E funding and research, an NSB companion study to the indicators report warns that K–12 science and math education in the US continues to be lackluster. “We cannot wait for a new sputnik episode to energize our population to rise to this challenge,” NSB Chairman Warren Washington wrote in the companion study. In K–12 education the NSB highlighted several troubling trends for both students and teachers:
-
‣ Improvements in US student performance in mathematics and science have been uneven, with scores on science assessment tests between 1996 and 2000 declining for 12th-graders and remaining flat for grades 4 and 8.
-
‣ In mathematics, students from disadvantaged backgrounds “lagged behind, with these disparities starting as early as kindergarten, persisting across grades, and in some cases, widening over time.”
-
‣ In both mathematics and science, “most students did not reach the proficient performance level, a level denoting solid performance for their grade. In both subjects, only about one-third of 4th- and 8th-grade students, and even fewer 12th-grade students, reached proficient levels.”
-
‣ College graduates who become teachers have “somewhat lower academic skills on average than those who do not go into teaching.” Those who became teachers, the report says, “took fewer rigorous academic courses in high school, had lower scores on 12th-grade achievement tests, scored lower on college entrance examinations, and graduated from less-selective colleges.”
-
‣ Between 17% and 28% of public-high-school mathematics and science teachers lacked full certification in their teaching field in academic year 2002. For academic year 1999, between 23% and 29% of public middle- and high-school math and science teachers didn’t have a college major or minor in the teaching field. The certification rates for those teachers declined from 1990 to 2002.
The companion study offers 17 general recommendations to improve K–12 education, such as ensuring that school administrators “value skills and knowledge in mathematics, science and technology,” and paying math and science teachers higher salaries. The report also calls for improved teacher-education programs in math and science and greater emphasis on science and math in K–8 classrooms.

US S&E doctorate production has been robust, rising from 23 800 in 1990 to a record 28 800 in 1998, then dropping to 26 900 in 2003. The overall numbers depended heavily on foreign students, with those holding temporary visas earning between 6800 and 8700 doctorates a year. The peak of US Asian students in the mid-1990s is inflated by the temporary visas converted to permanent status under the 1992 Chinese Student Protection Act.

U. CORP. ATMOS. RES.
More about the authors
Jim Dawson, American Center for Physics, One Physics Ellipse, College Park, Maryland 20740-3842, US .


