Radio waves map matter without counting galaxies
DOI: 10.1063/1.3490487
As everyone except movie directors knows, sound doesn’t travel in outer space. But there was a time, spanning the first 380 000 years after the Big Bang, when acoustic waves did traverse the cosmos, which was filled with hot, dense plasma. As the plasma cooled and neutral atoms formed, the waves suddenly stopped propagating. Their mass-density pattern froze in place, and the denser regions eventually contracted under their own weight to form galaxy clusters.
Cosmologists are interested in studying that density pattern—the so-called baryonic acoustic oscillations (BAOs)—as a way of tracing the universe’s expansion. (See the article by Daniel Eisenstein and Charles Bennett, Physics Today, April 2008, page 44 .) Observations of distant supernovae have led to the surprising conclusion that the expansion is accelerating under the influence of an enigmatic dark energy. (See the article by Saul Perlmutter, Physics Today, April 2003, page 53 .) But the expansion trajectory is poorly constrained. BAO observations could add further confirmation to the acceleration and perhaps provide some clues about dark energy’s nature. The observations would need to cover an enormous volume of space, extending to redshift z of at least 1.
Surveys of relatively nearby galaxies (with z < 0.3) have turned up evidence of the BAOs, but not with enough precision to draw any cosmological conclusions. And galaxy surveys are laborious: Each galaxy (in a sample of hundreds of thousands or millions) must be separately resolved so that its redshift can be inferred from its spectral features. Extending the surveys to greater distances is even more difficult and time consuming, since distant galaxies are fainter and more numerous than nearby ones, and much of their light is shifted out of the visible band into the IR, where it is absorbed by Earth’s atmosphere.
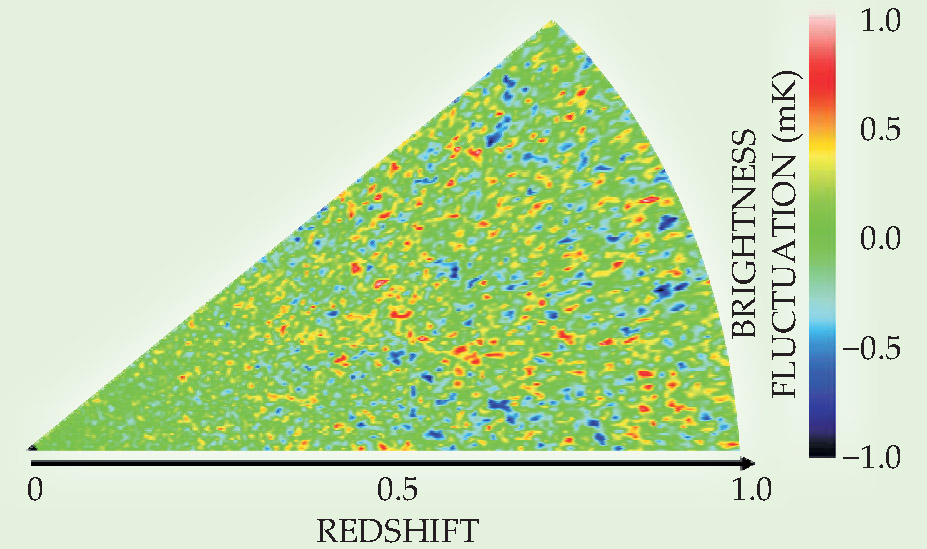
A potentially more efficient technique, dubbed “intensity mapping,” is to focus not on the visible light produced by stars but on the radio waves emitted by interstellar atomic hydrogen gas. 1 Radio observations can’t easily resolve distant galaxies, but they don’t have to. Since the 21-cm emission is an isolated spectral line (corresponding to hydrogen’s spin-flip transition), blobs of mass at different distances can be detected simultaneously: They have different redshifts, so they show up at different frequencies. And the spatial resolution would still be sufficient to detect the BAOs, as shown in the simulated intensity map in figure 1.

Figure 1. Simulation showing large-scale structure as it would appear in an intensity map of the 21-cm hydrogen emission. Red spots indicate greater-than-average density; blue indicates lower-than-average density. (Adapted from
But hydrogen is not the only radio emitter in the universe: Other sources, both terrestrial and celestial, dwarf its signal by a factor of 1000. Now a team of four researchers—Tzu-Ching Chang of Academia Sinica in Taiwan and the University of Toronto, Ue-Li Pen also of Toronto, and Kevin Bandura and Jeffrey Peterson of Carnegie Mellon University—has demonstrated that the hydrogen signal can in fact be extracted over redshifts from 0.5 to 1.1. The researchers conducted RF observations over some of the few patches of sky whose galaxies had already been mapped at those distances. They then processed the data to remove the nonhydrogen contribution. The remaining signal showed significant correlation with the known galaxy density—meaning that the team was indeed detecting hydrogen from distant galaxies. 2
Back in time
Much is known about what the universe looked like at the moment the acoustic waves stopped propagating, because the cosmic microwave background originated at the same time. Spatial variations in the CMB intensity reflect the mass-density pattern imprinted by the sound waves as they froze in place. (See Physics Today, April 2003, page 21 .) The CMB fluctuations exhibit a correlation on the angular scale of 0.6°, equivalent to a correlation length, at the time of their formation, of about 440 000 light-years, the distance the sound waves traveled during the plasma epoch, helped along by the expansion of the universe.
Today that correlation length has grown to 480 million light-years, so galaxy clusters are slightly more likely to be 480 Mly apart than one would expect if they were distributed randomly. By measuring that “standard ruler” over a range of redshifts, one should be able to track the expansion of the universe in a way that complements the “standard candle” of the supernovae data.
The 21-cm hydrogen line can potentially provide information not only about the BAOs near z = 1 but also about the earlier era of reionization (with z between 6 and 20), when stars and galaxies were just starting to form, and about the even earlier “cosmic dark ages” when there were no stars at all. Several new facilities are being constructed for observing the very distant hydrogen, and theorists have analyzed what the measurements would mean, 3 but until now the 21-cm emission had never been isolated at a redshift beyond 0.24.
Hunting for hydrogen
In 2007 Chang, Pen, and Peterson met at a conference and decided to work together on intensity mapping. They began with a theoretical analysis in which they showed that intensity mapping with existing radio telescopes could potentially improve the constraints on cosmological parameters related to dark energy. 4 Then they analyzed radio and optical data taken by the HIPASS survey (HI Parkes All-Sky Survey) to show that 21-cm emission is correlated with the distribution of galaxy clusters in our local neighborhood (z < 0.04). 5 Now they’ve obtained their own data at the Robert C. Byrd Green Bank Telescope (GBT) in West Virginia for z between 0.5 and 1.1. They chose two regions of sky, each 0.5° by 2°, that had been cataloged by the DEEP2 optical redshift survey.
The GBT is a steerable, directional telescope—an enormous satellite dish, basically—with a 0.25°-wide beam. The researchers used it in “drift scan mode”: Keeping the telescope stationary, they allowed Earth’s rotation to drag the beam through the field of interest. Scanning one square-degree patch once with a series of such tracks took 36 minutes; they recorded data for a total of 15 hours.
The sought-after hydrogen signal was overwhelmed by terrestrial radio waves (television broadcasts and cellphone signals with frequencies of 670 to 930 MHz) and by astronomical synchrotron radiation (produced whenever relativistic electrons encounter magnetic fields). Terrestrial-sourced radio waves are more or less localized in frequency, but not in position; they’re also strongly polarized. The researchers removed the brightest terrestrial signals by discarding all the data points that were more than 2% polarized. That meant cutting stripes out of their data plots that amounted to about 5% of their data. Residual signals show up as vertical stripes in figure 2(a); to mitigate those, they subtracted the mean flux in each spectral channel.

Figure 2. Radio flux over two slices through the intensity map over a redshift range of 0.70-1.12. (a) Before nonhydrogen sources are removed, they overwhelm the hydrogen signal. The vertical stripes are caused by terrestrial signals such as television broadcasts, and the horizontal stripes are created by astronomical synchrotron radiation. (b) Removal of continuum sources reveals the hydrogen signal.(Adapted from
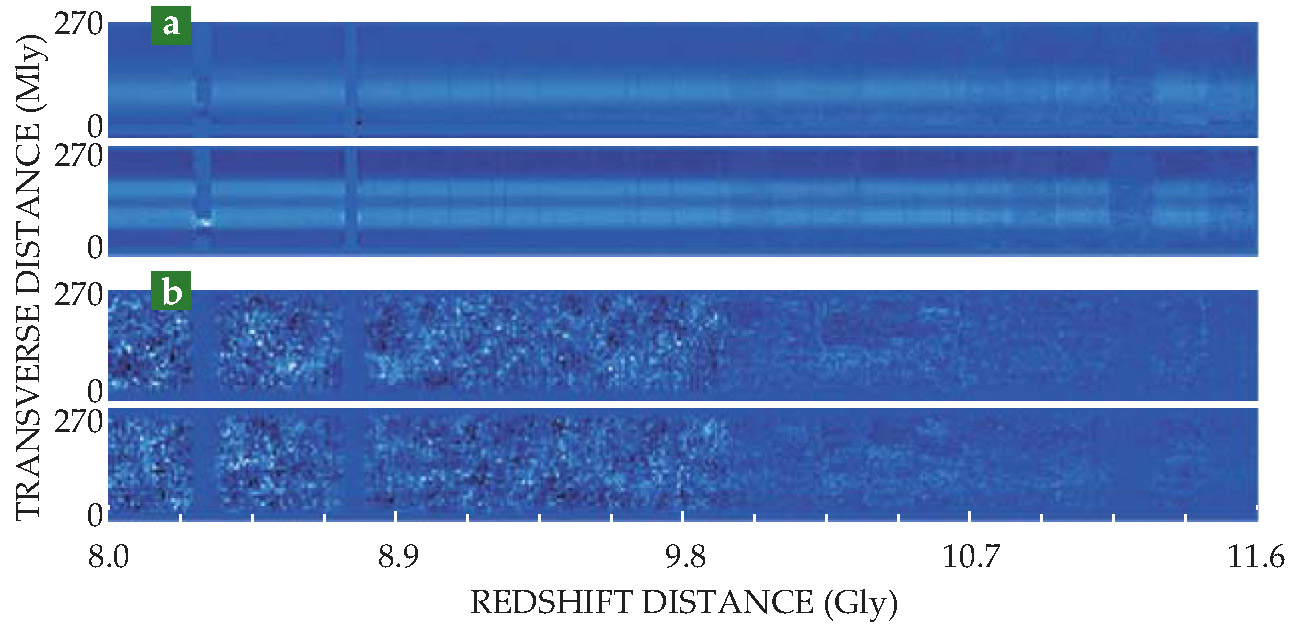
Space-based radio emissions, on the other hand, show up as horizontal stripes, localized in position and weakly dependent on frequency. To remove them, the researchers used a matrix-algebra technique, called a principal component analysis, to decompose their data into a sum of components, each the product of a function of frequency times a function of position. The strongest components, they figured, probably represented the unwanted synchrotron sources. They removed those and retained only the weaker components that contained most of the hydrogen signal. The result is shown in figure
That done, the researchers calculated the cross-correlation of their data and the DEEP2 galaxy density. The two were correlated up to length scales of 40 Mly—quantitatively similar to the DEEP2 data’s autocorrelation. That means that the extracted signal measures much the same thing as the galaxy survey: The teasing out of the hydrogen contribution was a success.
There’s a long way to go, though, before intensity mapping can provide any cosmologically significant conclusions. The radio data’s autocorrelation—the quantity that should eventually reveal the BAO peak at 480 Mly—was so noisy that it wasn’t statistically different from zero. But Chang notes, “The situation has improved since late 2009, since digital TVs no longer occupy the 700-MHz frequency range.” With 300 more observing hours at the GBT, she and her colleagues are now mapping a larger area of sky—about 50 square degrees—which they’ll use as a test for even larger surveys aimed at BAO measurement. And they hope to get funding to build a dedicated intensity-mapping telescope that’s as big as the GBT. Peterson, Bandura, and others have already built a prototype.
References
1. J. B. Peterson et al., 21-cm Intensity Mapping,Astro2010: The Astronomy and Astrophysics Decadal Survey, Science White Papers, no. 234 (2009).
2. T. -C. Chang et al., Nature 466, 463 (2010). https://doi.org/10.1038/nature09187
3. J. R. Pritchard, A. Loeb, Phys. Rev. D 78, 103511 (2008). https://doi.org/10.1103/PhysRevD.78.103511
4. T. -C. Chang et al., Phys. Rev. Lett. 100, 091303 (2008). https://doi.org/10.1103/PhysRevLett.100.091303
5. U. -L. Pen et al., Mon. Not. R. Astron. Soc. Lett. 394, L6 (2009).
More about the authors
Johanna L. Miller, jmiller@aip.org


