Paleoclimate record connects Asian monsoons and ice-age cycles
DOI: 10.1063/PT.3.3283
Stalagmites preserve a record of climate change that goes back hundreds of thousands of years. But unlike other climatic archives, such as marine sediments and ice cores, stalagmites can be precisely dated. That’s because Earth’s uranium-234, a daughter of 238U, steadily decays into thorium-230 with a half-life of 245 000 years. As rainwater passes through soil and bedrock to reach a cave, it carries trace amounts of dissolved U with it. Being water-insoluble, Th is left behind. But as radiogenic 230Th accumulates anew in a stalagmite, it also radioactively decays (to radium-226) with a half-life of 76 000 years. From the 230Th/234U and 234U/238U concentration ratios in a stalagmite layer, the layer’s age can be determined.
The rainwater’s oxygen isotopes are also incorporated into the carbonate mineral layers that form the stalagmite. The 18O/16O ratio is thought to be a good proxy for the amount of precipitation above the cave at the time—and thus for the regional climatic conditions. The greater the rainfall, the lower the relative concentration of 18O, and vice versa. The reasons for that trend are complicated but boil down to the heavier isotope’s greater preference for the condensed, liquid phase.
In China, the rainfall intensity, in turn, reflects the general strength of one of the most scientifically valuable climate systems on Earth—the Asian monsoon, a vast wind system that transports heat and moisture from the Indian Ocean and the tropical western Pacific Ocean into the Indian subcontinent and southeastern Asia.
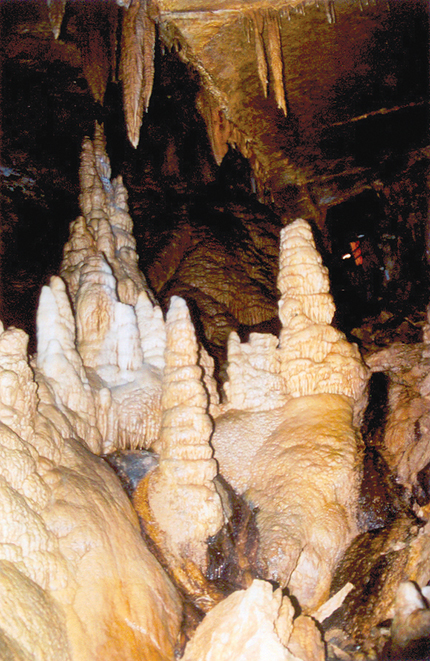
A geological timeline of the system’s history comes from simultaneous measurements of both the oxygen and actinide isotopes. But measuring actinide isotope ratios in a stalagmite isn’t easy: Mass spectrometers must resolve the ratios at concentrations of a few parts per trillion. Aided by recent advances in sample preparation and ion mass spectrometry—in particular, the efficiency with which U and Th can be ionized in a plasma—Hai Cheng (Xi’an Jiaotong University in China), Lawrence Edwards (University of Minnesota), and their colleagues have now assembled a record of Asian monsoon strength that spans 640 000 years, with unprecedented precision. 1 That’s an extension of nearly 300 000 years over the record compiled in earlier studies. 2 Great samples helped: The new record was produced from a cache of notably old stalagmites, shown in figure 1, found within Sanbao cave in the mountains of central China.

Figure 1. Cave stalagmites are mineral deposits that grow upward as rainwater saturated with calcium carbonate from limestone above a cave drips onto its floor. These were found in central China’s Sanbao cave. The deposited carbonate in the stalagmite inherits the oxygen isotope composition of the rainwater and reveals the climatic conditions at the time it fell. (Courtesy of Hai Cheng.)
Climate pacemakers
Monsoon strength waxes and wanes with the amount of solar heating, or insolation, Earth receives over its Northern Hemisphere each summer. That’s an intuitive connection: Temperature affects evaporation rates, differential heating of ocean and land surfaces, and thus the atmospheric pressure gradients that drive monsoons.
As early as the 1920s, Serbian geophysicist Milutin Milanković theorized that changes in Earth’s axial tilt, precession angle, and orbital eccentricity should be largely responsible for its climatic variations. But researchers have struggled to disentangle the combined effects of the orbital forcing from the effects of oceanic and atmospheric dynamics and feedback mechanisms.
The 100 000-year cycle of orbital-eccentricity variations roughly matches the comings and goings of the glacial and interglacial periods of the ice ages. But no plausible physical mechanism linking them could be found. Axial tilt, which varies between 22° and 25° with a period of roughly 40 000 years, and precession, which has a 23 000-year period, exert stronger influences on the distribution of solar heat on Earth—especially relevant in the Northern Hemisphere, where the ice sheets are most extensive during a glacial period.
Figuring out which cycle, or combination of them, accounts for the duration of glacial and interglacial periods requires a well-dated series of multiple events, such as the rising and falling monsoon strength in the new record. Cheng, Edwards, and colleagues plotted those monsoon variations—the green curve in figure 2—and superimposed them on the summer Northern Hemisphere heating (pink) calculated from the so-called Milankovitch cycles, the cyclical changes in Earth’s orbital parameters.

Figure 2. Cyclic swings in the configuration of Earth’s orbital parameters—its axial tilt, its orbital eccentricity ε, and its precession angle ω—vary the amount of solar heating, or insolation, the planet receives. The total insolation (pink) calculated for summer in the Northern Hemisphere is superimposed on a record of Asian monsoon strength (green), quantified by deviations in oxygen isotope ratios (relative to a standard) of Sanbao cave stalagmites. Vertical gray bars mark periods of exceptionally dry, weak monsoons that are correlated to terminations (T-I through T-VII) of the past seven glacial periods, as evidenced by the change in sea level (light blue). Unlabeled gray bars mark putative terminations. (Adapted from ref.
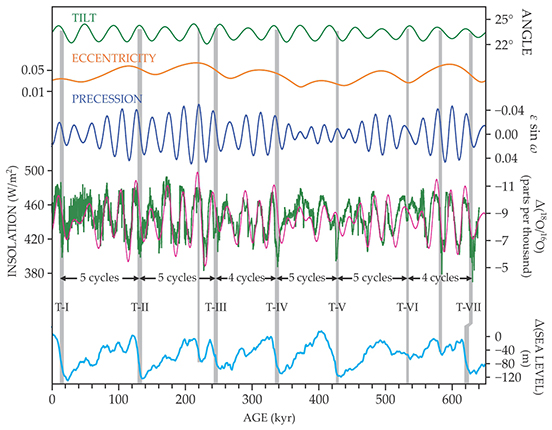
Not only did they find that the variations closely follow the precession cycle, but they strengthened a previously established synchrony between exceptionally weak monsoons that mark dry periods in East Asia, warming periods in the precession cycle, and episodes of catastrophic ice melting. The synchrony allowed them to use the weak monsoons to date the melting episodes that abruptly terminated each of the past seven glacial periods Earth has experienced.
Ice ages
What does a weak monsoon at low latitudes have to do with the melting of ice sheets thousands of kilometers away? Hypotheses abound, but most attribute the link to the change in temperature caused by perturbations to Earth’s oceanic and atmospheric circulation. As northern temperatures rise during a warming trend in the precession cycle, the ice sheets release vast amounts of fresh meltwater into the northern Atlantic Ocean around Greenland. The fresh water so reduces the salinity there that it weakens or shuts down the normal sinking of dense water that drives the ocean’s circulation of warm water northward. A cold snap envelops Europe and Eurasia, and the temperature drop slows the solar heating of the continents, the main driver of the monsoon. Importantly, because the dry period occurs when the solar heating is rising, it is a signal, not a cause, of the impending termination of a glacial period.
Less clear is why a discrete number of precession cycles—typically four or five—appear to be required before the ice sheets reach some tipping point and melt almost entirely. The best guess, proposed by Maureen Raymo (Lamont–Doherty Earth Observatory) almost two decades ago, is that the size of the glaciers may trigger the instability. 3 For example, the crushing weight on Earth’s crust could lower a glacier’s surface to a warmer altitude and force a larger fraction of it underwater, both of which accelerate melting. And although the shutdown of the meridional overturning circulation temporarily cools the Northern Hemisphere, it also warms the south. The concomitant change in atmospheric circulation shifts the monsoon’s path southward—consistent with a dry period in central China. The southern warmth may also trigger the release of carbon dioxide and other greenhouse gases that further warm the planet and melt the ice.
Other feedback mechanisms are also likely to be in play. Each of the seven glacial periods, whose magnitudes are reflected in the variations of sea level over time in figure 2, appear slightly different. The albedo difference between ice and land or water is so large, for example, that small differences in glacial topography can lead to nonlinear changes in a glacier’s buildup or meltdown. Some variations in sea level may well be failed glacial-period terminations—episodes where melting was rapid but didn’t lead to an interglacial period. Or tipping points may have come earlier than expected, a possibility exemplified by putative terminations at the times marked by unlabeled gray bars between T-II and T-III and between T-VI and T-VII in figure 2.
The new monsoon record contains numerous millennial-scale variations in monsoon strength. To isolate those features from the insolation signal, Cheng and his colleagues subtracted the orbital forcing from the record. Strangely, features stand out that still appear related to the precession cycle. Those and other features should keep climate modelers busy for years.
References
1. H. Cheng et al., Nature 534, 640 (2016). https://doi.org/10.1038/nature18591
2. See, for example, H. Cheng et al., Science 326, 248 (2009). https://doi.org/10.1126/science.1177840
3. M. E. Raymo, Paleoceanography 12, 577 (1997).https://doi.org/10.1029/97PA01169


