Kinetic experiments shed light on protein-folding thermodynamics
DOI: 10.1063/PT.3.1205
In its native state, the treasure trove of nutrients and biochemical machinery known as egg white is a slimy, translucent soup of proteins. Heat it atop a stove, however, and the proteins unfold, coagulate, and collectively morph into an opaque white solid. The unraveled proteins are said to have denatured. The enzymes among them, although well-suited for a cheese omelet, are in no shape to usher along biochemical reactions.
The proteins would have suffered a similar fate had the egg white been whipped into a foamy meringue or soaked in lime juice. Indeed, the precise biological work of folding a protein can be undone by any number of environmental stresses, including heat, acidity, and mechanical strain. Proteins, like all molecules, tend to adopt the shape that minimizes their free energy. In some circumstances, a compactly folded state makes thermodynamic sense; in others, it doesn’t.
To characterize the influence of environment on a protein’s shape, biologists construct a free-energy landscape. They typically do so by performing titrations, experiments not all that dissimilar to frying an egg: A protein solution is subjected to a gradual ramp in some input variable—perhaps temperature, perhaps some other quantity—and monitored for physical changes indicative of folding or unfolding.
But as Martin Gruebele of the University of Illinois at Urbana-Champaign can attest, the titration approach has its limitations. Gruebele is one of a growing number of biophysicists who are interested in understanding how proteins fold inside living cells and organisms. He and his coworkers have learned firsthand that many cells, including the cancer cell shown in figure 1, can’t survive the considerable knob-turning required to complete a titration.

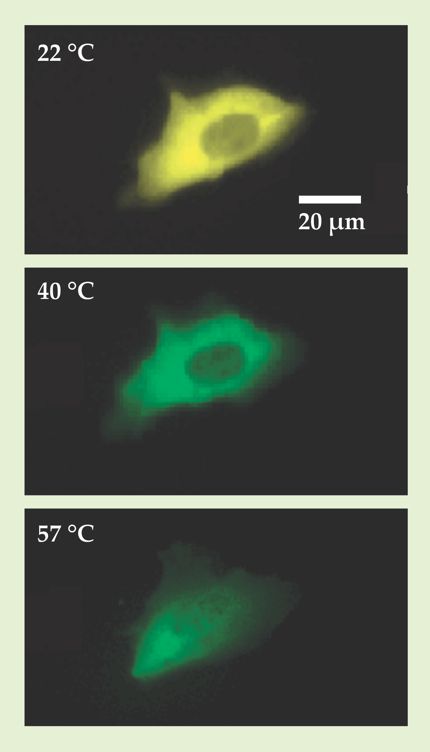
Figure 1. The structure of the fluorescent-tagged phosphoglycerate kinase enzymes in this bone-cancer cell can be inferred from their emission spectrum. The cell’s yellow appearance at 22 °C indicates the enzymes are in their native, folded state. The green emission at 40 °C signals that several of the enzymes have unfolded. But at 57 °C, a measurement point needed to round out the titration data, the cell has already died. (Images courtesy of Martin Gruebele.)
Now a team led by Gruebele and Yann Chemla (also at the University of Illinois) has arrived at a potentially less destructive way to generate folding free-energy landscapes. 1 The researchers’ theory, simulations, and experiments endorse a counterintuitive strategy: To get the clearest picture of a protein’s folding equilibria, force it out of equilibrium.
The baseline problem
The dramatic change in texture and appearance that befalls a frying egg is only a crude and indirect indicator of protein denaturation. To precisely characterize folding transitions, biologists look for more subtle clues, such as a shift of a peak in the protein’s vibrational spectrum or a change in the emission of a fluorescent probe.
Ideally, the observed property would produce an output signal B that changes only when a protein folds or unfolds. Plotted as a function of the input variable, B would describe a sigmoid curve. The two horizontal tails would correspond to folded and unfolded states. The transition point, at which half the proteins are folded and half are unfolded, would lie somewhere along the connecting curve.
In practice, factors other than folding and unfolding can influence how B changes with the input variable. An increase in temperature, for example, might alter an amino acid’s vibrational frequencies, diminish the quantum yield of a fluorescent probe, or cause a folded protein to expand slightly without unfolding. Such events contribute to what’s known as an intrinsic baseline. Because of them, the tails of real titration curves aren’t horizontal but rather lie at slants, as illustrated in figure 2a.

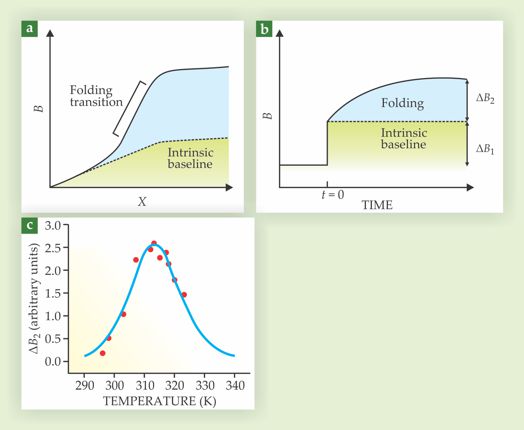
Figure 2. Thermodynamics from kinetics. (a) In a titration, a protein folding transition is identifiable as a change in an output signal B(X) above and beyond changes in the intrinsic baseline, where X is an input variable. (b) In kinetic experiments, folding and intrinsic-baseline contributions separate themselves automatically in the wake of a small step change in X. The nearly instantaneous response ΔB1 corresponds to intrinsic-baseline relaxation; the slow response ΔB2 corresponds to folding transitions. (c) Plotted against the input variable—in this case temperature—ΔB2 describes a bell curve, with most folding transitions occurring near the maximum. The data shown here are from in vitro experiments on SRC homology 3 proteins. (Adapted from ref.
To distinguish the folding transition from the intrinsic baseline, then, one needs to determine the slope of the upper and lower tails of the titration curve. That means acquiring data at values of the input variable ranging from well below to well above the transition point. For Gruebele’s research group, it also meant that a tantalizing result lay just out of reach.
Thermodynamic nudges
Last year, Gruebele’s group published experimental results showing that certain kinase enzymes can withstand higher temperatures inside a human cancer cell than they can in vitro. 2 It wasn’t a complete surprise. Intracellular proteins are constantly jostling with other proteins, organelles, and cellular machinery; some theorists suspect that jostling could frustrate proteins’ attempts to unfold. But the researchers couldn’t obtain enough of the titration curve to fully pin down the enzyme’s transition point. “We basically boiled our cells, and that was the end of the experiment,” recalls Gruebele. “There had to be a kinder, gentler way.”
Gruebele eventually came up with that kinder, gentler strategy: Give the biosample small, swift thermodynamic nudges. For many proteins, a step change in the input variable elicits a two-stage response like that illustrated in figure 2b. The nonfolding dynamics, the parts that make up the intrinsic baseline, equilibrate almost instantaneously, within picoseconds or nanoseconds of the step change. Folding transitions—much more complicated undertakings typically requiring a protein to climb a free-energy barrier—can take microseconds, seconds, or even hours.
As long as the slower folding dynamics can be sufficiently resolved, a protein’s response to a step change can be separated into a fast part, ΔB1, and a slow part, ΔB2. The fast part is dispensable. The slow response, provided the step change is small, is proportional to the derivative of the titration curve, except with much of the unwanted intrinsic baseline conveniently discarded. Plotted against the input variable, ΔB2 describes a bell curve like that shown in figure 2c, with the transition point lying near, if not precisely at, the maximum.
With the general concept in place, there remained some theoretical legwork. Technically, ΔB2 corresponds to a change in some observable proxy, not a change in the folding-state population. (That’s why the transition point doesn’t necessarily coincide with the bell curve’s maximum.) To connect those two dots requires a suitable model of the reaction kinetics and a handful of fitting parameters. Gruebele and company worked out the math for a two-state model.
There also remained the experimental legwork of demonstrating that the new approach, dubbed “thermodynamics from kinetics,” actually works.
To the lab bench
The so-called SRC homology 3 domain (SH3), a sequence of roughly 80 amino acids that crops up in numerous proteins, is what Gruebele and his coworkers refer to as a “difficult case.” SH3’s structure can be probed using Förster (or fluorescence) resonance energy transfer (FRET) spectroscopy, a technique that reports the distance between two positions on a biomolecule’s backbone (see PHYSICS TODAY, April 2011, page 16 ). But SH3 is so small—unfolded, its end-to-end span is a mere 30 Å or so—that folding-related changes in the FRET signal hardly stand out above the noise in the intrinsic baseline. SH3’s temperature titration data resemble less a sigmoid than a steep, straight line.
To test the kinetic approach, Gruebele and company measured FRET signals of SH3 molecules responding to jumps of 2 °C; each jump was administered with a millisecond IR pulse. From the resulting data, obtained at the relatively mild temperatures of 45 °C and cooler, the team produced a more reliable estimate of the folding-transition point than they could have with titration data up to 59 °C.
The researchers chose SH3, however, specifically because it’s ill-suited for titrations. Could there be an anti-SH3, some hypothetical combination of folding signal and intrinsic baseline that’s more easily unscrambled by titration than by kinetics? “We tried to find one,” Gruebele says, referring to a gauntlet of simulations the team conducted. “But even in the worst cases we could think of, our kinetic model did as well as the titration model. Most times it did better.”
References
1. K. Girdhar, G. Scott, Y. R. Chemla, M. Gruebele, J. Chem. Phys. 135, 015102 (2011). https://doi.org/10.1063/1.3607605
2. S. Ebbinghaus, A. Dhar,J. D. McDonald, M. Gruebele,Nat. Meth.7, 319 (2010).


