Digital holography takes to the skies
DOI: 10.1063/PT.3.3006
Viewed from afar, clouds can look like floating, wispy puffs of cotton. Up close, micrometer- to millimeter-sized droplets of liquid water are buffeted by turbulent winds as dry air surrounding a cloud mixes with the moisture-laden air inside. The continually morphing shapes of clouds are visible manifestations of that turbulent mixing.
Cloud physicists have long wanted to know how turbulent mixing affects the size and spatial distribution of cloud droplets at centimeter or smaller length scales. Those are the scales at which the droplets collide and merge, evaporate, and interact with aerosols. Such microphysical processes profoundly shape large-scale cloud properties, among them the likelihood of producing rain and other precipitation and their ability to reflect incoming sunlight back into space.
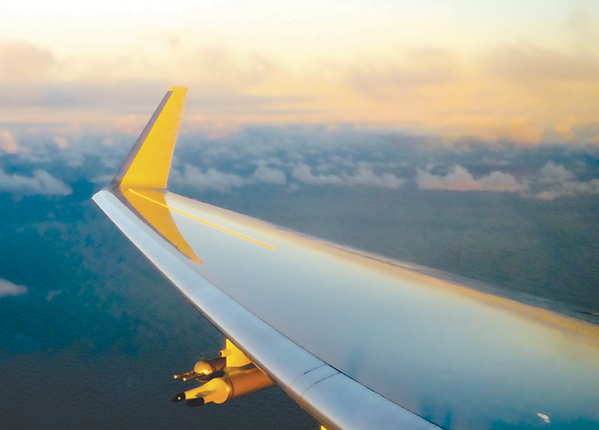
To get a definitive three-dimensional picture of cloud structure at the scale of a few cubic centimeters, Raymond Shaw of Michigan Technological University, Jacob Fugal of the Max Planck Institute for Chemistry, Jeff Stith of the National Center for Atmospheric Research, and their colleagues have turned to digital holography. On two separate flights through cumulus clouds, the researchers imaged cloud droplets with their Holographic Detector for Clouds or HOLODEC, shown in figure 1. The holograms from those flights reveal that turbulent mixing leads to highly inhomogeneous spatial distributions of cloud droplets. The clouds, it seems, have sharp boundaries even at the scale of a few cubic centimeters. 1 The result contradicts a common assumption about turbulent mixing and should help atmospheric scientists improve the way they treat clouds in meteorological and climate models.

Figure 1. The Holographic Detector for Clouds, or HOLODEC, is shown mounted to the underside of the leading edge of a research aircraft’s wing. The black-tipped instrument takes holographic snapshots of liquid water droplets in a cloud. (Courtesy of the National Center for Atmospheric Research.)
A tale of two limits
A cloud’s liquid water content scales as the product of the droplet number density and the average volume of the droplets. When dry air mixes with moist air, evaporation can reduce the number density, the average droplet size, or both. The situation is not at all simple, Shaw explains, because turbulent mixing takes place on many length scales and the response time of cloud droplets depends on thermodynamic conditions, droplet concentrations, and many other factors.
To constrain that plethora of factors, John Latham and Marcia Baker more than 30 years ago proposed two limiting cases, 2 which remain popular. In one limit, called homogeneous mixing, the droplets all partially evaporate and become smaller, which leaves the number density unchanged. In the other, inhomogeneous-mixing limit, a subset of droplets evaporates completely so that the average droplet size remains the same but the number-density decreases and sometimes becomes clumpy.
Determining which picture is closer to reality has been difficult. Traditional instruments for measuring cloud droplets detect them one at a time as they pass through a narrowly focused laser beam. Mounted on a plane, the instrument might sample between 10 m and 100 m of flight path through a cloud to obtain reasonable statistics. Although the probe can accurately determine the mean droplet diameter, averaging over such a long distance smears out any local inhomogeneity in the number density.
The HOLODEC instrument eliminates the need for spatial averaging by taking holographic snapshots, 15 cm3 of air at a time and at a rapid-fire clip of 200 per minute. A 1-ns laser pulse illuminates a sample volume and a CCD records the interference pattern between light that is scattered by droplets and light that passes through unscattered. That pattern encodes the three-dimensional shapes and positions of the thousand or so droplets within the volume. Back on the ground, the researchers can digitally reconstruct the hologram and determine the droplet size and spatial distribution.
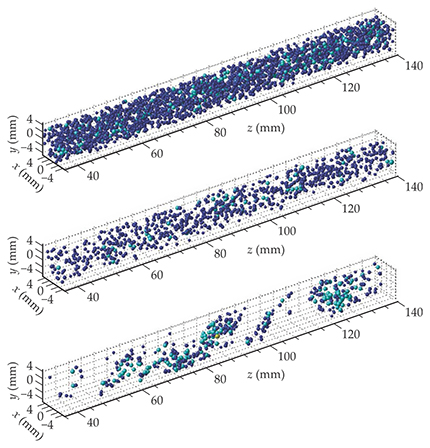
Figure 2 shows the spatial distributions of cloud droplets determined from three such reconstructions. The top panel shows a volume that hasn’t been thinned with dry air. The middle panel shows a volume in which the air has been thoroughly mixed and the droplet distribution has relaxed back to being spatially uniform. The bottom panel shows a volume with filaments of untouched droplets separated by regions of freshly mixed air in which droplets have completely evaporated away.

Figure 2. The positions and sizes of liquid water droplets reconstructed from three holograms taken during flight through a cloud. Droplet sizes are indicated by color, with dark blue for droplets less than 10 μm and light blue for droplets between 10 μm and 12 μm. The top panel is an unmixed cloud volume. The middle panel is a volume after dry and moist air have fully mixed and droplet distribution has become uniform in space, albeit more sparse than the undiluted volume. The bottom panel is a volume in which turbulent mixing has produced a highly inhomogeneous distribution of droplet number density. (Adapted from ref.
Shaw notes that the cloud isn’t inhomogeneous everywhere—just in patches where recent mixing has occurred. In those patches, he explains, the droplets that completely evaporate act as a sort of shield. They humidify the dry air that mixes in and allow the remaining droplets to stay unchanged.
A long time coming
Holographic imaging of particles inside clouds is not a new idea. Early attempts were made in the late 1970s and early 1980s. However, in those days the holograms were recorded on glass plates or film. A researcher might take days to manually analyze a single hologram. Today holograms can be recorded using a CCD camera and stored digitally.
Shaw, Fugal, Stith, and their collaborators built their prototype instrument more than a decade ago. The first test flights demonstrated that the instrument would work. But developing software to automate the analysis of the many thousands of holograms produced during a single flight—removing background noise, classifying the detected particles, and accurately determining the size and position of each particle—was slow going.
The group’s analysis package now runs on computers aided by graphical processing units and can work through one hologram in 30 minutes. But even after they had developed the necessary software, the researchers hesitated. Could they have inadvertently built in some bias in the way their code estimated droplet diameters? “These are the tricky questions that keep a scientist up at night,” says Shaw. In the end, they came up with a completely independent method to estimate droplet sizes to double-check their analysis.
Worries about the software weren’t the only source of doubt. After their first flight in 2011 aboard the National Center for Atmospheric Research’s C130 aircraft, the scientists fretted over the possibility that disturbances from the plane could produce artifacts in their measurements. So they took another flight, this time on the University of Wyoming’s King Air research aircraft, with the instrument mounted at a different wing location. Comparison of data from the two flights, along with some fluid dynamics calculations, convinced the group that the presence of the plane had little effect on the droplet distributions.
Model consequences
The new results from Shaw, Fugal, Stith, and colleagues run counter to the assumption of homogeneous mixing made in many cloud models. Such assumptions about the microphysics of clouds influence how cloud properties are parameterized in large-scale models of climate and weather. (See the article by Bjorn Stevens and Sandrine Bony, Physics Today, June 2013, page 29 .) For example, homogeneous mixing, which produces smaller average droplet sizes, would lead to clouds that more efficiently reflect light at visible frequencies.
Shaw says, “I’m still surprised at how strongly inhomogeneous the clouds are that we’ve looked at. I would have expected to find homogeneous mixing in some conditions.” Armed with the new technique, cloud physicists are well positioned to check whether the case holds for noncumulus clouds. Results from such measurements should help meteorologists and climate scientists build models with more realistic representations of clouds.
References
1. M. J. Beals et al., Science 350, 87 (2015). https://doi.org/10.1126/science.aab0751
2. M. B. Baker, R. G. Corbin, J. Latham, Q. J. R. Meteorol. Soc. 106, 581 (1980); https://doi.org/10.1002/qj.49710644914
M. B. Baker et al., J. Atmos. Sci. 41, 299 (1984). https://doi.org/10.1175/1520-0469(1984)041%3C0299:TEOTMI%3E2.0.CO;2


