Craters on Pluto and Charon show that Kuiper belt collisions are rare
DOI: 10.1063/PT.3.4196
The number of known objects in the solar system’s asteroid belt, between the orbits of Mars and Jupiter, has exploded in recent years. In 2000 just a few thousand asteroids had been numbered, meaning that they’d been observed precisely enough to determine their orbits. Since then, the catalog has grown to more than half a million, with tens of thousands of additions each year.
The increase is easily explained. Newer telescopes can detect smaller asteroids—with diameters as small as hundreds of meters—and there are vastly more small asteroids than large ones. The size distribution reflects the asteroid belt’s collisional equilibrium. For billions of years, asteroids have crashed into each other, sometimes sticking together and sometimes breaking into pieces, and the balance of those processes has reached a rough steady state.
Something fundamentally different seems to be going on in the Kuiper belt, the torus-shaped zone of dwarf planets and smaller objects beyond the orbit of Neptune. In 2015 NASA’s New Horizons probe transmitted the first close-up images of Pluto—the best known resident of the Kuiper belt—and its largest moon Charon (shown in figure
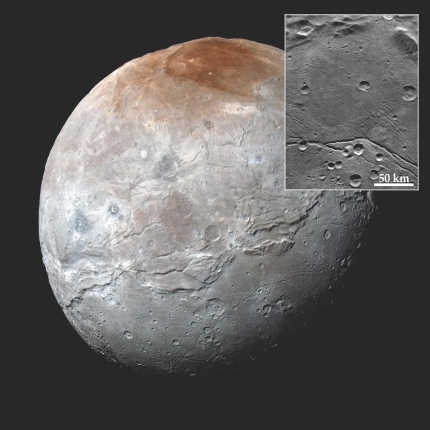
Figure 1.

Images of Charon, captured in July 2015 by NASA’s New Horizons probe, show parts of the moon’s surface to be peppered with craters, a record of 4 billion years of impacts by Kuiper belt objects.
NASA/JHUAPL/SWRI
Now Kelsi Singer (Southwest Research Institute in Boulder, Colorado) and her colleagues on the New Horizons team have analyzed the crater size distributions. 1 The smallest craters they observed still outnumber the larger ones, but by more than an order of magnitude less than collisional equilibrium would predict. The result, which implies that KBO collisions are not frequent enough for the Kuiper belt to have reached collisional equilibrium, provides an important new constraint on models of how the solar system formed 4.5 billion years ago.
Far out
In the wake of the 1930 discovery of Pluto, several astronomers, including Gerard Kuiper, speculated that more small bodies might occupy the same general region at the outer edge of the known solar system. But it wasn’t until 1992 that David Jewitt and Jane Luu made the first observation of a KBO other than Pluto or Charon (the latter discovered in 1978).
More KBO discoveries followed, and their number grew to hundreds and then thousands. (See the article by Mike Brown, Physics Today, April 2004, page 49 .) The 2005 discovery of Eris, a KBO more massive than Pluto and almost as large, made clear that not only was Pluto not alone in the Kuiper belt, it wasn’t uniquely outstanding among KBOs. The realization prompted the International Astronomical Union to issue a new formal definition of “planet,” and Pluto famously—or infamously—no longer qualified.
Pluto and Eris are both more than 2000 km in diameter, and Charon is about half that. All three can be seen by Earth-based telescopes, even at their great distance. But it’s much harder to observe smaller KBOs, especially those with diameters less than tens of kilometers, so the overall KBO size distribution has been shrouded in mystery.
There have been a few clues. Occasionally KBOs get kicked out of their orbits and launched toward the inner solar system. Some leave craters on the icy moons of the gas-giant planets that were imaged by probes such as Galileo and Cassini, and some enter eccentric orbits around the Sun and are visible from Earth as comets (see the article by Don Brownlee, Physics Today, June 2008, page 30 ). Neither the icy-moon craters nor the comets show any sign of the vast numbers of small KBOs one would expect if the Kuiper belt were like the asteroid belt. But neither population is a smoking gun, because some unknown mechanism might destroy or disrupt small KBOs on their journey inward.
Old and cold
Launched in 2006, New Horizons had among its goals the determination of the KBO size distribution. The distribution would have to be inferred from craters: New Horizons was designed to study the surfaces and atmospheres of Pluto and its moons, not to survey large portions of the sky to look for KBOs themselves.
But nobody knew if there would be any craters. Pluto and Charon’s geology was as yet unknown, and maybe some process was at work to renew the surfaces and erase the craters. Indeed, some regions—such as the Tombaugh Regio, the bright heart-shaped feature on Pluto—had been renewed recently and were crater-free. But others appeared much older and had many craters.
Before the probe’s arrival at Pluto, Sarah Greenstreet, Brett Gladman, and William McKinnon (all of them also authors on reference ) worked out a model of the cratering physics on Pluto and Charon to help interpret the observations. 2 Based on what was known from Earth-based observations of the KBO size distribution, they predicted the number of craters formed per size bin per unit time. Prediction in hand, they could immediately estimate the surface ages when the images came in.
Figure
Figure 2.

Crater frequency as a function of crater diameter D and scaled by D−3. Collisional equilibrium predicts a power-law dependence of between D−3 and D−4, but below D = 15 km, Charon crater distribution (shown by the gray, purple, yellow, and red data) abruptly switches to D−1.7. Craters on Pluto, not shown here, exhibit a similar shift. The slope change, or elbow, is not reproduced by any model of collisional dynamics, but a similar frequency distribution (shown in green) is predicted by the craters observed on Jupiter’s moons Europa and Ganymede. (Adapted from ref.
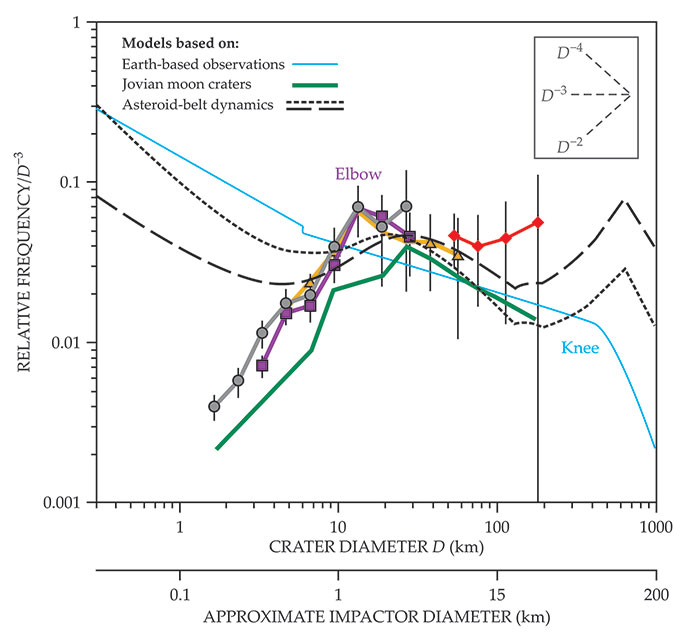
The blue curve is what Greenstreet and colleagues’ model predicts for a surface age of 4 billion years; the gray, purple, yellow, and red data points are crater counts from regions of Charon. The agreement for craters between 20 km and 100 km in diameter (formed by KBOs roughly 2–15 km in diameter) shows that the surfaces are probably almost as old as the solar system itself.
Disjointed
The smaller craters revealed a more striking result: Around D = 15 km, the power-law slope abruptly shifts from −3 to −1.7. All cratered regions on both Pluto and Charon show the same shift, and at approximately the same size scale. Singer was surprised. “I was expecting a more subtle result,” she says. “But the strong change is more interesting.” She’s dubbed the bend in the curve the “elbow,” because the KBO size distribution already has a “knee” at an object diameter of 100 km.
Singer and colleagues considered the possibility that the craters they saw weren’t reflective of all the KBOs that have struck Pluto and Charon. Perhaps geological processes were erasing some craters but not others. But they could identify no process that would erase more than 90% of the small craters, leave all the large ones untouched, and work in exactly the same way on Pluto and Charon despite their geological differences. Pluto’s thin atmosphere, for example, could produce a snow of frozen nitrogen that might obscure some craters. But Charon lacks an atmosphere.
Models inspired by the asteroid belt’s dynamics can reproduce something like the elbow, as shown by the black dotted and dashed curves in figure
The researchers had another chance to test their interpretation a few months ago when New Horizons flew by 2014 MU69, a KBO nicknamed Ultima Thule. At just 32 km long, it doesn’t have room for many craters, but it does have some. Before the flyby, Greenstreet and colleagues worked out how many there should be based on their analysis of Pluto and Charon. 3 When they compared their model to the images, says Gladman, “It appears to be bang on. It was incredible.”
No chip off the old block
The dearth of small KBOs suggests not only that the Kuiper belt is not in collisional equilibrium, but that it’s barely collisionally evolved at all. Even a small number of destructive collisions between large KBOs would produce many more small KBOs than the researchers see, so the logical conclusion is that those collisions haven’t happened. “These objects condensed out of the solar nebula,” explains Gladman, “and they’ve been sitting there, just like that, ever since.” In the much denser asteroid belt, in contrast, virtually every small object seen today is either a fragment broken off a larger one or a collection of such fragments.
If KBOs are representative of the original planetesimals that populated the infant solar system, then their size distribution is an important benchmark for researchers seeking to understand how the solar system formed in the first place. The mechanism by which dust grains combined to form pebbles, boulders, and eventually planets is a major unsolved problem in planetary science, because pebbles and boulders are too small to stick together under their own gravity.
Modelers have some ideas of mechanisms that might work, but testing them is another story. Lab experiments can’t mimic the formation of the solar system in detail, so researchers are left to test their computer simulations against rough measures, such as whether they produce the right number of planets. (See Physics Today, November 2015, page 16 .) The Kuiper belt, as a surviving remnant of the early solar system, could provide another test: Somewhere along the way, a successful model will now have to reproduce the KBO size distribution.
References
1. K. Singer et al., Science 363, 955 (2019). https://doi.org/10.1126/science.aap8628
2. S. Greenstreet, B. Gladman, W. B. McKinnon, Icarus 258, 267 (2015). https://doi.org/10.1016/j.icarus.2015.05.026
3. S. Greenstreet et al., Astrophys. J. Lett. 872, L5 (2019). https://doi.org/10.3847/2041-8213/ab01db
More about the authors
Johanna L. Miller, jmiller@aip.org


