Catching a submarine volcano in the act
DOI: 10.1063/PT.3.1665
About 80% of Earth’s volcanism occurs underwater. Out of sight and largely out of reach in the deep ocean, submarine volcanoes are hard to study, and direct observations of their eruptions are extremely rare. So for guidance into how they work, geologists have had to rely principally on the rich data from land-based volcanoes that erupt into the atmosphere.
Water’s influence on the behavior of submarine volcanism can be significant, though. Dissolved gases in the magma tend to remain there when it erupts at depth, under pressure, as lava. Fewer bubbles form, and the eruptions tend to be less explosive than they would be on land, with lava flows that are less frothy. And when the lava spills from fissures during an eruption, the crust formed by rapid cooling as molten rock contacts near-freezing seawater is denser and more insulating than the crust of lava exposed to air. Counterintuitively, deep-sea lavas thus stay hotter and more fluid for longer than similar flows on land.
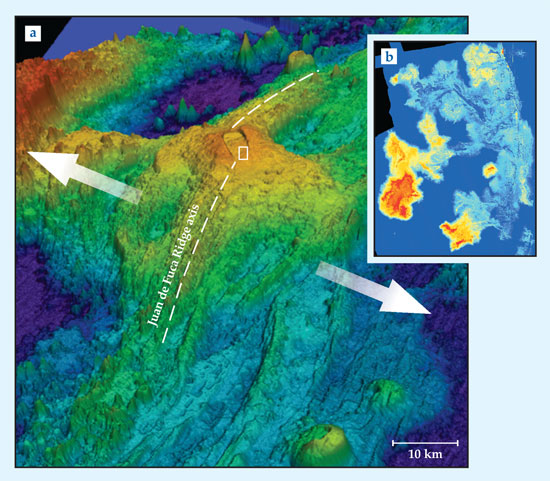
Fortunately, not all submarine volcanoes are prohibitively remote. Among the most interesting is Axial Seamount, a hotspot volcano shown in figure 1, that sits on a segment of the mid-ocean ridge less than 500 km off the coast of Oregon, about a day’s cruise by ship. In 1996 the National Oceanic and Atmospheric Administration established the New Millennium Observatory to study the influence of volcanism on hydrothermal communities. As if on cue, Axial erupted two years later, the first submarine volcano to be detected remotely and monitored in situ.

Figure 1. Axial Seamount is a hotspot volcano under 1500 m of ocean along the Juan de Fuca branch of the mid-ocean ridge off the Oregon coast. (a) Over eons, the seamount has become elongated, and rafted away with the sea floor as the tectonic plates gradually spread apart in the directions shown by the arrows. At the volcano’s summit sits a rectangular caldera, its flanks pockmarked by fissures, hydrothermal vents, and lava channels. Warmer colors indicate higher elevation. (b) Made from the difference between pre- and posteruption bathymetry of the sea floor, this enlargement of the southeast border (outlined in white in panel a) of the caldera shows new lava flows at 1-m lateral resolution. Color designates increasing thickness, from dark blue (a few centimeters) to bright red (up to 15 m). (Adapted from ref.
During the past decade, the emphasis has shifted to monitoring the dynamic evolution of the volcano itself. Thanks to recent advances in deep-sea technologies, researchers began conducting high-resolution bathymetric surveys and populated the sea floor in and around the volcano’s central crater, or caldera, with pressure gauges and hydrophones to pick up the ground’s rise and fall and the seismicity associated with it.
So when Axial erupted again on 6 April 2011, a collaboration of 16 researchers from six universities and institutes was ready for it. Their measurements before, during, and after the event captured the action at close quarters, continuously, and in unprecedented detail. 1–3 The data reveal a direct link between the movement of magma, the frequency of earthquakes, and the deformation of the sea floor.
Inflated balloons
The basic mechanism behind mid-ocean-ridge volcanism is well known. As tectonic plates spread apart and mantle rock wells up to fill the gap, magma forms passively from decompression melting. But because Axial also sits over a hotspot, magma can also ascend actively, driven by the convection of buoyant hot jets of melt from deep in Earth’s interior. The robust and steady supply of magma accumulates over years in a reservoir within the crust a few kilometers underground, and pressure builds until the surrounding rock can no longer withstand the stress. At that point, magma-filled cracks and fissures, known as dikes, open and propagate toward the sea floor and eventually break through.
The entire summit of a volcano can inflate like a balloon—and does so at different rates depending on the magma’s depth—only to deflate again during the eruption. The sea-floor’s movements thus reveal the location and geometry of the shallow reservoir and the dynamics of subsurface magma, says Oregon State University’s William Chadwick, who, along with Columbia University’s Scott Nooner, monitored those movements at Axial. Such movements can also herald an impending eruption.
Hydrostatic pressure gauges, the same devices used to detect tsunamis in the deep ocean, can accurately record elevation changes on time scales from seconds to months. But their accuracy can drift over time spans of years by an amount comparable to how much the volcano might inflate—typically 10–20 cm/year. To reestablish the long-term accuracy of the measurements, Chadwick and Nooner used a submersible every couple of years to precisely remeasure benchmark depths in the caldera and quantify the drift.
For years leading up to the 2011 eruption, the inflation rate was gradual and linear at 15 cm/yr. But in the three months before the eruption, it more than tripled to a rate of 50 cm/yr. Then, during the last hour before the eruption started, the floor shot up another 7 cm, a measurement Chadwick and his colleagues interpret as magma intruding from the reservoir to the sea floor. Subsequently, the sea floor subsided by 2.4 m over six days, the duration of the eruption.
Those data represent the only documented measurements of an inflation–deflation cycle at a submarine volcano. Reassuringly, they’re consistent with acoustic data collected by two hydrophones nearby. Hydrophones, essentially vertical-component seismometers, record the signal created when a pressure wave in the rock propagates into the water column. During a four-year period before the eruption, the devices registered a gradual buildup in the number of small, magnitude 2 earthquakes. Two and a half hours before the eruption, the number spiked from a hundred in a day to a swarm of thousands in a few minutes.
Oregon State University’s Robert Dziak attributes the first signal to cracks that form from pressurization as magma collects under the upper crust and the second to the propagation of magma through cracks and fissures toward the sea floor shortly before the eruption. Earlier seismic imaging puts the lid of Axial’s magma reservoir at about 1.5 km below the sea floor. If that’s the case, Dziak argues, it constrains the ascent velocity to 16–21 cm/s, a velocity consistent with that of measured magma migration in land volcanoes.
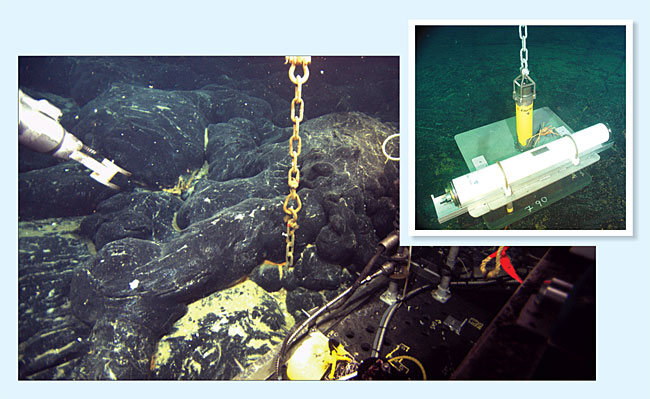
When sea-floor instruments are placed at an active volcano, as they are at Axial, there’s a danger of their being buried in lava, a fate suffered by the one shown in figure 2. But the close proximity is also advantageous: In a relatively flat caldera such as Axial’s, signals echo repeatedly between the sea floor and ocean surface, a signature that makes volcanic quakes stand out from ones generated by the constant background of seismic activity from tectonic faults in the region near Axial.

Figure 2. A chain from an ocean-bottom hydrophone mooring extends from the sea floor, where 1.5 m of pillow lava buried the instrument on 6 April 2011. Astonishingly, the instrument’s internal electronics survived but remain to be rescued. A robotic submersible, with its yellow edge and white manipulator arm, sidled up to the rock to take the picture. The inset shows an unburied hydrophone. (Courtesy of Bill Chadwick, Oregon State University.)
BILL CHADWICK, OREGON STATE UNIVERSITY
Beyond the short, broadband earthquake signals associated with dike propagation, the hydrophones also picked up passing ships, boiling water, whales, and volcanic tremors, all of which could be identified in a spectrogram using frequency analysis. The tremors show up as a single frequency that can last for hours. “Just as water flowing through an open pipe can resonate,” Dziak explains, “the tremor signals are likely caused by magma flowing through conduits and cavities within the volcano.”
Mapping lava flows
The central challenge in mapping the topography of an active submarine volcano is to distinguish between new and preexisting lava flows. A research group led by David Caress (Monterey Bay Aquarium Research Institute) tackled the job by comparing surveys of the sea floor around Axial in the years before the 2011 eruption and a few months afterward, all made using a 5-m-long torpedo-shaped robotic submersible. Programmed to scan the sea floor with multibeam sonar from 50 m above it, the submersible achieved meter-scale lateral resolution, fine enough to map the distribution of lava-spewing fissures and flow patterns and shapes anywhere they are thicker than 20 cm.
Armed with that topographic detail, the researchers then turned to another type of submersible—a tethered remote operating vehicle (ROV)—for a closer look, to collect rock samples and photograph targets of interest. Unfortunately, satellite-based positioning systems like GPS don’t work underwater, which complicates the submersibles’ navigation. To make specific comparisons between different surveys, particularly before and after the eruption, Caress and company developed an optimization model that cross-correlates identical landscape features in the different scans and then snaps the matching pieces together.
The procedure ensured that comparisons between surveys were as finely resolved as features in a single survey and allowed the team to generate depth-difference maps, exemplified in figure 1b, to unambiguously identify the extent and thickness of new lava flows. What they found was remarkable: “The 2011 eruption used most of the same cracks in the ground, filled the same lava lakes, spilled down the same channels, and left basically the same topographic patterns that existed after the earlier 1998 eruption,” says Caress. “That was a real surprise—quite atypical of subaerial volcanoes.” Indeed, measurements made during later ROV dives showed that the 2011 lava completely flooded the earlier channels and then drained away.
In many cases, the flow made its way along a channel for as much as a couple of kilometers before freezing into large mounds, some 15 m thick, says David Clague, a volcanologist on the team. “That speaks to the fluidity of the lava and degree to which the thin crust at the interface with seawater insulates it.”
Real time
According to Adam Soule (Woods Hole Oceanographic Institution), although the depth surveys provide a complete picture of how much lava erupted and what its flows looked like, “we’ve yet to understand what controls it, partly because we can’t observe the eruption in real time.” In fact, researchers were not aware of the eruption at Axial until four months after it occurred; they only discovered it during a routine visit.
Beginning in 2013 the summit of Axial Seamount will be wired as one of seven nodes on the NSF-funded Ocean Observatories Initiative, a project that includes a 900-km network of optical-fiber cables to instruments in the northeast Pacific Ocean. The cables will provide high-bandwidth, real-time access to data. Moreover, as part of the initiative, a suite of seismometers, additional pressure recorders, and other sensors and samplers will be added to Axial, all powered—and in principle, programmable—remotely.
Tracking real-time seismic energy and ground deformation may provide an effective forecasting tool—and not just in the hours preceding an eruption. In 2006, based on time-series measurements of volcanic inflation, Chadwick and Nooner successfully predicted the timing of the latest eruption at Axial to within two years. The next one, they argue, could happen as early as 2018.
References
1. W. W. Chadwick Jr et al., Nat. Geosci. 5, 474 (2012). https://doi.org/10.1038/ngeo1464
2. R. P. Dziak et al., Nat. Geosci. 5, 478 (2012). https://doi.org/10.1038/ngeo1490
3. D. W. Caress et al., Nat. Geosci. 5, 483 (2012). https://doi.org/10.1038/ngeo1496


