Unraveling the mysteries of megadrought
DOI: 10.1063/PT.3.3997


While reflecting on his 12-year term as governor of Colorado, Richard Lamm recalled that his “most terrifying” day in office was the one he spent at Colorado State University learning about tree rings. 1 Around that time, the late 1970s, the state’s water needs were becoming more and more difficult to manage under the auspices of the Colorado River Compact, the 1922 agreement that allocated the river’s water rights among seven western states. Water scarcity had led the states to create a complex physical and legal infrastructure to store, distribute, and manage the natural resource. But the reservoirs and diversions had been constructed to suit a 20th-century climate. When Lamm got a glimpse beyond that narrow historical window, he was frightened by what he saw.
The tree-ring scientists explained that before Colorado attained statehood in 1876, it and the broader region had been struck by several droughts that endured for one, two, or even three decades. The implications of such a drought were “unthinkable” to Lamm. He would later reflect that most people in Colorado, himself included, really had no idea of the American West’s vulnerability to drought. His impromptu lesson in climate history left him wondering how policymakers could possibly guarantee reliable water supplies should a “horrific” decadal or multidecadal drought revisit the region.
Thirty years later drought is still a critical issue for the western US. The Colorado River, which supplies water to nearly 40 million people in the US and Mexico, experienced its worst drought on record 2 between 2000 and 2014. Flows improved in 2015 and 2016 but were still below their long-term average. Farther west, the multiyear drought that first gripped California in 2012 officially ended only last year. Those events were among the most severe and long-lasting dry spells of the past 150 years. If we look back further, however, evidence from natural climate archives suggests that the recent droughts were eclipsed in previous centuries by long-lived events known as megadroughts.
The term megadrought was popularized in 1998 by Connie Woodhouse and Jonathan Overpeck, 3 who used it to describe historical droughts that outlasted the major North American dry spells of the 20th century. Although the term does not have a formal definition, it most commonly refers to a drought that was as severe as, but longer lasting than, the worst 20th-century droughts in a given region. 4 The best evidence to date suggests that megadroughts were unusually frequent in the American West during the first half of the second millennium. Here, we’ll examine the two leading explanations for why those exceptional events happened. And we’ll share some of our latest efforts to gauge the risks of a region-wide megadrought striking again during the coming century.
Nature’s archives
Today the extent and severity of a drought can be tracked in real time using a combination of on-site measurements—say, with river gauges—and remote indicators such as satellite-based estimates of soil moisture. However, the longest continuously operating river gauges go back only to the late 19th century, and satellite measurements span only the past few decades. Because droughts—bad ones, particularly—are rare, a century or so of observations is not enough to characterize their frequency, severity, and duration.
Fortunately for us, droughts leave traces in living organisms and on the landscape itself. A few months of drought can wither crops, emaciate livestock, and draw down reservoirs. It can also alter biological and geological systems in less obvious but longer-lasting ways.
For instance, high rates of evaporation and low rates of rainfall can cause isolated lakes to shrink and shorelines to drop. As previously deep waters become shallow, the local blend of waterborne microorganisms changes. When those microorganisms die, their durable silica bodies sink to the bottom of the water column, where they are preserved underneath a blanket of gently settling mud. A core taken from the lake’s sediment therefore serves as a natural time capsule, with younger mud at the top and older material farther down. Sections dominated by the remains of species known to thrive in shallow waters may be evidence of drought-driven reductions in the water level. 5
Farther down the hydrological ladder, water that seeps through cracks in the bedrock can eventually flow into deep underground caverns. When mineral-rich groundwater drips from cave walls or ceilings, it creates stalactites, stalagmites, and other formations, collectively named speleothems. Because the growth rate of speleothems depends in part on the flow rate of water into the cave, intervals of slow growth can indicate drought at the surface. The chemical composition of speleothems can also reveal changes in rainfall rates and shifts in sources of precipitation. 6
Droughts leave many other traces: Tree stumps rooted deep underwater on former shorelines, relict sand dunes stabilized by grass and other vegetation, and pollen grains from drought-adapted plant species all attest to bygone periods of aridity. But in the American West, there’s no question that tree rings provide the most complete record of droughts across the region.
A tree’s rings provide a year-by-year account of the tree’s growth history: Roughly speaking, wide and narrow rings indicate years of fast and slow growth, respectively. The relationship between that growth history and past environmental stresses depends on the tree’s ecoclimatic setting. Trees growing on high mountains must cope with short growing seasons and cool summers, so the widths of their rings tend to track mean temperatures during the warmest part of the year.
In contrast, at lower elevations where forests give way to scrub or grasslands, trees enjoy the benefits of warmer weather but often lack enough water to sustain them through the growing season. For them, a bounty of rain or snow can make the difference between a good year and a poor one, so their tree-ring sequences can be interpreted as surrogate rain-gauge records. Those records extend back over the trees’ entire life spans. Because many trees in the American West live for a thousand years or more, the data effectively allow us to look back in time an order of magnitude further than we could with instrumental weather records alone.
The tales trees tell
Paleoclimatologists have now collected tree-ring samples from thousands of locations across North America. Specimens from living trees (see figure
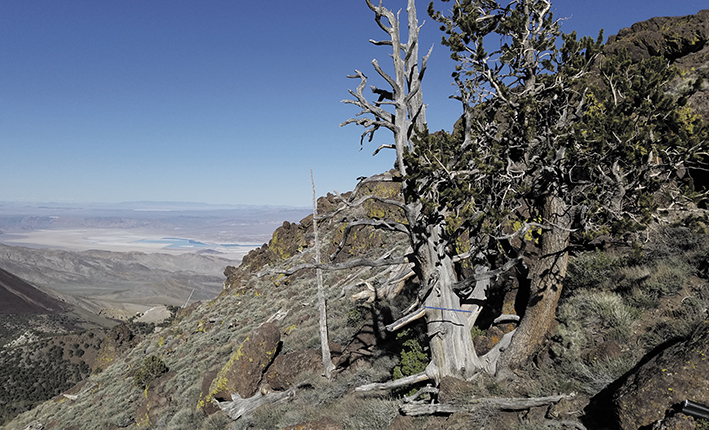
Figure 1.

Long-lived trees in dry forests transcribe a yearly history of drought in their annual growth rings. This 500-year-old Great Basin bristlecone pine, growing on a dry, rocky hill slope in Nevada, depends on water retained in the surrounding soil after snow melts in the late spring. The widths of its rings, combined with the ring-width patterns of other trees in neighboring locations, provide a surrogate record of the region’s precipitation history that extends back hundreds or thousands of years. (Photo by Scotty Strachan.)
For more than 25 years, Edward Cook of Columbia University’s Lamont–Doherty Earth Observatory has led a comprehensive effort to compile ring records from drought-sensitive trees in North America. The resulting product—the North American Drought Atlas 7 —uses tree-ring records from nearly 2000 forest sites in Canada, the US, and Mexico to generate annual maps of summer drought severity that date back to the year 1 BCE.
The maps show that even the most severe droughts of the past century pale in comparison to the megadroughts of the 11th through 15th centuries. Here we define a megadrought as one that was as severe as the multiyear droughts of the 20th century but that persisted for 35 years or more. As shown in figure
Figure 2.

Drought history of the American West as reconstructed from tree rings, including (a) the percentage of the western US (125° W to 105° W; 32° N to 50° N) experiencing a megadrought,
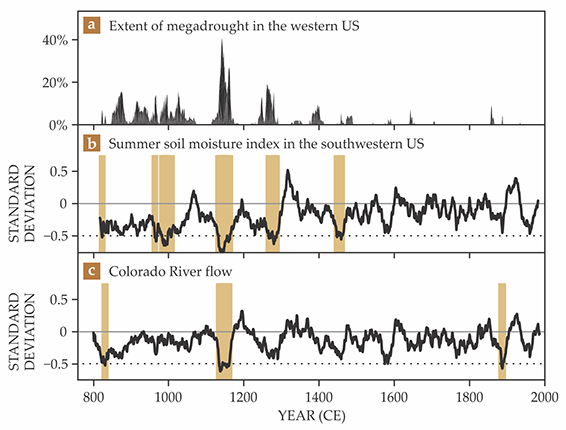
If we focus on the southwestern US, we can identify six megadrought episodes, indicated in figure
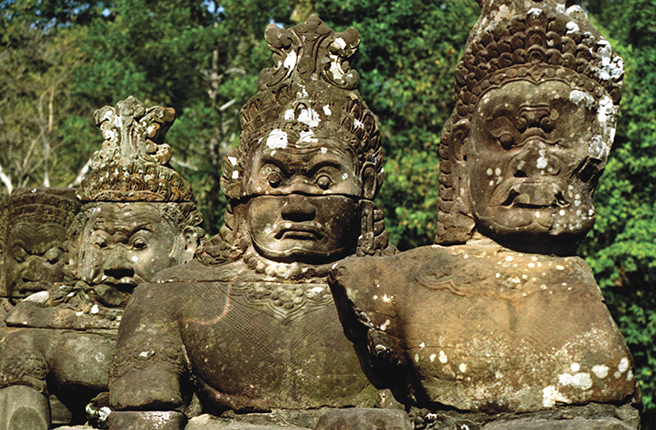
Box. The fall of Angkor
For half a millennium, the medieval megacity of Angkor was the crown jewel of the Khmer Empire, the predecessor state to modern Cambodia. At its peak, the city may have hosted 1 million inhabitants and covered an area larger than Paris does today.
Most historians and archaeologists have attributed the decline and eventual abandonment of Angkor in the early 15th century to political and economic factors. A regional trend toward increased maritime trade would have placed an inland agricultural empire like Angkor at a disadvantage. And Angkor had hostile relations with the neighboring Thai kingdom of Ayutthaya, which sacked and looted the city in 1431 CE. But old trees from the nearby highlands of south Vietnam suggest the demise of Greater Angkor may also have been hastened by megadrought.
Brendan Buckley, a paleoclimatologist from the Lamont–Doherty Earth Observatory, first made the connection between climate and the fall of Angkor in 2010. Tree-ring analysis is often difficult to apply in the tropics because many trees there do not form rings. But Buckley and his team discovered two groves of cypress trees in Vietnam’s Bidoup Nui Ba National Park that had all the qualities needed to piece together past climate history: The trees formed distinct annual rings and were exceptionally long lived (the oldest had almost 1000 rings), and their growth closely tracked year-to-year changes in early monsoon rainfall. According to the cypress trees, 18 immediately before the abandonment of Angkor, that part of Southeast Asia was wracked by two prolonged megadroughts, the first in the mid to late 14th century and the second—shorter but more severe—in the early 15th century.
Angkor would have been poorly suited to deal with the effects of megadrought. Often described as a “hydraulic city,” the sprawling metropolis was dependent on a vast network of canals, embankments, and reservoirs to manage water delivered by the highly variable and unpredictable monsoon. If the tree rings are correct, several decades of weakened monsoons would have led to reduced water supplies and agricultural shortfalls. To make matters worse, during the same periods floods plugged several of Angkor’s major canals with sediment, further reducing the city’s capacity to cope with an unusually variable monsoon.
The temple of Angkor Wat remained active and is still used as a Buddhist monastery today. It and other structures—including the temple of Angkor Thom, home to the statues shown here—have become a lasting embodiment of the architectural genius of the Khmer people. But the city itself never recovered—a victim, perhaps, of the destructive might of megadroughts.

PETER RIMAR
The dry spell that struck the southwest US during the late 1690s did not quite attain megadrought status, but its reach was exceptional, extending from northwestern Mexico to the central Great Plains.
10
The near-megadrought coincided with what tree-ring evidence suggests was a prolonged interval of low flow on the Colorado River during the late 16th century,
11
as shown in figure
Fate or fluke?
Several lines of evidence now suggest that the western US was hit by multiple megadroughts within the past thousand years. How did that happen? What could cause nearly half the western US to become locked into a generation-long dry spell?
In physical climatology, there are two schools of thought regarding how megadroughts occur. The first posits that long-lived droughts are a consequence of external climate forcing: volcanic eruptions, fluctuations in the Sun’s output, small changes in Earth’s orbit, and other factors that influence our planet’s climate but are not affected by it. In that scenario, the era of prolonged megadroughts in the western US occurred because the climate system was “pushed” by some exotic forcing—one that didn’t operate in the past century.
Some evidence supports that explanation. During the medieval period (800 to 1300 CE), a modest increase in solar activity raised global temperatures (though likely not to the levels seen today). 12 A hotter Sun might have enhanced evaporation rates or altered ocean circulations in a way that favored regional drought. 13 If the effects of dry weather were enhanced by positive feedbacks related to dust and vegetation changes, the Southwest might have become prone to megadroughts for centuries.
A second school of thought holds that the flurry of megadroughts could have been a mere coincidence. That notion is supported by so-called general circulation models (GCMs), which model climate by numerically simulating mass and energy flows in the atmosphere, ocean, and cryosphere and at the land surface. GCMs provide a digital test bed for investigating how changes in Earth’s boundary conditions affect climate. When the models use external forcings—solar irradiance fluctuations, volcanic eruptions, and so forth—that match our best estimates of actual climate forcings over the past millennium, the simulated megadroughts show no preference for the medieval period. 14 In fact, the simulations appear to generate megadroughts even when external forcings are held constant at preindustrial levels. 13 Jointly, those two findings add weight to the argument that the spate of megadroughts in the western US happened independently of the external forcings.
The paleoclimate community still isn’t sure which explanation is correct. But the answer bears directly on our ability to gauge the odds of future megadroughts. If the medieval megadroughts that plagued the western US were caused by increased solar irradiance, that could imply that the region is particularly sensitive to changes in radiative forcing and temperature. Present-day climate change, marked by increasing surface temperatures and increased downward IR radiation, would therefore be expected to profoundly influence regional megadrought risks. But if megadroughts don’t require any particular external forcing, the risk of recurrence will depend strongly on the natural variations of the climate system.
A matter of time
Unfortunately, the usual tools for unraveling the origins of megadrought have significant limitations. The history of megadrought in the western US represents just one realization of a vastly complex and chaotic system. We don’t have alternative histories to compare it with. GCM simulations afford us the flexibility to test different forcing scenarios, but they have shortcomings. Although some transient climate simulations produced by GCMs can now simulate more than a thousand years of climate evolution, 14 that’s still too short to produce a statistically meaningful sample of megadroughts. Furthermore, many state-of-the-art GCMs still struggle to correctly simulate variability in the tropical Pacific Ocean, whose El Niño–Southern Oscillation exerts a strong influence on western drought.
Recently the two of us and several of our colleagues tried to work around those obstacles by using a statistical model to test whether megadroughts can occur in the western US simply by chance. 15 Our strictly empirical model had only two inputs: soil moisture estimates based on observational records of temperature, precipitation, and other relevant variables; and ocean surface temperatures from instrumental measurements. It did not directly include any information from tree rings or other natural drought indicators.
We “trained” the model using data from the last half of the 20th century, which meant it did not include the influence of big eruptions, solar changes, and other climate forcings from more than a few decades ago. We also removed any trends that were potentially related to global warming. Because the model was simple and computationally efficient, we could produce thousands of simulations, each of which described month-by-month changes in the drought severity index across the American West with about 100 km spatial resolution over a period of 1000 simulated years.
Had our simulations produced no megadroughts, we would have concluded that those events are possible only when Earth’s climate undergoes a lasting and dramatic change. As shown in figure
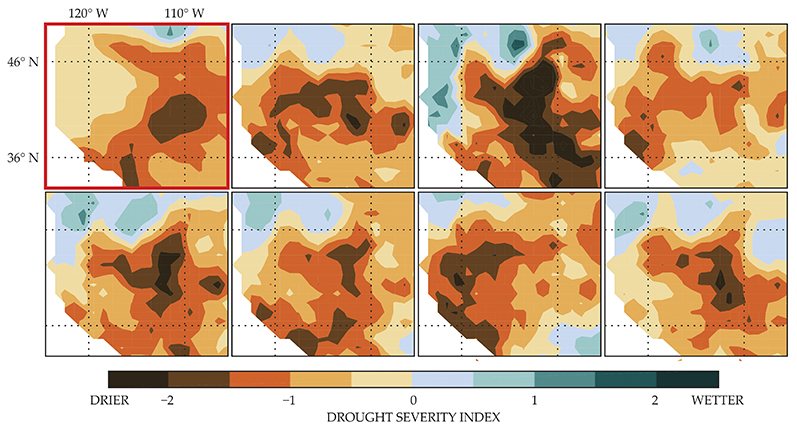
Figure 3.

Real and simulated megadroughts across the American West. The upper left panel, outlined in red, maps the estimated drought severity during the period 1130–1164 CE, when one of the most expansive megadroughts in known history was at its peak. The other panels illustrate the spatial footprint of the worst 35-year drought in a thousand-year statistical simulation run under conditions mimicking a 20th-century climate.
The only aspect of real-world megadroughts that our model could not duplicate was the large number of events during the medieval period, which suggests that the apparent “megadrought cluster” was probably driven at least partly by unusual climate circumstances. It remains unclear, however, whether such conditions require external forcings or whether they could be generated by natural climate fluctuations.
Even one megadrought would be tremendously disruptive to modern society in the western US. Our test indicates that such a drought is possible even in the absence of climatic change. But of course, Earth’s climate is changing. How do present-day climate trends affect the risks of a future megadrought?
Rising risks
The exact cause of the megadroughts of the early second millennium is still a point of debate in the climate science community. But the physical relationships between drought and mean climate change are well understood, so we can nonetheless estimate the probability of a megadrought occurring in the next century or so.
We know that anthropogenic climate change will warm the western US, which in turn will cause the atmosphere to draw more moisture from the land surface through evapotranspiration. 16 , 17 (See the article by Bjorn Stevens and Sandrine Bony, Physics Today, June 2013, page 29 .) Effects of climate change on precipitation are more difficult to predict, but most models agree that much of the southwestern US will experience a decline in cool-season precipitation. 10 The Southwest is already the driest part of the continental US, and those two trends are expected to raise the region’s risk of future megadroughts. How much may depend on the efficacy of global efforts to curb greenhouse gas emissions.
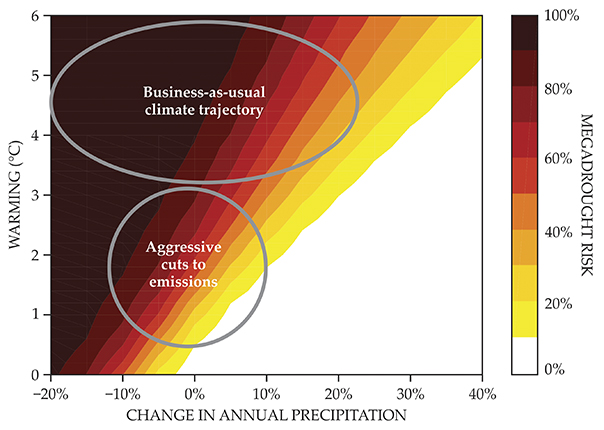
Our work suggests that in the business-as-usual scenario, in which future emissions follow the trends of the recent past, rising temperatures would drive megadrought risks in the southwestern US to unprecedented highs—between 70% and 100%—as figure
Figure 4.

Megadrought risk estimates for the American Southwest in the second half of the 21st century, for various precipitation and temperature scenarios.
Lessons of yore
Drought has been exacting bitter tolls on humankind since the beginning of recorded history. Historical and folkloric accounts of multiyear droughts date back millennia. The Famine Stela, an inscription carved more than 2000 years ago in a rock near Aswan, Egypt, describes a seven-year period during the reign of the Pharaoh Djoser (circa 2600 BCE) in which the Nile did not flood. In The Epic of Gilgamesh, which dates to roughly 2100 BCE, the titular hero slays the Bull of Heaven to end a protracted drought. And the biblical story of Joseph describes seven years of plenty in the land of Egypt followed by seven years of famine.
Paleoclimate research has shown that long intervals of unbroken drought are not just a plot device used by mythmakers but rather a normal feature of climate in many parts of the world. Although the westward expansion of the US coincided with a climatic interval that has been, by and large, free of megadrought, 9 the American West could soon slip into a decades-long drought, even without any unusual climate forcing.
In the story of Joseph, the dire effects of the seven-year drought were avoided thanks to divinely inspired foresight, which gave the pharaoh, Joseph, and the Egyptians time to prepare. As a result, they had full larders while neighboring kingdoms went hungry. In today’s American West, improved understanding of climate history offers a similar opportunity for foresight. If leaders responsible for managing the region’s water prepare wisely, we just might avoid the dire consequences that befell our predecessors hundreds of years ago.

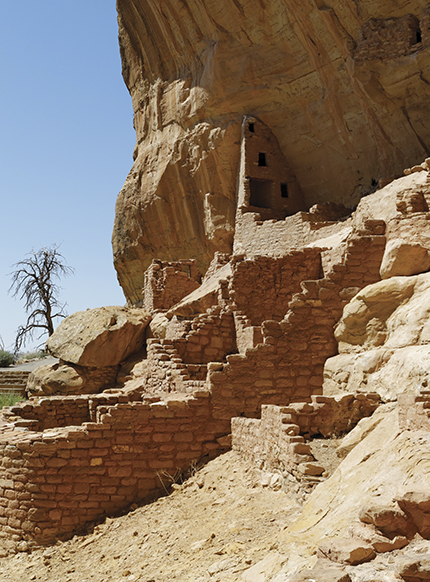
During the 12th century, ancestral Puebloans built communities of cliff dwellings like the one shown here in present-day southwest Colorado. Climate scientists suspect that a decades-long drought drove the Puebloans to abandon the buildings in the late 13th century. (Photograph by Kimon Berlin, CC BY-SA 2.0 .)
Our research on megadroughts has received support from NSF and the Alexander von Humboldt Foundation.
References
1. Colorado River Water Users Association, Richard Lamm oral history, www.crwua.org/documents/about-us/oral-histories/Richard-Lamm.pdf .
2. B. Udall, J. Overpeck, Water Resour. Res. 53, 2404 (2017). https://doi.org/10.1002/2016WR019638
3. C. A. Woodhouse, J. T. Overpeck, Bull. Am. Meteorol. Soc. 79, 2693 (1998). https://doi.org/10.1175/1520-0477(1998)079<2693:YODVIT>2.0.CO;2
4. R. Seager et al., J. Clim. 21, 6175 (2008). https://doi.org/10.1175/2008JCLI2170.1
5. K. R. Laird, B. F. Cumming, J. Paleolimnol. 42, 65 (2009). https://doi.org/10.1007/s10933-008-9248-9
6. S. McCabe-Glynn et al., Nat. Geosci. 6, 617 (2013). https://doi.org/10.1038/ngeo1862
7. E. R. Cook et al., J. Quat. Sci. 25, 48 (2010). https://doi.org/10.1002/jqs.1303
8. S. Stine, Nature 369, 546 (1994). https://doi.org/10.1038/369546a0
9. B. I. Cook et al., Wiley Interdiscip. Rev. Clim. Change 7, 411 (2016). https://doi.org/10.1002/wcc.394
10. D. W. Stahle et al., Eos 81, 121 (2000). https://doi.org/10.1029/00EO00076
11. D. M. Meko et al., Geophys. Res. Lett. 34, L10705 (2007). https://doi.org/10.1029/2007GL029988
12. T. F. Stocker et al., eds., Climate Change 2013: The Physical Science Basis—Working Group I Contribution to the Fifth Assessment Report of the Intergovernmental Panel on Climate Change, Cambridge U. Press (2013).
13. S. Coats et al., J. Clim. 28, 124 (2015). https://doi.org/10.1175/JCLI-D-14-00071.1
14. B. L. Otto-Bliesner et al., Bull. Am. Meteorol. Soc. 97, 735 (2016). https://doi.org/10.1175/BAMS-D-14-00233.1
15. T. R. Ault et al., J. Clim. 31, 3 (2018). https://doi.org/10.1175/JCLI-D-17-0154.1
16. B. I. Cook, T. R. Ault, J. E. Smerdon, Sci. Adv. 1, e1400082 (2015). https://doi.org/10.1126/sciadv.1400082
17. T. R. Ault et al., Sci. Adv. 2, e1600873 (2016). https://doi.org/10.1126/sciadv.1600873
18. B. M. Buckley et al., Proc. Natl. Acad. Sci. USA 107, 6748 (2010). https://doi.org/10.1073/pnas.0910827107
More about the authors
Toby Ault is an assistant professor of Earth and atmospheric sciences at Cornell University in Ithaca, New York. Scott St. George is an associate professor of geography, environment and society at the University of Minnesota in Minneapolis.


