Thermal conductivity through the 19th century
DOI: 10.1063/1.3480074
The quantitative study of heat became feasible in the early 18th century when Daniel Fahrenheit (1686-1736) invented a mercury thermometer capable of reproducible measurements. Even earlier, however, at the turn of the century, Guillaume Amontons (1663-1705) had intuitively surmised that heat flowed in solids in the direction of decreasing temperature and that temperature varied in some predictable manner with distance—Amontons himself thought the variation was linear. In 1761 Joseph Black (1728-99) introduced the concepts of latent heat and specific heat, both of which pertain to heat storage rather than to heat movement. With the invention of the calorimeter in the 1780s by Antoine Lavoisier (1743-94) and Pierre Simon Laplace (1749-1827), the latent heat of melting ice proved to be a standard for quantifying heat. 1 The nature of what had been quantified, though, would elude comprehension throughout the 19th century.
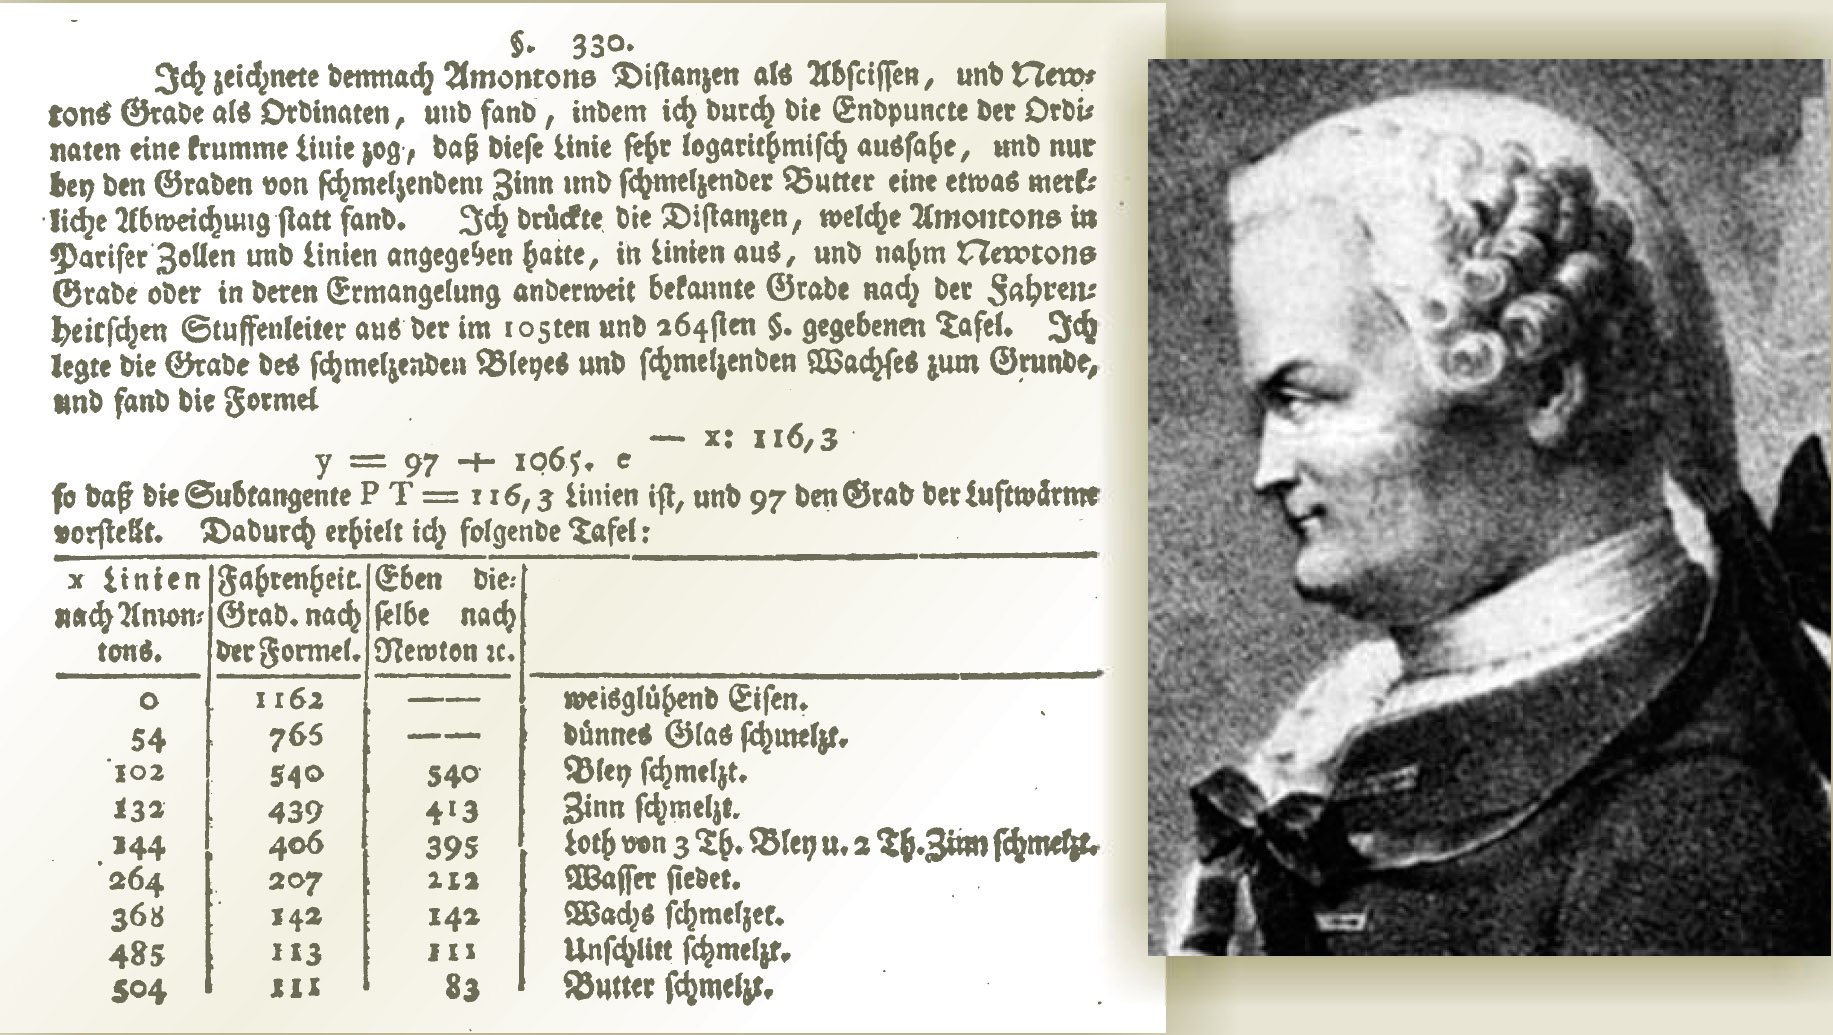
In 1776 Johann Heinrich Lambert (1728-77) took a major step forward in understanding heat movement in solids by considering a long metal rod heated at one end, with heat allowed to radiate to the atmosphere. His motivation in performing that experiment was to correct Amontons’s suggestion of a linear temperature profile. The experiment and its interpretation were posthumously published in 1779. 2 As explained in figure 1, Lambert found that the temperature profile along the rod decreases logarithmically.

Figure 1. Johann Heinrich Lambert, a versatile scientist and philosopher, introduced the heat-conservation framework for analyzing heat conduction in a rod heated at one end and allowed to dissipate energy to the atmosphere. He showed that the temperature y and distance x in his experimental data satisfied an exponential relation, y = 97 +1065 · exp(−x/116.3). The left column in the table gives the distance, with units unspecified. The next two columns give the temperature in the Fahrenheit and Newton scales, respectively, based on the melting or boiling of various substances (column 4). From top to bottom, the materials tested by Lambert are specified as white-hot iron, thin glass, lead, tin, lead-tin alloy, boiling water, wax, melting tallow, and butter.
(Table adapted from ref.
Lambert exhibited remarkable insight in framing steady-state heat conduction in terms of energy balance when he remarked,
The heat flows gradually to the more distant parts, but at the same time travels from each part to the air. So that when the fire has burnt and been maintained long enough at the same strength, every part of the bar finally acquires a definite degree of heat because it constantly acquires as much heat from parts of the rod nearer the fire as it transmits to the more distant parts and the air. (reference
3 , page 163)
The heat flows gradually to the more distant parts, but at the same time travels from each part to the air. So that when the fire has burnt and been maintained long enough at the same strength, every part of the bar finally acquires a definite degree of heat because it constantly acquires as much heat from parts of the rod nearer the fire as it transmits to the more distant parts and the air. (reference , page 163)
Also insightful was Lambert’s recognition of the importance of geometry in governing the temperature profile. He observed that “there is an uncertainty because Amontons does not say what his rod looked like” (reference , page 187). Lambert’s conceptual framework played an important role in a later formulation of the heat equation by Joseph Fourier (1768-1830).
At about the time of Lambert’s experiment, Benjamin Franklin (1706-90) conceived a scheme to evaluate relative heat-conducting abilities of different metals by coating them with wax, heating them, and observing the distance to which wax would melt in different cases. During a visit to France in 1780, Franklin gave his experimental concept and the materials he had collected to Jean Ingen-Housz (1730-99), a Dutch biologist and chemist, whom he encouraged to conduct the experiments at his leisure.
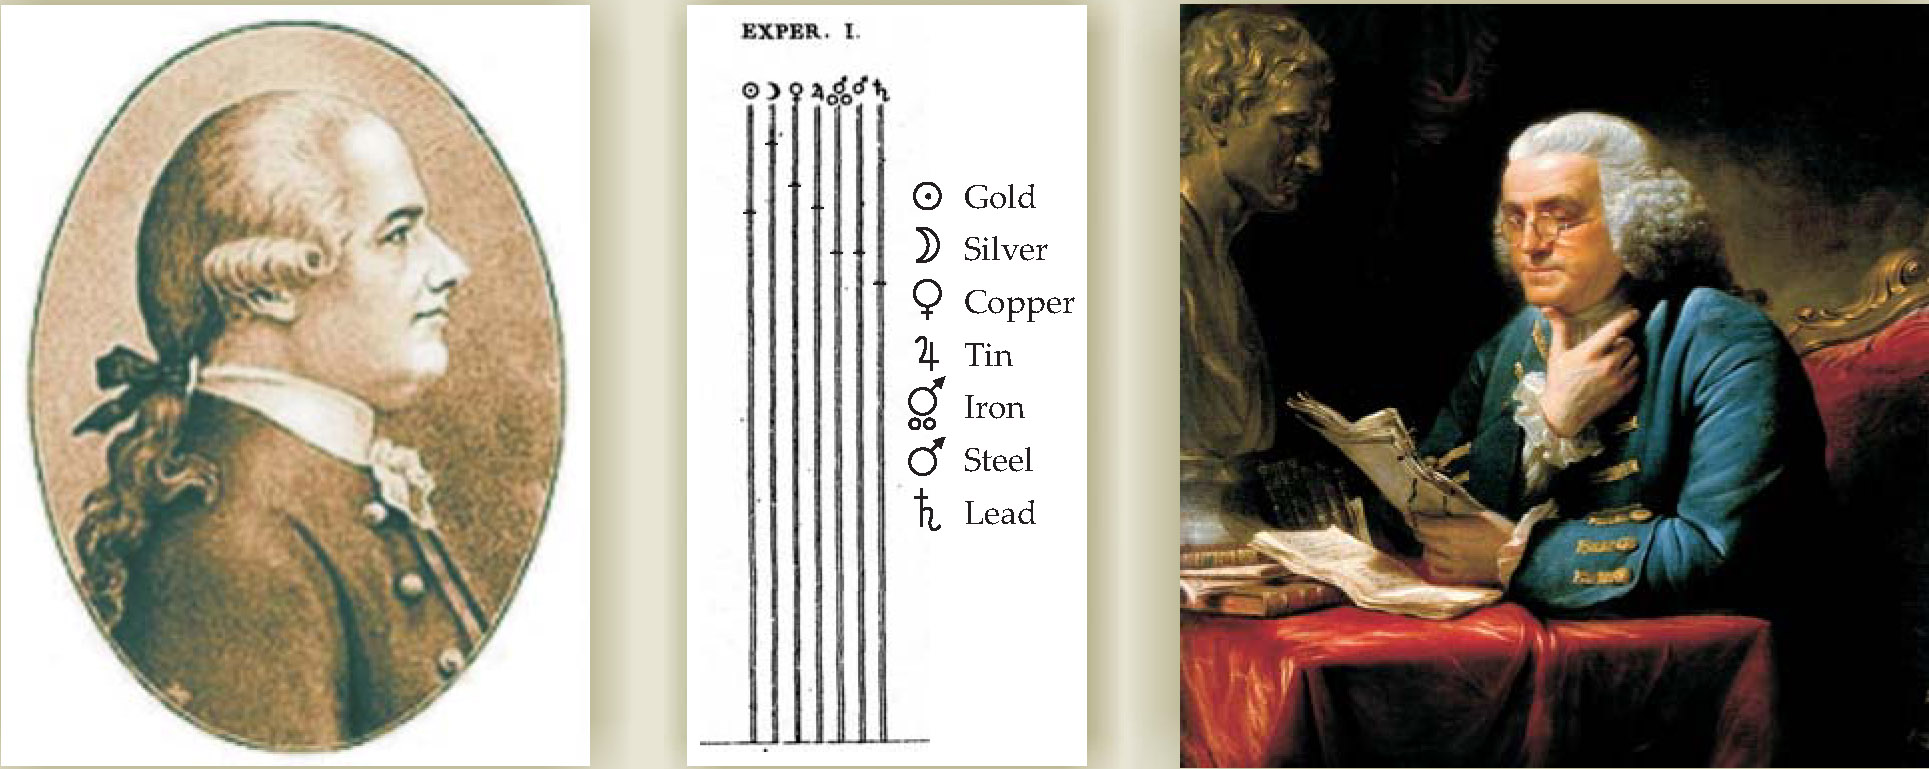
Ingen-Housz coated a number of wires with wax; all had the same length and diameter, but each was of a different material. The wires were tightened in parallel between blocks of wood. Ingen-Housz then dipped one end of each wire in hot oil, taking care to dip all the wires at the same time and over the same length. He observed that the wax coat melted along all wires, but the speed of the melt propagation varied among the materials; he presumed that it varied directly with the speed with which heat ran through the various metals. 4 In all, he conducted 12 experiments using seven metals. Results from one of those experiments are shown in figure 2. Although Ingen-Housz observed some variation, he found the following order of decreasing conductivity: silver, copper, gold, tin, iron, steel, and lead.

Figure 2. In a transatlantic collaboration, Jean Ingen-Housz (left) evaluated relative conductivities of different metals based on the experimental design and materials of Benjamin Franklin (right). The idea was to coat wires of various materials with wax and see how quickly the melt line propagated when one end of the wires was heated. The figure shows melt propagation distances from the bottom for seven materials at a fixed time. In a gracious acknowledgment, Ingen-Housz stated, “If these results bring light to the question we are trying to resolve, it is to this great man that physics will be indebted, not to me, who only followed exactly the project of Mr. Franklin.”
(Propagation figure adapted from ref.
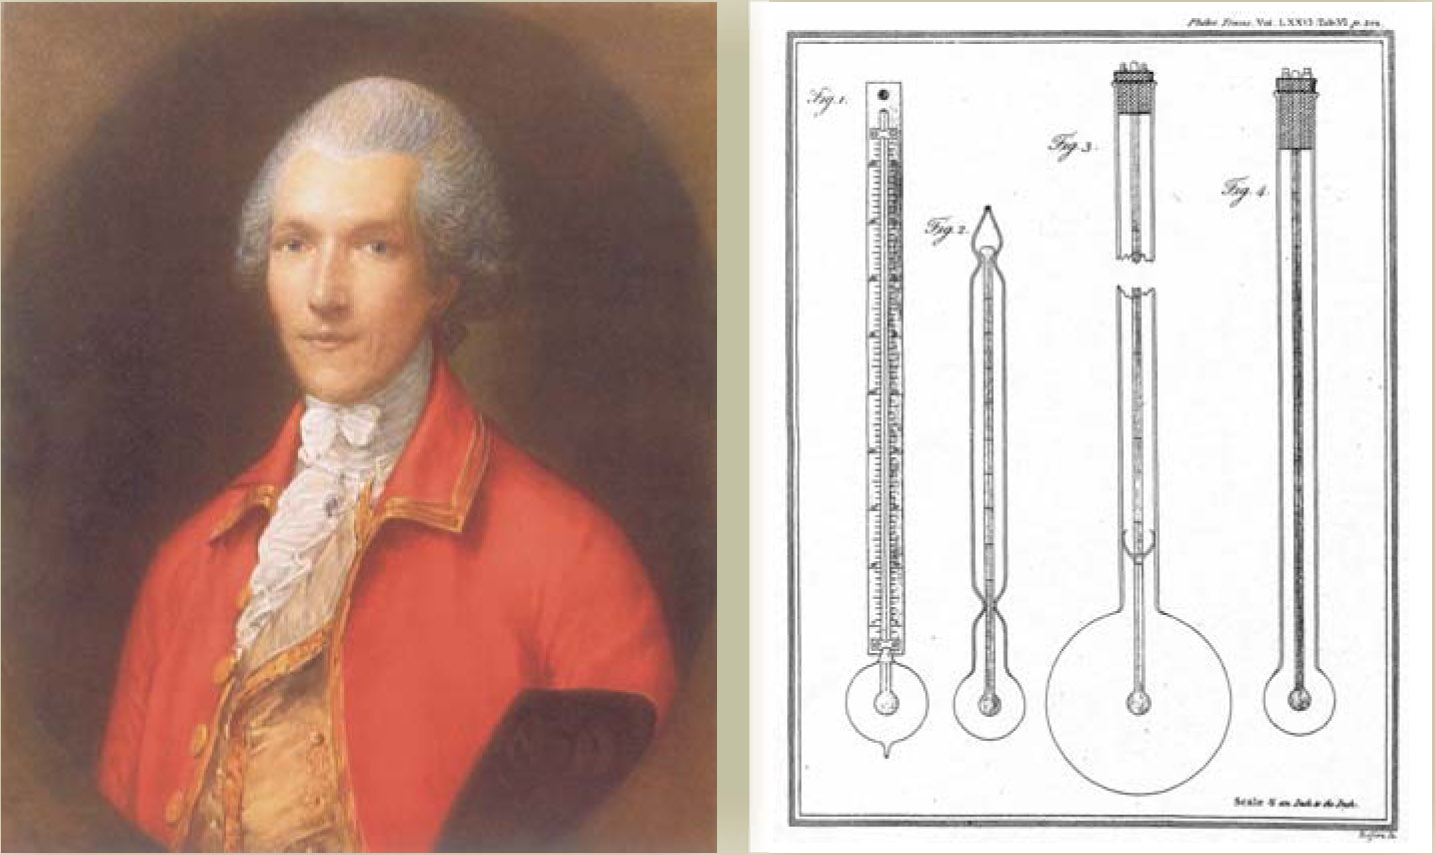
The next major contribution was that of Count Rumford (born Benjamin Thompson; 1753-1814). Motivated by the need to more efficiently clothe the Bavarian army, Rumford studied relative insulating properties of cotton, silk, wool, fur, down, and other materials. His basic apparatus, shown in figure 3, consisted of a thermometer enclosed and hermetically sealed in a carefully blown glass bulb. The bulb was evacuated or filled with a material of interest: air, water, mercury, silk, wool, fur, and so on. Rumford used one of two procedures: He either plunged the apparatus first into a hot bath and then into freezing water to observe the gradual decline in temperature as a function of time, or he reversed the process, plunging the apparatus first into freezing water and then into a hot bath. Regardless, the rate of heat loss or gain as revealed by the temperature-time relation was considered a measure of thermal conductibility. Based on his experiments, Rumford concluded, for example, that moist air was a better conductor than common air. Some of the materials he studied and their relative conducting powers 5 are mercury (1000), moist air (330), water (313), common air (80.41), rarefied air (one-fourth the density of common air; 80.23), and torricellian vacuum (55).

Figure 3. Count Rumford (Benjamin Thompson) was a scientist, inventor, and entrepreneur. He conducted experiments on heat conduction “with a view to the investigation of the causes of the warmth of natural and artificial clothing.”
(Drawings adapted from ref.
By the close of the 18th century, thermal conductivity had been understood in an intuitive sense, but imprecisely. Neither Ingen-Housz nor Rumford recognized that the rate of change of temperature depends on both thermal conductivity and specific heat. Lambert astutely focused on the steady state. In his experiment, thermal conductivity was masked by radiative heat loss. Nonetheless, the experimental methods of Lambert and Ingen-Housz would have significant influence on 19th-century investigations of heat conduction.
Fourier’s theory of heat conduction
In 1802, upon his return to France from Napoleon’s Egyptian campaign, Fourier was appointed prefect of the department of Isère. Despite heavy administrative responsibilities, Fourier found time to study heat diffusion. 6 He was inspired by deep curiosity about Earth and such phenomena as the attenuation of seasonal temperature variations in Earth’s subsurface, oceanic and atmospheric circulation driven by solar heat, and the background temperature of deep space. 7 Fourier began with a paper by Jean Baptiste Biot (1774-1862). 8 Without citing Lambert, Biot had attempted to formulate a differential equation for heat conduction in a rod heated at one end and able to dissipate heat to the atmosphere. His approach was based on action at a distance and Newton’s law of cooling, which states that the rate of cooling of an object is proportional to the difference between the object’s temperature and that of the atmosphere. That line of attack was unsuccessful because Newton’s law, appropriate for radiative heat loss, is inadequate for conductive transfer.
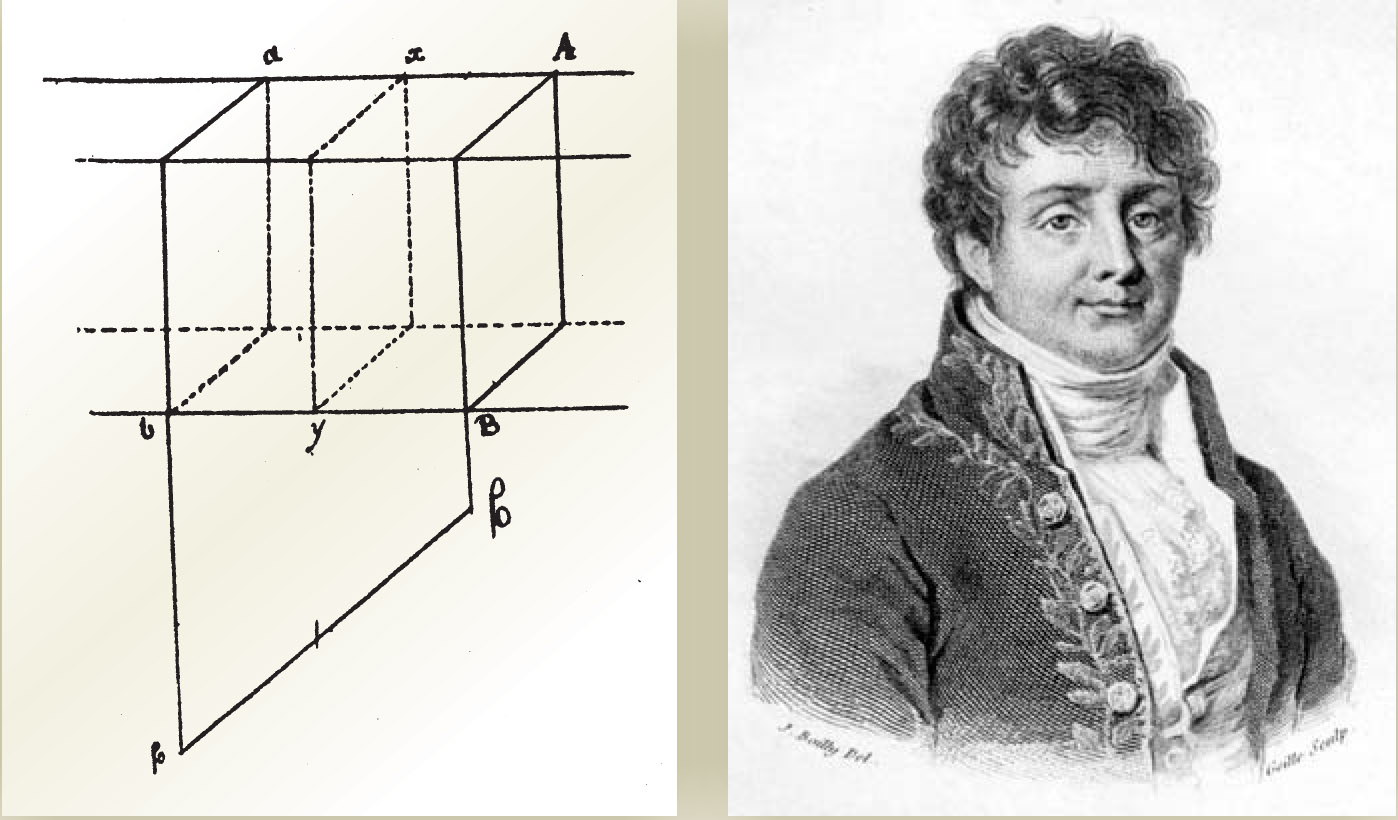
Starting with Biot’s approach, Fourier obtained mathematical results that were incorrect and unsatisfactory. He then abandoned the action-at-a-distance approach and, based on his own physical reasoning, concluded that temperature varied continuously along the length of the rod. Fourier recognized that conservation of heat, as conceived by Lambert, required that conductive heat flow along the rod be balanced by radiative heat loss to the atmosphere. Accordingly, he made a distinction between external conduction, governed by Newton’s law, and internal conduction. Thermal conductivity, appropriate for characterizing the internal conduction, was defined by Fourier as the quantity of heat per unit time passing through a unit cross section divided by the temperature difference of two constant-temperature surfaces separated by unit distance (see figure 4). Fourier presented his ideas in an unpublished 1807 paper submitted to the Institut de France. 9

Figure 4. Joseph Fourier’s first considerations of heat flow were presented in an unpublished article from 1807.
(Sketch adapted from ref.
Fourier was not satisfied with the 1807 work. It took him an additional three years to go beyond the discrete finite-difference description of flow between constant-temperature surfaces and to express heat flux across an infinitesimally thin surface segment in terms of a temperature gradient. Historian of science John Herivel 3 and mathematician Ivor Grattan-Guinness 6 give detailed discussions of the transition. Fourier’s refinement enabled him to express the boundary condition at the radiative surface as hT = −KdT/dn, where h is a radiative heat transfer coefficient, also called external conductivity; T, the temperature in excess of the atmospheric value; K, the thermal conductivity; and n, the normal coordinate, defined to increase from inside to outside. In particular, in Fourier’s final formulation, the flow process in the interior is distinct from that at the surface.
Fourier’s experiments
When Fourier presented his mathematical theory, the nature of heat was unknown: There was active debate as to whether it was a fluid (called caloric) or a kind of motion. Fourier considered mathematical laws governing the effects of heat to be independent of all hypotheses about the nature of heat. It was known that with the help of a Lavoisier-Laplace calorimeter, the quantity of heat contained in a body could be quantified in terms of an equivalent quantity of heat required to change a certain mass of ice to liquid. But no method was available to measure flowing heat. Consequently, in order to demonstrate that his mathematical theory was physically credible, Fourier had to devise suitable experiments and methods to measure thermal conductivity.
It is not widely recognized that in his unpublished 1807 manuscript and in the prize essay he submitted to the Institut de France in 1811, Fourier provided results from transient and steady-state experiments and outlined methods to invert experimental data to estimate thermal conductivity. 10 For some reason, he decided to restrict his 1822 masterpiece, The Analytical Theory of Heat, 7 to mathematics and omit experimental results. In all, Fourier carried out four sets of experiments. Of those, two are pertinent to thermal-conductivity determination; they concerned the distribution of temperature in a heated annulus and the rate of cooling of a sphere.
The first experiment used a polished iron annulus, about 0.35 meters in diameter, with a square cross section of edge size 2L, heated at one point with an Argand oil lamp. Heat was allowed to radiate to the atmosphere across the polished surface. Two groups of three regularly spaced holes—the two sets on opposite quadrants of the annulus—had been drilled halfway through the annulus to hold thermometers. Mathematically, steady-state heat flow is governed by the equation describing Lambert’s experiment: d 2 T/dx 2 = 2hT/KL, where x is the distance along an arc chosen as the x-axis. The solution to the equation is
Equation
Fourier’s other key experiment involved a small sphere with radius X, specific heat C, density D, and h « K. The sphere was heated in the interior to a constant temperature T 0 in excess of atmospheric temperature and allowed to cool in an atmosphere that was maintained at constant temperature. For that case, Fourier found that temperature inside the sphere would vary only slightly around an average time-independent value
Before we turn to Fourier’s determination of thermal conductivity, one other of his results needs mention. In his prize essay, Fourier addressed a terrestrial heat problem that had inspired him, namely, the propagation of diurnal and seasonal temperature changes through Earth’s crust. Noting that Earth’s diameter is very large, Fourier considered an infinite one-dimensional vertical column extending down from the land surface (x = 0), subjected to a periodic variation of surface temperature. The periodic function, in general, is a sum of many sine and cosine waves. Fourier showed that for a simple periodic temperature signal with mean T 0, amplitude A, and period P, the heat equation is satisfied by
with ɛ a constant contribution to the phase offset. That is to say, with increasing depth the perturbation amplitude attenuates and the phase shifts, with both phenomena governed by
Fourier’s determination of K
The first experimental determination of a thermal conductivity in a solid was made by Fourier, who worked with a steel annulus and sphere (reference , pages 14-15). In the absence of any method for measuring flowing heat, he had to rely on knowledge of the external conductivity and specific heat of the material. Accordingly, by taking two temperature-position measurements on the annulus and using equation
Fourier then combined his estimates of h/K and h/CD with the known value of CD to arrive at a value of 3/2 for thermal conductivity; in his convention, the unit of heat was the quantity of heat required to convert 1 kg of ice at the freezing point to an equal mass of water at the same temperature; the other relevant units were meters, minutes, and kilograms.
Given his determination of K, Fourier reconsidered the issue of how temperature changes propagate through Earth’s crust. He substituted his value of CD/K, the only known value for that ratio, into equation
Other 19th-century contributions
In the course of the 19th century, thermal conductivity became a material property of fundamental importance for both scientific and engineering reasons. With his mathematical solutions (equations
Recall that Ingen-Housz used the rapidity with which melting progressed in different materials as a measure of relative conductivity. As noted earlier, he did not recognize the importance of specific heat; as later shown by Fourier, the rate of diffusion actually depends on the quotient K/CD, now known as the thermal diffusivity. Accordingly, César-Mansuète Despretz (1798-1863) ventured to determine relative thermal conductivities more precisely using Fourier’s solution to Lambert’s problem—in particular, the consequence that for three thermometers spaced uniformly along a rod, (T 1 + T 3)/T 2 is a constant.
11
Let 2κ be such a constant, and consider two materials A and B having identical dimensions and exterior conductance h. A little algebra reveals that their relative conducting ability is given by
Despretz found that the ratio of the conductivity of copper to that of iron was 12/5. The set of materials considered by Despretz, from most conducting to least, is copper, iron, zinc, tin, lead, marble, porcelain, and brick.
The most direct way to determine absolute thermal conductivity would be to take a slab of material with parallel walls, with one wall being maintained at the boiling point of water by continuous supply of steam and the other maintained at zero degrees by continuous melting of ice. Then the flux of heat between the walls could be estimated from the quantity of steam condensed or the quantity of ice melted. First introduced by Jean Claude Péclet (1793-1857), 12 that approach and its variants were attempted by others, with limited success.
Discounting the direct method left two approaches for measuring absolute thermal conductivity, both suggested by Fourier. The first, essentially the method he used to determine the thermal conductivity of steel, was to combine steady-state data from a rod heated at one end with data from transient cooling of the same material in the atmosphere. The second approach was to impose a periodic temperature variation at the boundary of a 1D column and record the attenuation of amplitude or lagging of phase with distance from the boundary.
James David Forbes (1809-68; see figure 5), who appears to have been unaware of Fourier’s experimental work on thermal conductivity, determined the absolute conductivity of an 8-foot-long bar of wrought iron with a 1.25-inch-square cross section. 13 He used Lambert’s experimental design, supplemented by a second experiment in which a segment of the same bar was allowed to cool in air. His experimental approach was similar to Fourier’s two-step procedure for steel, but unlike Fourier, Forbes did not rely on solutions to the heat equation; rather, he used a graphical procedure. Accordingly, he plotted temperature T in excess of atmospheric temperature as a function of position x from the steady-state experiment and fitted a smooth curve to enable a graphical estimation of T and dT/dx at any point. He also plotted the decline of T with time from the second experiment and fitted a curve that enabled him to estimate T and dT/dt at any time for the bar segment under consideration.

Figure 5. James Forbes was a meticulous 19th-century experimental physicist who made significant contributions to the science of heat. Forbes independently discovered essentially the same two-step approach that Joseph Fourier used to determine absolute conductivity, but instead of inverting experimental data mathematically as Fourier did, Forbes used a graphical technique and provided the first quantitative estimation of the temperature dependence of thermal conductivity. The illustration shows Forbes’s setup for measuring heat loss to the atmosphere as a function of temperature.
(Illustration adapted from ref.
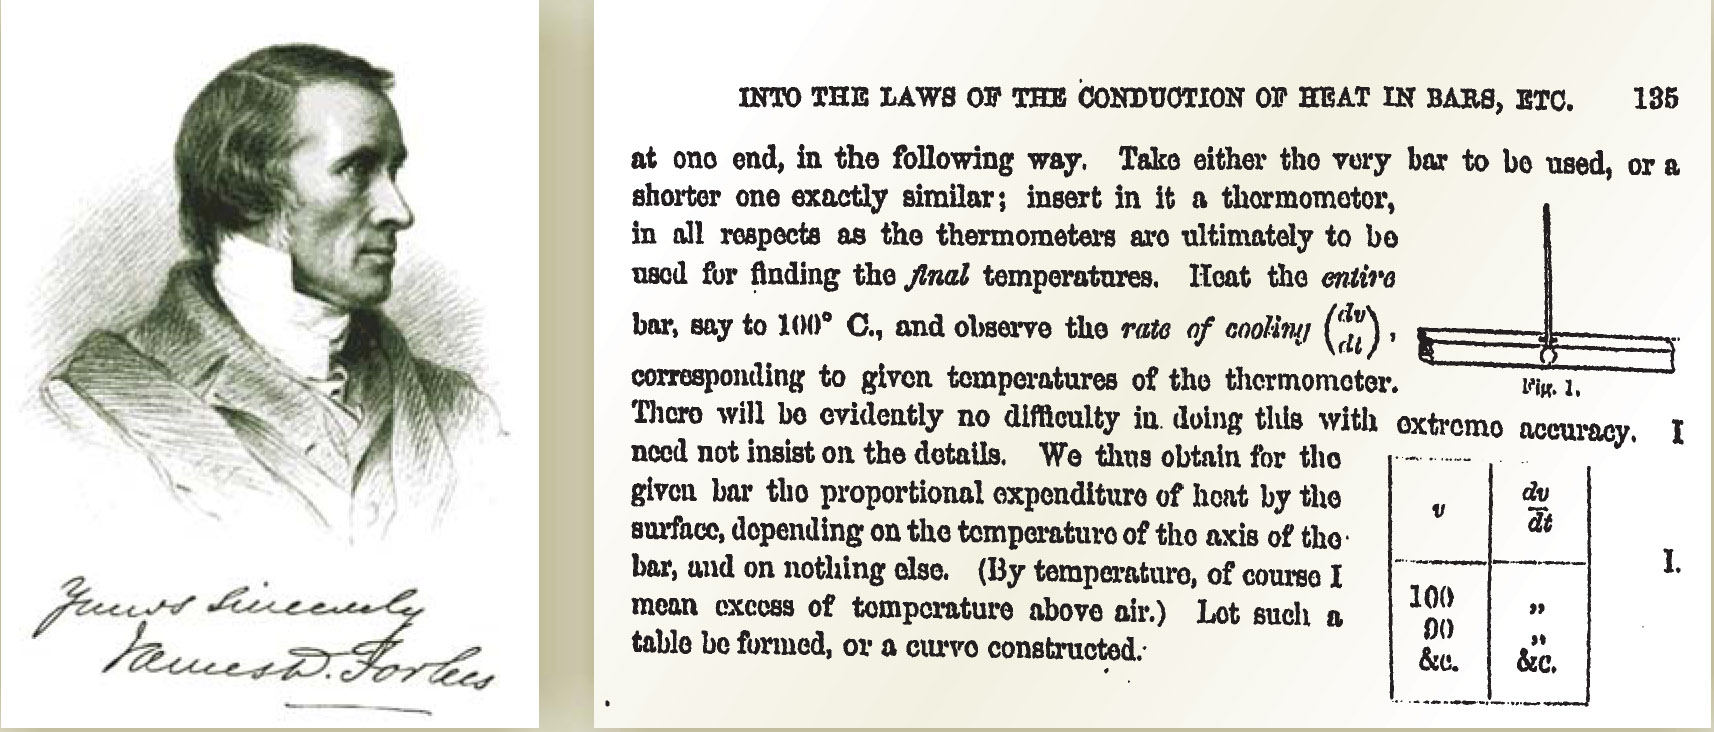
Forbes recognized that in the steady state, the quantity of heat -K(dT/dx) crossing the bar at x will be exactly equal to the quantity of heat lost to the atmosphere from the bar beyond x. Thus he could estimate K by extracting dT/dx from one of the curves and evaluating the heat lost to the atmosphere with the help of the dT/dt curve. That is, consider the vicinity Δx on the bar with temperature T and rate of temperature decline dT/dt, as read from the experimentally determined curve. The rate at which heat is lost to the atmosphere by that segment is (CDAΔx) dT/dt, where A is the cross-sectional area. Thus, if the bar beyond x is divided into I segments, the total rate of heat loss ΔH to the atmosphere is
and K =(ΔH)/(A · dT/dx).
Forbes’s data showed that thermal conductivity for wrought iron at 200 °C was only about 77% of its value at 100 °C; indeed, Forbes established for the first time that the absolute conductivity of wrought iron depended on temperature. His result, obtained with a down-to-earth approach based on the definition of K and the known value of specific heat, could not have been obtained with Fourier’s mathematical approach because the heat equation assumes that K is independent of T. Forbes stated that as far as he knew, no other method had succeeded in measuring absolute conductivity. Clearly, he was unaware of Fourier’s prize essay.
Lord Kelvin (born William Thomson; 1824-1907) used a result equivalent to equation
Directional dependence in crystals
Even during the 17th century, it was known that light traveled in crystals with different facility in different directions, as manifest in double refraction, or birefringence. That behavior appears to have motivated some mineralogists of the early 19th century to investigate if heat, too, would move through crystals with direction-dependent facility.
Henri Hureau de Sénarmont (1808-62), a mineralogist, conducted notable experiments along those lines. He took thin plates of various crystals, drilled a hole in the center of each, coated them with wax, and continuously applied heat through a wire or a tube inserted into the hole. He then observed the shape of the isothermal envelope radiating out from the center as evidenced by the melting wax. He found that for crystals belonging to the cubic system or for amorphous materials, the envelope was circular. But in other systems the envelope had an elliptic or oval shape whose exact form depended on the orientation of the plate relative to the crystallographic axes. For planes parallel to the c-axis in quartz, for example, the major axis of the ellipse was 1.31 times the minor axis. 15 Sénarmont’s results qualitatively established that thermal conductivity, just like refractive index, is directionally dependent, with characteristic directions related to crystallographic axes. That directional dependence later came to be called anisotropy.
George Gabriel Stokes (1819-1903) provided a mathematical theory to explain Sénarmont’s observations. 16 Treating the crystal as a continuum with different conductivities along three perpendicular directions, he derived expressions to calculate heat flux across an area whose orientation relative to crystallographic axes is known, given the temperature gradient normal to the surface. The matrix of thermal conductivity components resulting from his derivation satisfied certain invariance criteria and hence constituted a tensor.
Epilogue
An important contribution to 19th-century physics was the experimental discovery in 1840 by James Prescott Joule (1818-89) that when voltaic current flows in a conductor, the quantity of heat generated per unit time is proportional to the product of the resistance of the conductor and the square of the current. For the first time, Joule’s law provided a way of estimating the quantity of electrically generated flowing heat. Nevertheless, until the end of the 19th century, precise measurement of thermal conductivity was impeded by the necessity of indirectly estimating heat flow from surface emissivity and specific heat. Among the earliest to introduce electrical heaters as controlled sources for heat in thermal conductivity measurements was Charles Lees (1864-1952). 17
Thermal conductivity has played an important role in the history of physics. Fourier struggled for several years to give it a satisfactory conceptual and mathematical description as he was boldly breaking away from action at a distance and planetary mechanics to set in place a continuum paradigm. Thermal conductivity as defined by Fourier not only was a physical property of fundamental importance, it also served as a metaphor for electrical current flow, molecular diffusion, and the flow of fluids in resistive media. Yet, remarkably, flowing heat continues to be an enigma, eluding our ability to measure it directly.
I thank Karsten Pruess and Nic Spycher for help with German and French translation. I also greatly appreciate the library system of the University of California.
References
1. A. L. Lavoisier, P. S. Laplace, Memoir on Heat, Read to the Royal Academy of Sciences, 28 June 1783 …, H. Guerlac, trans., N. Watson Academic, New York (1982).
2. J. H. Lambert, Pyrometrie, oder Vom Maasse des Feuers und der Wärme, Haude and Spener, Berlin (1779).
3. J. Herivel, Joseph Fourier: The Man and the Physicist, Clarendon Press, Oxford, UK (1975).
4. J. Ingen-Housz, Nouvelles expériences et observations sur divers objets de physique, Théophile Barrois le jeune, Paris (1785), pp. 380–390.
5. B. Rumford, Collected Works of Count Rumford, vol. 1, S. Brown, ed., Harvard U. Press, Cambridge, MA (1968), pp. 49–116.
6. I. Grattan-Guinness, J. R. Ravetz, Joseph Fourier, 1768–1830: A Survey of His Life and Work …, MIT Press, Cambridge, MA (1972).
7. J. Fourier, The Analytical Theory of Heat, A. Freeman, trans., Cambridge U. Press, Cambridge, UK (1878);
reprinted by Cambridge U. Press, New York (2009);
originally published as J. B. J. Fourier, Théorie analytique de la chaleur, F. Didot, Paris (1822).8. J. B. Biot, Bibl. Britannique 27, 310 (1804).
9. J. B.J. Fourier, Théorie de la propagation de la chaleur dans les solides, submitted to the Institut de France, 21 December 1807. The manuscript is archived at the library of the École Nationale des Ponts et Chaussées, Paris.
10. J. B. J. Fourier, Mem. Acad. R. Sci. Inst. France, années 1821 et 1822 5, 153 (1826);
reprinted in J. B. J. Fourier, Œuvres de Fourier …, vol. 2, Gauthier-Villare, Paris (1890) p. 111. C. -M. Despretz, Ann. Chim. Phys., 2nd ser., 19, 97 (1821).
See also G. Wiedemann, R. Franz, Ann. Phys. Chem. 89, 497 (1853).12. J. C. E. Péclet, Ann. Chim. Phys., 3rd ser., 2, 107 (1841).
13. J. D. Forbes, Trans. R. Soc. Edinburgh 23, 133 (1864).
14. W. Thomson, Trans. R. Soc. Edinburgh 22, 405 (1861).
See also A. J. Ångstrom, Philos. Mag., 4th ser., 25, 130 (1863).15. H. H. de Sénarmont, Ann. Chim. Phys., 3rd ser., 21, 457 (1847).
16. G. G. Stokes, Cambridge Dublin Math. J. 6, 215 (1851).
See also J.-M.-C. Duhamel, J. Ec. Polytech. (Paris) 19, 155 (1848).17. C. H. Lees, Philos. Trans. R. Soc. London Ser. A 191, 399 (1898).
More about the authors
T. N. Narasimhan (tnnarasimhan@lbl.gov ) is an emeritus professor in the department of materials science and engineering and the department of environmental science, policy, and management at the University of California, Berkeley.
T. N. Narasimhan, (tnnarasimhan@lbl.gov) University of California, Berkeley, US .


