The unfolding and control of network cascades
DOI: 10.1063/PT.3.3426


It would be just a small exaggeration to say that we have reached the “network age.” A growing number of diverse systems are being represented as networks—collections of nodes that interact through links or connections. Think of engineered materials, intracellular media, organismal physiology, ecological systems, and swarming robots. Moreover, networks—be they financial, transportation, power-transmission, information-exchange, or social-interaction—are increasingly coming into existence as a result of human activity. (See the article by Adilson Motter and Réka Albert, Physics Today, April 2012, page 43 .)
A defining characteristic of networks is their ability to propagate influence; they allow the state or behavior of one node to influence the state or behavior of others. Influence may spread across networks by way of ordinary contact processes such as epidemic spreading or diffusion. But influence may also spread through a fundamentally different process: a cascade.
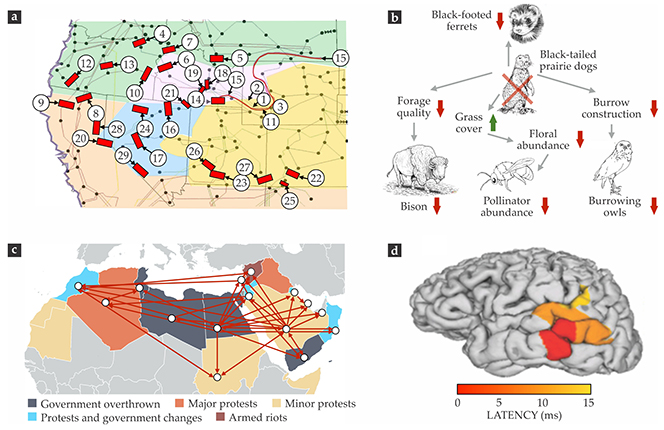
Cascades are self-amplifying processes by which a relatively small event may precipitate a change across a substantial part of a system. Often, cascades are to be avoided: They may cause blackouts in power grids, congestion in traffic systems, widespread defaults in financial networks, and mass extinctions in ecosystems. In some scenarios, however, cascades are essential to a network’s functionality: Biochemical cascades underlie intra- and intercellular signaling networks, plea-bargain cascades have become integral to the criminal justice system, and social cascades facilitate the spread of technology adoption and cooperation. Cascading processes have been exploited to maximize the effects of get-out-the-vote and other behavior-change campaigns, content sharing in social media, and viral marketing. (See figure 1 for representative examples of network cascades.)

Figure 1. Examples of cascades. (a) On 2 July 1996, a cascade of power line failures (red bars) left the western North American grid fragmented into five islands (colored areas) and more than 2 million customers without power. Here, the numbers indicate the chronological order of the cascading events, including the triggering and remedial failures. (Adapted from North American Electric Reliability Council, 1996 System Disturbances: Review of Selected 1996 Electric System Disturbances in North America, August 2002.) (b) The loss of the black-tailed prairie dog in the central US upset the habitat in a way that triggered a decline (red arrows) in several animal species. (Adapted from B. J. Bergstrom et al., Conserv. Lett. 7, 131, 2014.) (c) Cross-national social influences—estimated based on Facebook friendship connections—triggered a social cascade that fueled the 2010–12 Arab Spring protests. (Adapted from ref.
Modeling cascades in large and complex networks, however, is a nontrivial task; predicting, preventing, or promoting them even more so. Ideally, one would like to be able to do all those things; control over cascades could, in theory, lead to self-healing networks, new therapeutic treatments, prevention of widespread financial crises, and more robust power grids. Although the path to cascade control is beset by stumbling blocks, a broad, interdisciplinary effort to surmount them is already afoot. Here we describe some of the recent progress and outstanding problems.
What’s so special?
To understand the intrinsic differences between cascades and other network spreading processes, it’s helpful to compare the cascading of outages in a power grid with the epidemic spread of flu in an unimmunized population of like individuals.
In a cascade, nodes are affected by their neighbors in nonadditive fashion. In a power grid, for instance, a station’s response to an outage at a neighboring station depends not only on the failed neighbor but on the states of the other neighbors. So whereas a susceptible individual always has a nonzero probability of contracting the flu from a contagious contact, the probability of a power station adopting a neighbor’s failed state may be zero, if no other neighbors have failed.
Because of nonadditivity, the spread of a new behavior or state often requires reinforcement, such that a given node must see multiple neighbors change before it, too, changes. Networks with local redundancies and other structures allowing reinforcements can therefore be more susceptible to cascades. 1 By contrast, epidemics propagate more efficiently in networks with long-range connections, such as random ones. The interplay between network structure and nonadditivity can be critical to network spreading phenomena.
Consider, for instance, that in 1970 gonorrhea led the list of infectious diseases in the US despite evidence that infected individuals transmitted the disease to less than one partner, on average. The proposed explanation was that a core subpopulation of only 2% of the susceptible individuals was responsible for 60% of all infections. 2 Had the disease spread via cascade-like dynamics, the need for reinforcement would have effectively limited the infection to the core and no one else.
A second distinguishing feature of cascades is that they may propagate nonlocally; one node’s change in state may alter the states of other nodes without changing the states of nodes in between. 3 A power station may fail even if none of its immediate neighbors have, whereas in a flu epidemic, the virus can reach an individual only through a neighbor who is contaminated (assuming the network is the only medium for transmission). Nonlocality is expected to be most pronounced in networks with little clustering and large average path length, such as power grids. (The path length between two nodes is the number of connections along the shortest path between them.)
A third key feature of cascades is disproportional impact: The failure of some components may have a much larger effect than the failure of others. In particular, a node’s effect may depend not only on how it is connected to the network but also on its intrinsic properties. By contrast, everything else being the same, the probability of transmitting the flu tends to vary little from person to person. Like nonadditivity and nonlocality, disproportional impact has important ramifications for the modeling, detection, and control of cascading dynamics.
Modeling cascades
To detect and control cascades, one must first develop a suitable mathematical representation of them. That task turns out to be easier said than done. Although the self-amplifying nature of cascades is relatively straightforward to model, nonadditivity, nonlocality, and disproportional impact are not. Accordingly, the compromise between being simple enough to be amenable to analysis and being comprehensive enough to represent reality is hard to come by for models of cascading dynamics. Significant progress has been made, nevertheless, by tailoring models to the research question at hand.
Models may be detailed, simplified, or abstract. To use the power grid as an example, 4 a detailed model would employ the most realistic, causal representation of the system. A simplified model would involve conscientious approximations, such as the DC approximation for power flows. An abstract model might not directly account for the physics of power flows but focus instead on implications.
First we review examples from one important class of cascade models: those that capture the dynamics of cascades without necessarily being derived from the dynamics of the actual network.
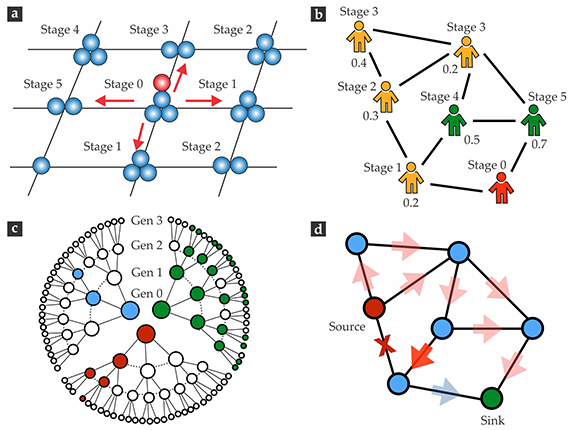
► Avalanche models. Inspired by the Bak-Tang-Wiesenfeld sandpile model, avalanche models treat each node much like a pile of grains, as illustrated in figure 2a. One by one, grains are randomly added to the piles, until one pile exceeds a threshold height and topples. That pile’s grains are redistributed to neighboring piles, possibly setting off a cascade in which multiple nodes topple.

Figure 2. Cascade models. (a) In an avalanche model, grains of sand are randomly added to a network’s nodes until one node reaches a threshold, at which point it topples and its grains are redistributed to its neighbors. Here the threshold is four, and the central node is set to topple. That triggering event causes other nodes to topple during later stages of the cascade, as indicated. (b) In the threshold model, an agent changes state only when an assigned threshold fraction of its neighbors has changed state. Here the assigned thresholds are shown next to each node, and the stages indicate the order in which the various nodes change states. (c) In branching-process models, a failure has some probability of spreading from a parent to its offspring. Shown here are cases where the number of new failures in each generation (gen) is smaller than (blue), equal to (red), and larger than (green) the critical number for cascade growth. (Adapted from T. P. Vogels, K. Rajan, L. F. Abbott, Annu. Rev. Neurosci. 28, 357, 2005.) (d) In a flow-redistribution model, the inactivation of one connection, indicated with an “x,” increases (red) or decreases (blue) the flow through other connections. The flow increases may cause additional failures and flow redistributions.
Avalanche models account for nonadditivity, and if the toppling thresholds are heterogeneous across the network, they can capture disproportional impact. But like most models in which nodes communicate their state changes only with their immediate neighbors, it does not allow for nonlocality. 5 , 6
► Percolation-related models. These are models that can be formulated as a percolation problem. Because the end question is usually whether the set of affected nodes forms a large-scale, connected cluster in the network, the models themselves are ultimately purely structural.
One example, illustrated in figure 2b, is the threshold model developed by Mark Granovetter. 7 In that model, a node changes state when some threshold fraction of its neighbors has changed. The threshold model is often used to study how behavioral changes spread in social systems. Solutions of this model for randomly connected networks 8 show, for example, that increasing the heterogeneity of the distribution of connections per node makes a system less susceptible to large-scale cascades. By contrast, increasing the heterogeneity of the thresholds makes the system more susceptible. Although percolation-related models do not account for disproportional impact or nonlocality, they do capture nonadditivity.
► Statistical models. Some models eschew details of a network’s dynamics and structure and instead use simulated or historical data to describe the expected number of affected nodes in each generation of a time-discretized cascade. Prime examples are branching-process models, 9 illustrated in figure 2c. In their simplest form, branching-process models are characterized by a parameter λ, which represents the average number of offspring failures for each parent failure in the preceding generation. Because statistical models specify neither the causal relations between parent and offspring failures nor the identity of the elements involved in the cascade, they do not take a stand on any of the properties unique to cascades.
► Flow-redistribution models. Traffic networks, power grids, metabolic systems, and many other real networks exhibiting cascades are flow networks. In models of flow networks, the failure of a node or connection results in its flow being redistributed to other nodes and connections in the network, as illustrated in figure 2d. Other components may then reach capacity and fail—completely or partially, depending on whether the capacity is a hard or soft constraint. The response may be immediate, or it may have a time delay. In any case, the original failure may lead to a cascade of further flow redistributions and failures.
One simple flow-redistribution model, the overload model, assumes that the flow between any two nodes is transmitted along the shortest path connecting them. 10 Despite its simplicity, the model captures all three salient properties of cascades: nonadditivity, nonlocality, and disproportional impact. It also reproduces the tendency of networks to be robust to perturbations of low-flow components but fragile to perturbations of high-flow components.
Deriving cascade dynamics
Some mathematical models of cascades are derived directly from representations of a network’s dynamics and reproduce cascades as special manifestations of this dynamics without the need for ad hoc assumptions. Among them are dynamical-systems models derived from the dynamical equations describing the state of the network, and typically expressed in the form of a large set of coupled ordinary differential equations. In a food-web network, those equations could be the consumer-resource equations; in a network of power-grid generators, they could be the swing equations that follow from Newton’s second law.
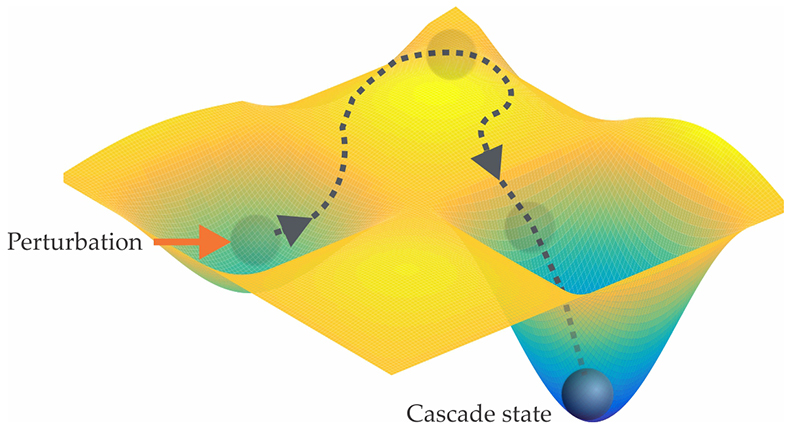
These equations describe systems that are nonlinear, dissipative, and multistable, with some of their stable states, or attractors, representing desired states and others representing undesired states. A cascade is then interpreted as the process illustrated in figure 3. Here, a perturbation drives the system from the attraction basin of a desired state to the basin of an undesired state, to which the system then evolves. 11 Incidentally, such a continuous description shows that it is a simplification to think of a cascading failure as a process in which one failure leads to another. Instead, the continuous change in the full state of all variables is what drags the system along a path of successive failures.

Figure 3. In a dynamical-systems model, a cascade is initiated when a perturbation (red arrow) drives a network away from its normal-state attractor and into the basin of an attractor representing a cascade state. Therefore, in this representation a cascade is not a process in which one discrete event leads to another but rather a continuous change in the full state of all variables.
One benefit of dynamical-systems models is that in addition to immediately accounting for all defining properties of the cascading dynamics, they allow the study of numerous implications. For example, in ecological-extinction cascades subject to a sequence of perturbations, the outcome hinges strongly on the perturbations’ order and timing. Depending on the perturbation scheduling, a cascade triggered by the suppression of one species often can be enhanced, inhibited, or completely mitigated by the deliberate suppression of other species. 12
Another approach to capturing realistic dynamics is agent-based modeling, in which nodes are represented as agents that respond to neighboring agents according to predefined rules. Such models are simulated at the individual rather than the aggregate level and allow fairly realistic representations of systems that are too complex to represent with closed-form equations. 13 They can be used to study cascading processes in various contexts, ranging from power engineering and molecular biology to economics.
Early detection and prediction
To mount an effective response to a cascade event, one must either predict it before it starts or detect it soon thereafter. One may be interested in a binary answer (whether or not a cascade is likely), a continuous answer (the probability of a cascade as a function of cascade size), or a full description of the cascade trajectory, including the identities of the affected network components.
In principle, determining when a network component changes state is straightforward, but predicting the system-wide impact of such a change is difficult. A cascade can be predicted if the network’s state and governing dynamics are known and the system can be accurately simulated. To that end, properly validated models, such as TRELSS, the Transmission Reliability Evaluation of Large-Scale Systems for power-network reliability, 4 can be simulated in tandem with the observation of the real system to predict a possible cascade given a detected perturbation. Because cascades involve a complex sequence of dependent changes, however, simulations are often sensitive to model details and uncertainties in the estimation of state variables—much as predictions of the behavior of a double-pendulum can vary wildly as a result of small uncertainties. (See Adilson Motter and David Campbell, Physics Today, May 2013, page 27 .)
Another possible strategy for cascade prediction is to use data from previous events under similar conditions to statistically infer outcomes. A first step is to analyze data to identify features that are strongly correlated with certain cascade outcomes. For example, on Facebook, Twitter, and Twitter’s Chinese-language counterpart, Weibo, the activity of key users and the temporal and structural properties of early sharing events are strong predictors of the outbreak of large information-sharing cascades. 14 Logistic regression, neural networks, support vector machines, and other machine learning techniques that systematically account for multiple correlations are often used to identify features and predict outcomes. A difficulty, however, is that large cascades—precisely those most important to predict—are rare events for which statistical data tend to be inherently limited. A crucial factor in the real-time detection of cascades is the time required to collect and process data about the network, which has to be smaller than the time scale for the propagation of the cascade.
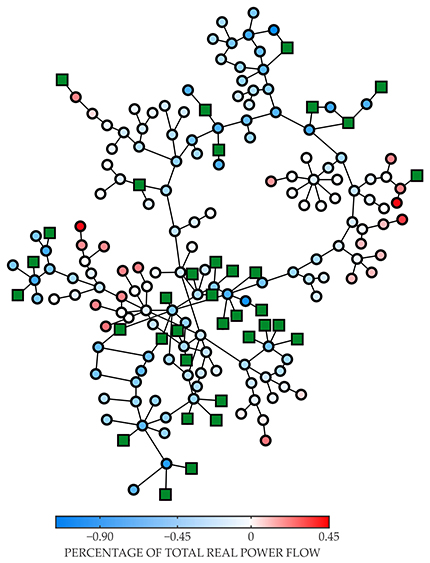
It is often conceptually instructive to model simulated rather than empirical data in order to develop an intuition for which features give rise to cascades. For example, for the overload model, simulations predict that cascading failures are more likely to be triggered by highly central nodes through which many different network paths are channeled. 10 Sensitivity analysis can be useful for investigating real-world variants of such predictions, as in the Icelandic power network shown in figure 4.

Figure 4. In this map of the Icelandic power grid, the color of each load node (circles) indicates the percentage change in the aggregated power flow over all power lines when that node’s demand increases by 1%, relative to the total power generated in the network. (Squares represent power generators.) To keep supply and demand in balance, power demand is decreased uniformly across all other load nodes. Sensitivity maps such as this one may be able to help identify critical components affecting cascade dynamics.
In the study of models, a more complete characterization of the conditions leading to a cascade is also possible in many cases. In the threshold model on random networks, 8 for example, a single node can trigger a large-scale cascade only if the node is connected to a percolating cluster of early adopters, which activate whenever any one of their neighbors activates. If the network is sparsely connected, the cascade will also include a large-scale portion of non-early adopters.
Cascade control
A primary ambition in the study of cascades is to be able to control them—to put in motion a desirable cascade or stop a detrimental one. It’s convenient to think about control in terms of the manipulation of risk, where risk is the probability that a cascade will occur times the cost incurred if it does. This concept can be useful in scenarios where, say, suppressing small, frequent cascades inadvertently increases the frequency of large, rare ones. The counterpart to risk applicable to desirable cascades is expected utility—the probability of a cascade times its potential payoff. Cost and utility functions can be expressed more generally as probability times size, for a properly defined notion of cascade size. The extent to which one can control a cascade depends in part on whether the goal is to inhibit it or promote it, on whether the system is engineered or natural, and on how effectively the individual network elements can be actuated.
In social systems, a conceptual starting point for launching a successful cascade is the influentials hypothesis—the notion that some individuals are significantly more effective in exerting social influence than others. 15 The underlying idea is that even though influentials may have a higher threshold for joining the cascade, once they do join they are more likely to cause others to join. That makes them ideal targets for early adoption. The concept is similar in spirit to disproportional impact, where influence may depend as much on network position as on reputation and other aspects of intrinsic fitness.
A competing hypothesis is that there are no influentials and that the ability to trigger cascades depends mainly on the overall structure of the network, including patterns of connections between early adopters. 15 Some studies focused on maximizing the spread of influence suggest the existence of influentials, 16 but the extent to which those influentials wield influence remains a topic of research. Though it may go without saying, another control parameter in social-network cascades is the appeal of the information, technology, or behavior that’s being shared.
In engineered networks, the most direct ways to prevent cascading failure are to make the system’s components and structure resilient and to incorporate system controls that proactively reduce risk as conditions change. (See the article by Scott Backhaus and Michael Chertkov, Physics Today, May 2013, page 42 .) In practice, however, no engineering effort can eliminate the possibility of occasional failures and hence of cascading failures in a large, complex network. Redesigning the system isn’t always an option—especially in resource-limited networks. There is therefore interest in what could be perceived as the most ambitious form of cascade control: reining in unforeseen or unavoidable cascades after they have been triggered.
Consider a power-grid disturbance that upsets the balance between demand and capacity at certain stations and lines. To rebalance the system in real time and prevent the propagation of the disturbance, the control actions might include rerouting power flows, shutting off power to parts of the grid, and dispatching power generation at other parts. (Myriad factors, including time scales for failure and response, other instabilities in the grid, the cost of power generation, and the prioritization of certain users such as hospitals, will influence those control decisions.)
There are basically two types of approaches to minimizing power loss and hence the possibility of a large cascade. Centralized algorithms, which require state information for the entire system, can, in principle, deliver a globally optimal solution. Decentralized algorithms, which rely on local state information, can generate locally optimal solutions that are computationally less expensive. The scale of the system largely determines which approach is most appropriate. Smart-grid technologies, such as real-time pricing and large-scale use of smart appliances, will introduce new ways to control not only supply and delivery but also demand and may prove crucial to increasing the market penetration of renewable energy from wind, solar, and other intermittent sources.
Dynamical-systems models form a particularly insightful context in which to study the post-triggering control of cascades. In those models, the triggering of the cascade is associated with the event that brings the system outside the attraction basin of the desired attractor. The goal is to steer the trajectory back into the desired basin of attraction.
That adjustment can be done by perturbing either the system’s variables to bring the state to the desired basin or its parameters to bring the desired basin to the state. (See figure 5.) The game of billiards provides an analogy: Perturbing the system variables is akin to pocketing the balls by striking them with a cue; perturbing the parameters is like tilting the table itself. The challenge is that constraints on feasible interventions limit the accessible portions of the state and parameter spaces. And the determination of the global structure of the basin boundaries, which would be required in simple control approaches, is computationally impossible in large, high-dimensional networks.

Figure 5. Cascade control. A system on the verge of cascading—that is, one that’s been nudged into the basin of an undesired attractor—can be nudged back toward a target attractor by perturbing either (a) the state (red dot) to move the system toward the target basin or (b) parameters to shift the boundary between the desired and undesired basins of attraction (dashed line). Lighter colors represent deeper points in the attraction basins, and contours are lines of equal depth. (Adapted from refs.
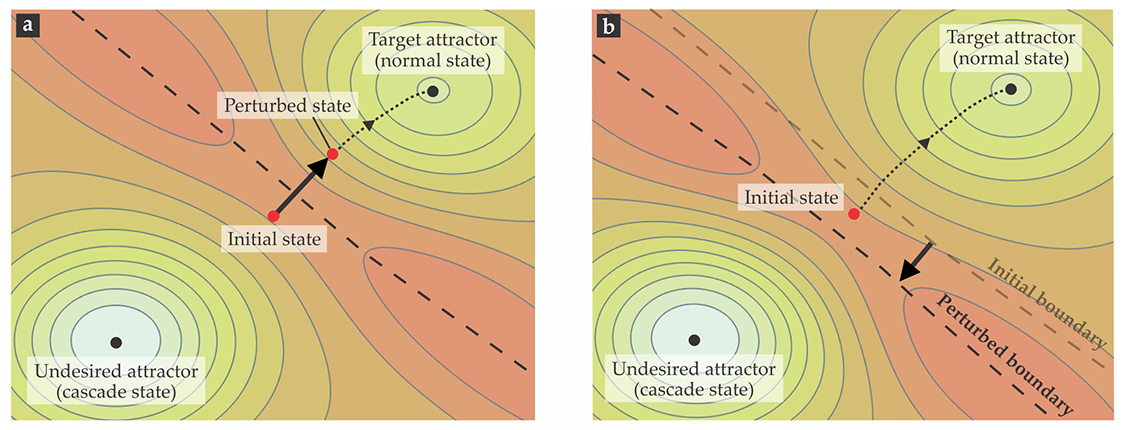
Two recently developed approaches have overcome those challenges. One locates the basin of the target attractor without any a priori information about its location. 11 The other manipulates the height of the basin boundary along the least action path to the desired attractor to induce a bifurcation that eliminates the undesired attractor without changing the stability of other states in the system. 17 Within the dynamical-systems framework, one can, in principle, go beyond suppressing or enhancing cascades and instead control the entire cascade trajectory.
A world of possibilities
Essentially every problem discussed here is still a work in progress. Ongoing research includes efforts to discover new mechanisms underlying cascades, find relations between network structure and cascade dynamics, identify tradeoffs between resilience to frequent cascades and resilience to large ones, establish effective control schemes in the presence of uncertainty, characterize the trajectories of different cascades, identify common features across different systems, experimentally validate hypotheses, and develop new applications that leverage beneficial cascades. Other topics of pressing interest include postcascade dynamics and the nontrivial matter of restoring systems after a cascading failure.
The above applies not only to systems modeled as a single network with a single type of node and a single type of interaction, but also to many networks composed of multiple types of nodes and interactions. In social networks, for instance, individuals may be distinguished by gender, age, profession, and other characteristics; their interactions may be physical or virtual, personal or professional.
To give another example, a city can be regarded as a network that includes infrastructural, social, economic, and biophysical layers that interact with one another. Although such a system can be represented as a single network, it is sometimes convenient to separate the different layers and regard the system as a network of interacting networks. (Such networks are also referred to as multilayer and multirelational networks, among other terms.) Interacting networks raise additional questions about cascades, including whether networks are more susceptible to cascades when coupled to other networks than they would be when assumed to operate in isolation.
Take the example of two networks of N nodes each. Coupling between the two raises the possibility that a cascade initiated in one network will propagate to the other, such that the cascade grows larger than it would in either one of the networks alone. That does not mean, of course, that the cascade will be any larger than it would be in a single network of 2N nodes. The coupling between networks may also reduce the risk of cascades, as suggested by model systems consisting of similar subnetworks coupled to one another. 6 The same is expected in scenarios where one network stabilizes the other, as is the case for regulatory and control networks.
Interdependent networks, a special class of interacting networks, are another instructive example. In the simplest of such networks, each node must be connected to a working node from a different network in order to function. Interdependence may make cascades and percolation transitions either more or less abrupt depending on the details of the model and network structure. 18 The effect of interactions between networks is far from obvious, likely system specific, and yet to be fully understood.
Cascades are unique in that they can produce global effects in the absence of global actions: A network is disrupted not by a disturbance itself but by the chain of events a disturbance puts in motion. As has been the case with the study of other spreading phenomena, research on cascades has traditionally focused more on their analysis than on their prediction and detection. Yet recent advances in early detection combined with ongoing advances in cascade control are now creating the possibility of real-time manipulation of cascades even after they’re triggered. We believe that pressing problems in disciplines as diverse as materials science, biomedicine, finance, and social science will directly benefit from future advances in the rapidly developing multidisciplinary field of network cascades.

BARRETT LYON/THE OPTE PROJECT
The authors acknowledge support from NSF.
References
1. D. Centola, Science 329, 1194 (2010). https://doi.org/10.1126/science.1185231
2. H. W. Hethcote, J. A. Yorke, Gonorrhea Transmission Dynamics and Control, Springer (1984), p. 32.
3. D. Witthaut, M. Timme, Phys. Rev. E 92, 032809 (2015); https://doi.org/10.1103/PhysRevE.92.032809
C. D. Brummitt, G. Barnett, R. M. D’Souza, J. R. Soc. Interface 12, 20150712 (2015). https://doi.org/10.1098/rsif.2015.07124. D. Watts, H. Ren, in 2008 IEEE International Conference on Sustainable Energy Technologies, IEEE (2008), p. 1200.
5. K.-I. Goh et al., Phys. Rev. Lett. 91, 148701 (2003). https://doi.org/10.1103/PhysRevLett.91.148701
6. C. D. Brummitt, R. M. D’Souza, E. A. Leicht, Proc. Natl. Acad. Sci. USA 109, E680 (2012). https://doi.org/10.1073/pnas.1110586109
7. M. Granovetter, Am. J. Sociol. 83, 1420 (1978). https://doi.org/10.1086/226707
8. D. J. Watts, Proc. Natl. Acad. Sci. USA 99, 5766 (2002). https://doi.org/10.1073/pnas.082090499
9. I. Dobson, IEEE Trans. Power Syst. 27, 2146 (2012). https://doi.org/10.1109/TPWRS.2012.2190112
10. A. E. Motter, Y.-C. Lai, Phys. Rev. E 66, 065102 (2002); https://doi.org/10.1103/PhysRevE.66.065102
A. E. Motter, Phys. Rev. Lett. 93, 098701 (2004). https://doi.org/10.1103/PhysRevLett.93.09870111. S. P. Cornelius, W. L. Kath, A. E. Motter, Nat. Commun. 4, 1942 (2013). https://doi.org/10.1038/ncomms2939
12. S. Sahasrabudhe, A. E. Motter, Nat. Commun. 2, 170 (2011). https://doi.org/10.1038/ncomms1163
13. W. Rand et al., J. Artif. Soc. Soc. Simul. 18(2), 1 (2015).https://doi.org/10.18564/jasss.2616
14. P. Cui et al., in KDD2013: The 19th ACM SIGKDD International Conference on Knowledge Discovery and Data Mining, I. S. Dhillon et al., eds., Association for Computing Machinery (2013), p. 901;
J. Cheng et al., in WWW ’14: Proceedings of the 23rd International Conference on World Wide Web, Association for Computing Machinery (2014), p. 925.15. D. J. Watts, P. S. Dodds, J. Consum. Res. 34, 441 (2007). https://doi.org/10.1086/518527
16. D. Kempe, J. Kleinberg, E. Tardos, KDD-2003: Proceedings of the Ninth ACM SIGKDD International Conference on Knowledge Discovery and Data Mining, Association for Computing Machinery (2003), p. 137;
F. Morone, H. A. Makse, Nature 524, 65 (2015). https://doi.org/10.1038/nature1460417. D. K. Wells, W. L. Kath, A. E. Motter, Phys. Rev. X 5, 031036 (2015). https://doi.org/10.1103/PhysRevX.5.031036
18. S. V. Buldyrev et al., Nature 464, 1025 (2010); https://doi.org/10.1038/nature08932
S.-W. Son, P. Grassberger, M. Paczuski, Phys. Rev. Lett. 107, 195702 (2011). https://doi.org/10.1103/PhysRevLett.107.195702
More about the authors
Adilson Motter is the Charles E. and Emma H. Morrison Professor of Physics and Astronomy and Yang Yang is a postdoctoral researcher in the department of chemical and biological engineering, both at Northwestern University in Evanston, Illinois.


