The dynamics and changes of the world’s monsoons
DOI: 10.1063/PT.3.5308


If you have ever lived in Kolkata, India; Niamey, Niger; Darwin, Australia; or Tucson, Arizona, you have experienced a monsoonal climate. A long dry season during the cold months of the year transitions to a spring season with scorching temperatures and the occasional explosive thunderstorm as the wind brings more and more humidity from the sea and, eventually, summer rain.
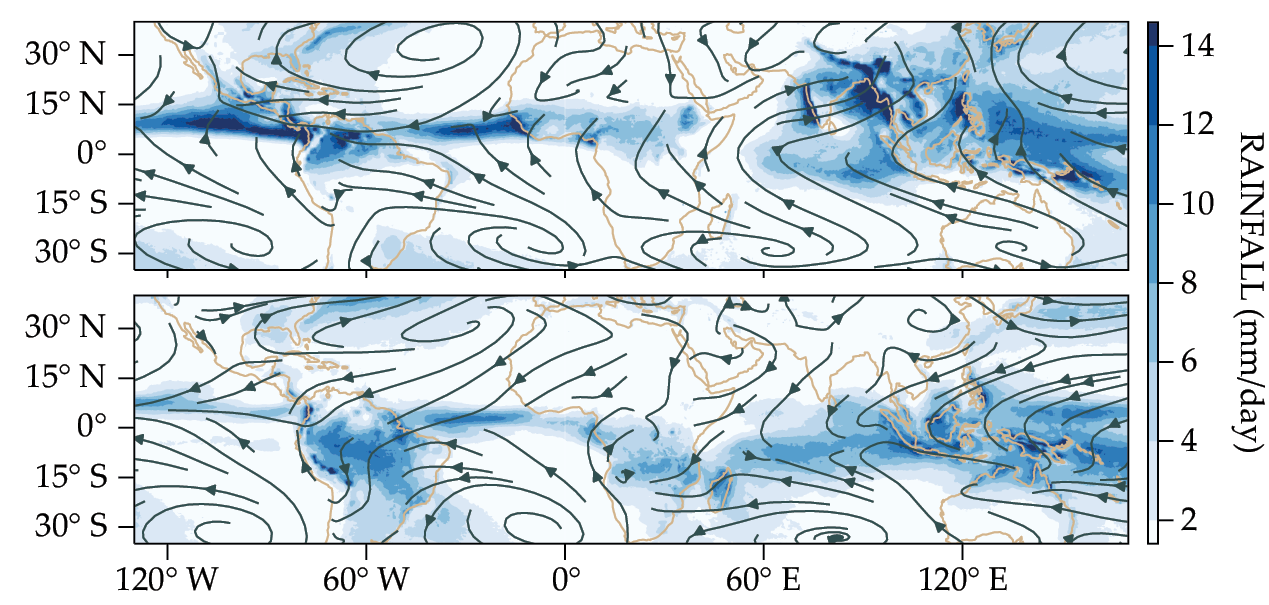
Many monsoonal regions experience a seasonal reversal of the prevailing winds, from offshore during the dry season to onshore during the rainy season. But the most salient feature is the rainfall—a monsoon climate sees most of its annual rainfall concentrated during the summer, as shown in the seasonal comparison in figure
Figure 1.

Monsoon season is characterized by tropical rainfall (blue shading) and converging, near-surface wind patterns that occur in the Northern Hemisphere from June through September (top) and in the Southern Hemisphere from December through March (bottom).
Monsoons have been central to the identity and art of many world cultures. Their winds power sailing vessels, and their rains fulfill the water needs of billions of people in the tropics and subtropics. Monsoons have also been central to the development of climate science.
In 1686 Edmond Halley published for the Royal Society of London what scientists now think of as the first attempt to explain the atmosphere’s general circulation. 1 The theory was not quite exact—Isaac Newton’s Philosophiae naturalis principia mathematica (Mathematical Principles of Natural Philosophy), with its description of the laws of motion, wasn’t published until the following year—but Halley got some fundamentals correct: The monsoons are not some local sea breeze but part and parcel of a planetary wind system. Somehow, that basic truth has been forgotten and remembered many times. 2
In a lecture delivered on 16 March 1921 to the Royal Meteorological Society, George Simpson, then the director of the UK’s Meteorological Office, remarked:
I believe that very few educated people would have any difficulty in giving an answer to the question—What is the cause of the monsoon? They would refer to the high temperature over the land compared with that over the surrounding sea, and would speak of ascending currents of air causing an indraft of sea-air towards and into the interior of the country. It is only when one points out that India is much hotter in May, before the monsoon sets in, than in July, when it is at its height, or draws attention to the fact that the hottest part of India—the north-west—gets no rain during the monsoon, or even shows by statistics that the average temperature is much greater in the years of bad rains than in years of good rains, that they begin to doubt whether they do know the real cause of the monsoon.
3
To find out the real cause of the monsoon, forget about India (or any particular locale) for now and go back to Halley’s visionary perspective of a planetary-scale circulation. To make things even simpler, let’s assume that Earth is a sphere that has a homogeneous surface with a gaseous atmosphere and is rotating in space, tilted on its axis, and illuminated by the Sun.
As the Northern Hemisphere tilts toward the Sun after the spring equinox, the peak of incoming solar radiation moves to the northern subtropics. Some heat is absorbed at the surface, and some is radiated back to space at the top of the atmosphere, whose cooling rate is set by the temperature of the Earth–atmosphere system, according to the blackbody approximation. The loss of heat to space, however, fails to balance the energy received from the Sun, so the atmospheric and oceanic circulations have to export the excess energy.

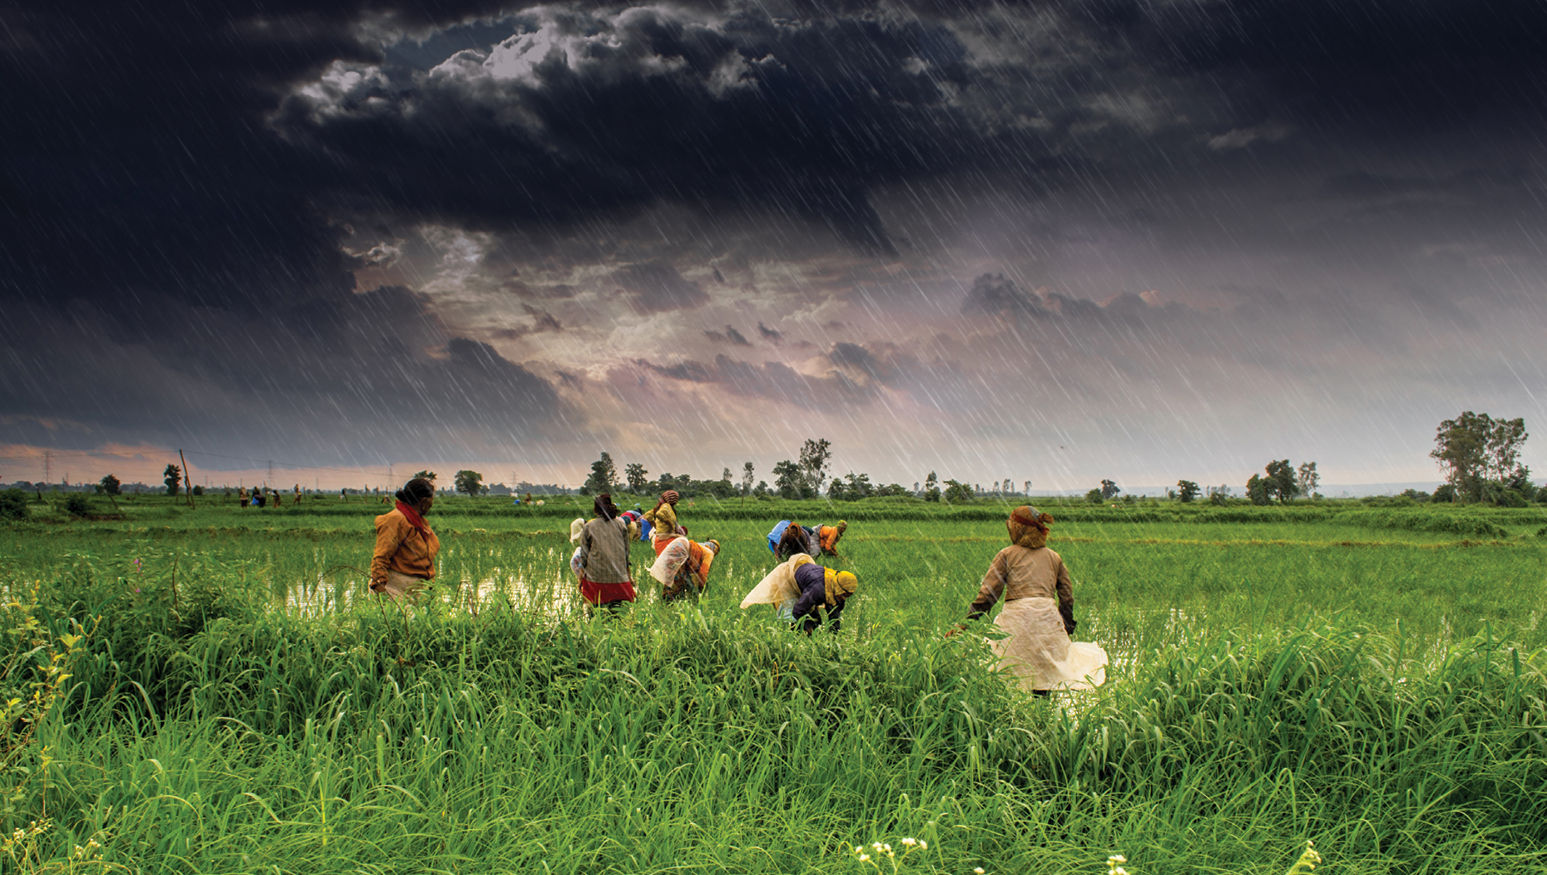
RAJARSHI MITRA/CC BY 2.0 /FLICKR
High in the atmosphere, the air is cold and dry, but it has high potential energy. Hence, at upper levels, that air can transfer the necessary energy out of the northern tropics and into the southern tropics. Conservation of mass requires that the upper-level air be replaced, which results in a circulation loop being formed. At low levels, air travels from the Southern Hemisphere, picking up moisture from the surface along its path. When that air rises in the Northern Hemisphere, it cools by expansion, and its water vapor condenses into clouds. Deep cumulonimbus towers extend about 10 km into the atmosphere, and heavy rainfall ensues.
So far, we have described a meridional circulation, which goes north and south in response to heat differences. But Earth is a rotating sphere, and it needs to conserve angular momentum. As air changes latitude, it changes its distance from Earth’s rotating axis. Away from the surface, frictional torques are unimportant, and a parcel of air will do one of two things. It could maintain its angular momentum by acquiring eastward velocity when it moves closer to the rotation axis or westward velocity when it moves farther away. Or it could change its angular momentum in response to the effective torque of macroturbulent eddies that are formed in the sharp temperature gradients of the midlatitudes.
During the equinox seasons, the eddies penetrate into tropical latitudes and transport momentum away, slowing the circulation. 4 During the solstice seasons, the eddies in the summer hemisphere are weak, and those in the winter hemisphere don’t reach the tropics. Therefore, the cross-equatorial circulation approximately conserves angular momentum and remains strong. The transition between the equinox’s dynamical regime and that of the solstice season happens abruptly in late spring or early summer. 5 On the ground, it is heralded as the onset of the monsoon.
To explain Simpson’s counterintuitive observation—that the hottest time of the year is not the most conducive to convective updrafts—we need to consider the phase changes of water. The water cycle is an energy cycle. When the cross-equatorial surface flow evaporates water from the ocean, the ocean cools and the energy is carried in latent form in the vapor. When water vapor condenses in clouds, the latent heat is released, which further fuels the atmospheric circulation that lifted the air in the first place. (A dry atmosphere could produce a circulation similar to what’s described, but it would be much weaker.) Instead, the monsoon is strongest when and where the surface air contains the largest amount of combined heat and moisture. Known as moist energy, its distribution helps explain the localization of the planetary monsoon into each unique regional monsoon. 5
Regional monsoons
Together, the uneven distribution of solar insolation, the conservation or dissipation of angular momentum, and the phase changes of water regulate the position and the strength of the planetary circulation in the tropics. But none of them explain why the African monsoon barely makes it to 18° N, whereas the Asian monsoon reaches twice as far, well into the subtropics; nor why in India, Goa receives more than 800 mm of rain during July while Bhopal sees half of that. For that level of detail, we need to abandon the homogenous sphere. Figure
Figure 2.

Northern hemisphere monsoons. Rainfall (blue shading) is located near regions of high, near-surface moist energy (orange) and concentrated on the windward side of mountains. (a) In South Asia, ascent in the regional branch of the north–south atmospheric circulation (purple vertical streamlines) stops south of the Himalayan mountains. Moist energy there becomes too low because of the effect of midlatitude winds (turquoise arrows). (b) In North America, the midlatitude westerly wind is deflected south by the Rocky Mountains and the Sierra Madre, picks up moist energy from the Gulf of California, and is lifted upslope to create a band of monsoonal rainfall. (c) Ascent in East Asia is because of warm monsoon air sliding over the colder midlatitude air flowing from the northern side of the Tibetan plateau. (d) In Africa, the deep monsoonal circulation stops, and moist energy becomes too low to support rainfall, once the air reaches the Sahara desert.
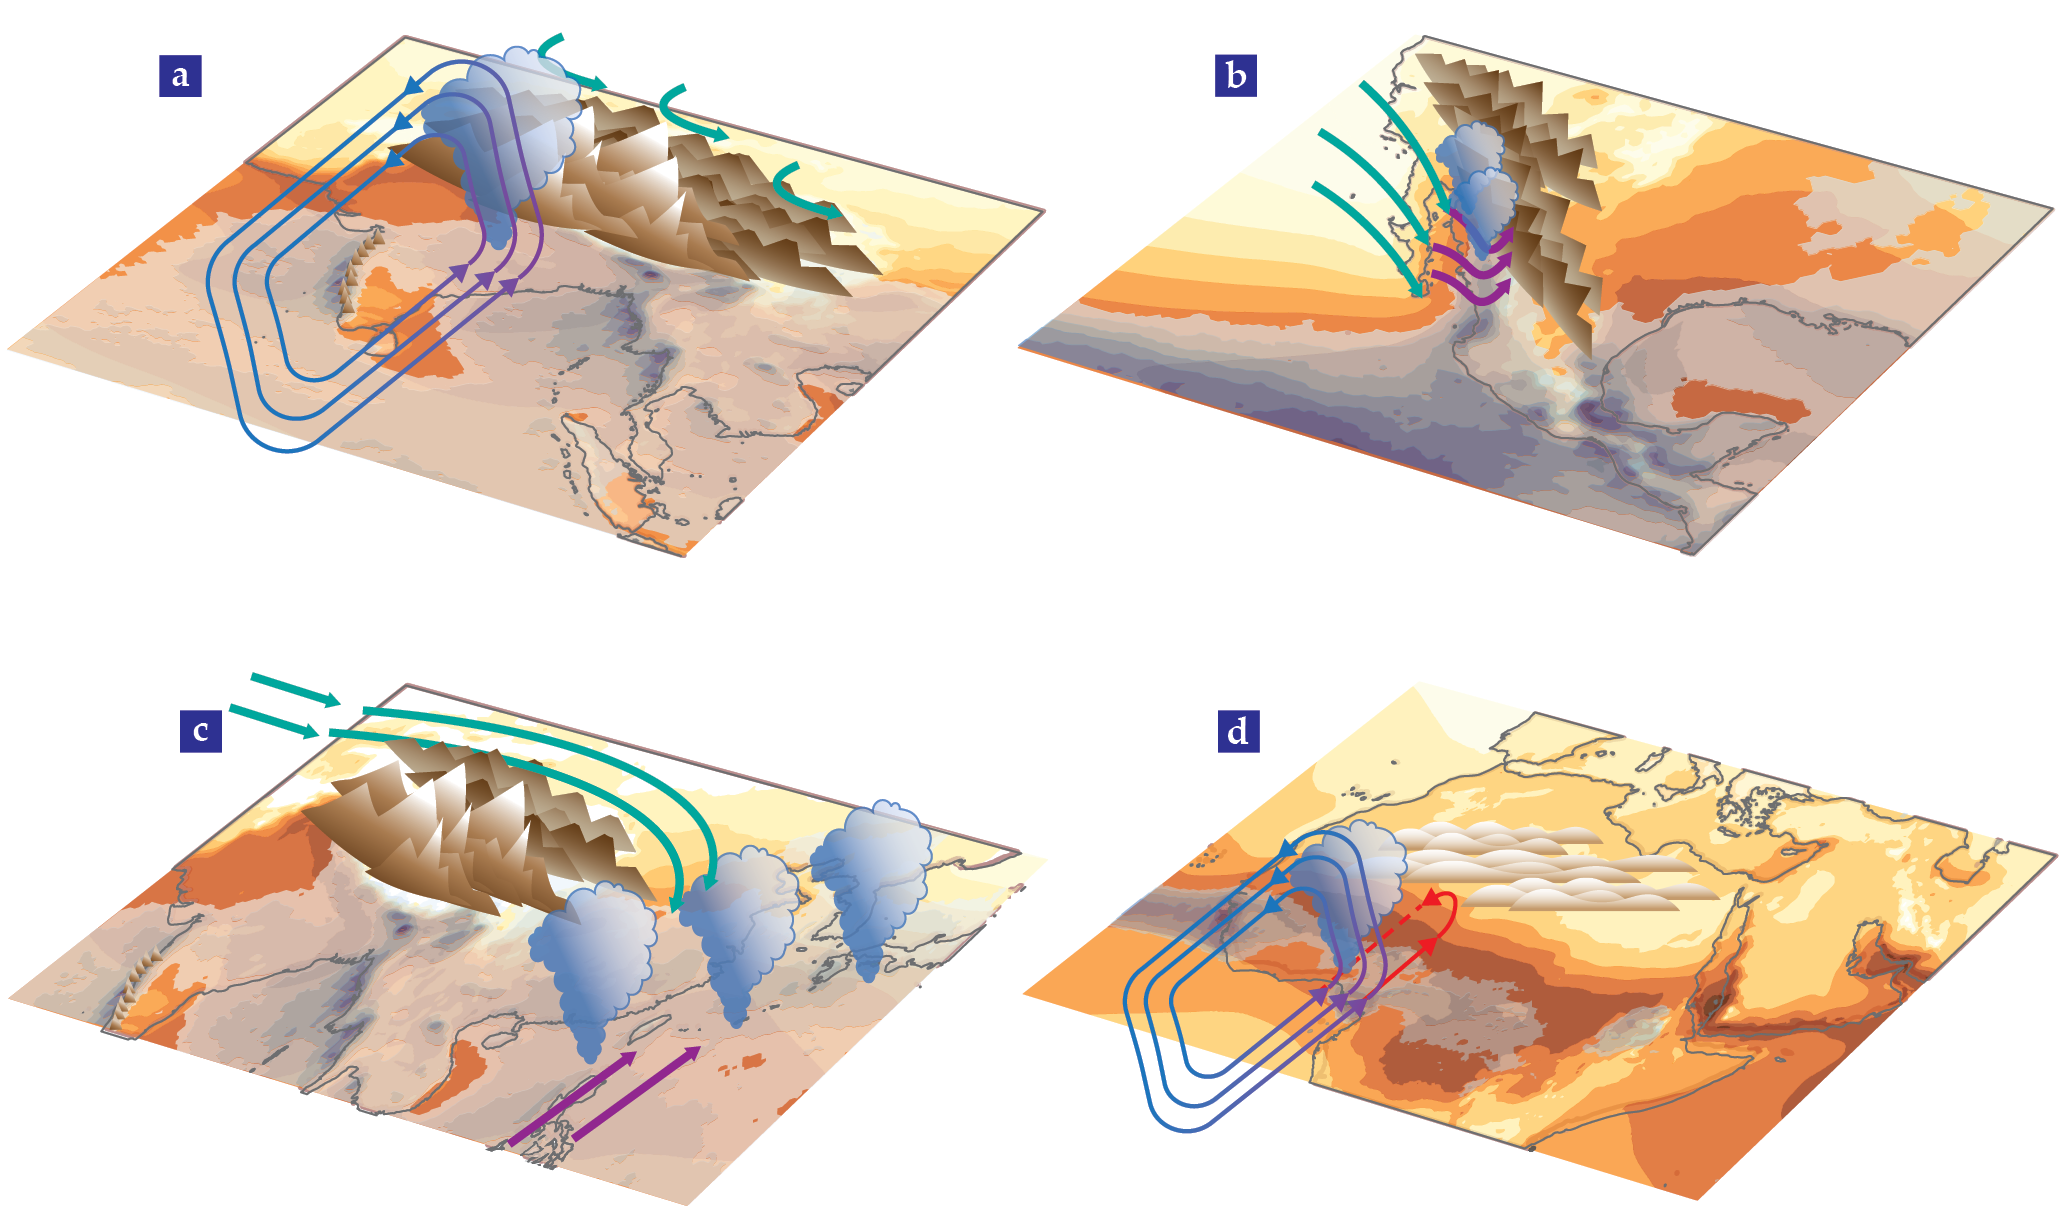
Mountains interact with the atmospheric circulation in two ways: as a source of heating at higher elevations and as barriers to the wind. Turbulent fluxes transfer heat from the mountain terrain, which is heated by the summer sun, to the high-altitude atmosphere. The transfer amplifies the pressure differential between the hot land and the cold ocean. That mechanism was long considered to be the main effect of mountain ranges on the strength of the monsoon circulation. But the exchange of dry heat from mountainous terrain remains a secondary source of energy compared with the heating of condensation released in thunderstorms. Instead, mountains affect the monsoons principally by blocking the wind and, in so doing, changing the distribution of moist energy, the location of ascent, or both.
Air can go around mountains or rise up their slopes. The effect of rising air is readily seen because it is always associated with cooling and, given enough moisture, with cloud formation and rainfall. As a result, concentrated bands of heavy seasonal rain fall along the Western Ghats of India, the Arakan range of Myanmar, the foothills of the Himalayas, and other similar places (see figure
Across from the warm Bay of Bengal, there is plenty of moisture to bring rain to the Arakan mountains. Between them and the Western Ghats, a low-pressure center develops and drives a moisture-carrying cyclonic circulation over inland India and again concentrates rainfall along the mountain range. But the Himalayas do more than just localize rainfall into a beautiful arc. They are the reason why the Indian monsoon extends so far north into latitudes that are typically much drier everywhere else in the world. 6 They stop the cold, dry midlatitude air from reaching India and lowering the moist energy; with the air’s plentiful reservoir of moist energy, the Indian monsoon remains vigorous well into the subtropics.
The interaction between mountain ranges and the midlatitude westerly wind also controls the North American
7
and East Asian
8
monsoons. Were it not for the Sierra Madre Occidental running parallel to the Pacific coast of Mexico, the westerlies would go around the Rockies at roughly 30° N, and the North American monsoon would extend across the width of Mexico at tropical latitudes before fading northward. Instead (see figure
Shaped by the interactions of the midlatitude westerlies with the Tibetan Plateau, the East Asian monsoon is a unique mix of tropical and midlatitude characteristics. In spring, when the wind has to flow over the mountains, the circulation develops eddies, just as a stream flowing over a boulder would. The eddies create a northerly wind that collides with the monsoonal southerlies along an east–west front—known in Japan as Baiu and in China as Meiyu—where air is lifted and rain forms (see figure
Over North Africa and Australia, the poleward extent of the monsoon is set not by mountains but by deserts. Because deserts are bright, highly reflective dry surfaces, less solar energy enters the system, and less moisture fuels convection. The flow, therefore, is limited: When the low-level monsoon wind penetrates inland—converging into the low-pressure center that forms over the hot desert—it has only enough energy for shallow ascent.
9
Deep, rain-bearing convection remains equatorward and is vigorous enough to sustain the African branch of the planetary monsoonal circulation, even as a layer of desert air, which forms the return flow of the shallow circulation, is entrained into it (see figure
As immense and immutable as they seem, deserts have not always been where they currently are. As Earth’s eccentric orbit and angle of tilt wobble periodically over many thousands of years, the distribution of sunshine can change enough to rearrange the planetary monsoonal circulation. That rearrangement brings rainfall to otherwise dry places, sustains vegetation, and slowly transforms the bright, dry desert to a green, moist savannah. As recently as 5000 years ago, the West African monsoon reached much farther poleward, and our ancestors were seeing and painting hippos in what is now the center of the Sahara desert. (For more on how celestial mechanics affects Earth’s climate, see the article by Mark Maslin, Physics Today, May 2020, page 48 .)
Sources of natural variability
Although it takes the uplifting of mountains or alterations in Earth’s orbit to create wholesale changes in monsoons, relatively small variations of around 10% of the seasonal rainfall happen all the time—and have profound consequences on ecosystems and human societies, as shown by the correlation between rainfall and food production in India plotted in figure
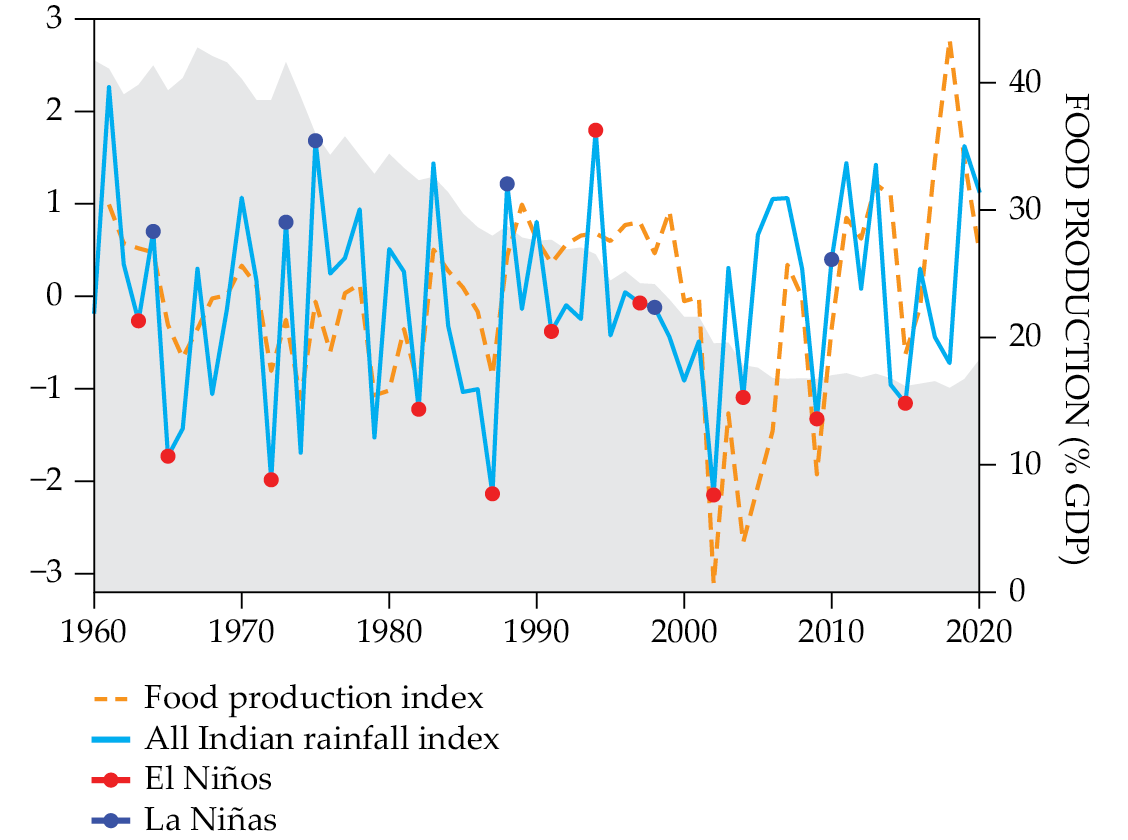
Figure 3.

India’s rain during the monsoon season (light blue) is modulated in part by the El Niño–Southern Oscillation. Droughts are more likely in years when the equatorial east Pacific Ocean is warm (El Niño years, marked by red circles) than in years when the region is cold (La Niña years, marked by blue circles). Food production in India has grown exponentially over time, but when anomalies are calculated from that growth curve, the relationship between anomalous food production (dashed orange line) and years of good or poor rainfall becomes apparent. The gray background shading shows the declining importance of the agricultural sector as a percentage of India’s GDP.
The convective nature of monsoonal rainfall explains its variability at the time scale of days. In its simple form, convection happens when denser, colder air finds itself unstably on top of lighter, warmer air: Any fluctuations tend to balance the instability and return the atmospheric column to a neutral state. If those fluctuations are random, rain showers will be scattered in unpredictable ways. Otherwise, convection can get organized: in squall lines, which are lines of thunderstorms that move as a unit; around atmospheric waves that provide favorable conditions for low-level moistening or lift; and through more complex feedbacks between convection, the wind that converges into it while picking up water vapor from the surface, and the cloud droplets and ice crystals that reflect and absorb radiation. (For more on cloud convection, see the article by Caroline Muller and Sophie Abramian, Physics Today, May 2023, page 28 .)
For example, most rain in West Africa is the product of highly organized mesoscale convective systems that extend for tens of to roughly a hundred kilometers and are often associated with atmospheric waves that travel along a strong easterly wind at the core of the monsoon region. In central India, the most intense rain is associated with monsoon depressions: tight low-pressure systems resembling weak tropical cyclones that typically form over the Bay of Bengal and travel inland. If the environment is sufficiently moist, those disturbances travel as far as Pakistan, as they repeatedly did in the summer of 2022, bringing floods and devastation.
Both the African easterly waves and the Asian monsoon low-pressure systems have time scales of a few days. But over weeks, those monsoons have what are known as active and break phases. An active phase can lead to floods, and a prolonged or ill-timed break can dry crops. Over the Indian Ocean and the northwestern Pacific Ocean, the modulating influence comes from the so-called boreal summer intraseasonal oscillation, which produces alternating bands of active and inactive convection that extend in a northwest–southeast direction and propagate to the northeast. The mechanisms responsible for the intraseasonal oscillation are still debated. 10 One class of theories focuses on the effect of the strong vertical wind shear in the background monsoon flow; another focuses on the coupling between moisture and the circulation across the Indian Ocean from the relatively dry eastern equatorial region to the moist western basin.
Variations in tropical rainfall at year-to-year time scales and longer are, in large part, an atmospheric response to oceanic changes. In fact, the connection between the Indian monsoon and the state of oceans far away is at the center of another pivotal moment in the history of climate science: the discovery of the El Niño–Southern Oscillation (ENSO), the most important mode of natural climate variability. After the 1877 failure of the monsoon rains and thus of the crops in India, the British Colonial Service established meteorological observatories there and searched for monsoon predictors. The effort led to the discovery of far-flung meteorological correlations between India and Mauritius, Australia, and even farther away in Argentina.
In 1928 Gilbert Walker, an applied mathematician and director general of the Indian observatories from 1904 to 1924, collated all those associations into the concept of a “Southern Oscillation,” which describes the seesaw of atmospheric pressure east and west of the date line. 11 Forty years later the meteorologist Jacob Bjerknes linked the variation in the Southern Oscillation to the variations in the temperature of the eastern equatorial Pacific, known as El Niño (if they are warm) or La Niña (if they are cold). 12 Together, the phenomenon is termed the El Niño–Southern Oscillation (see the article by David Neelin and Mojib Latif, Physics Today, December 1998, page 32 ).
When the equatorial eastern Pacific is anomalously warm, the whole tropical atmosphere higher than about 1.5 km warms because of the heat released in clouds. Away from the warm ocean anomalies, warmer air over a relatively cool surface boundary layer stabilizes the atmosphere, which leads to less frequent convection and less rainfall.
13
Although a warm El Niño is usually associated with drought in monsoon regions worldwide, the influence of other ocean basins and complexities in the atmospheric circulation can mask the influence of the Pacific. In India, for example, the strength of the negative correlation between ENSO and seasonal rainfall (see figure
Human effects on monsoon rainfall
Against the backdrop of natural variability, long-term trends in monsoon rainfall are emerging
14
(see figure
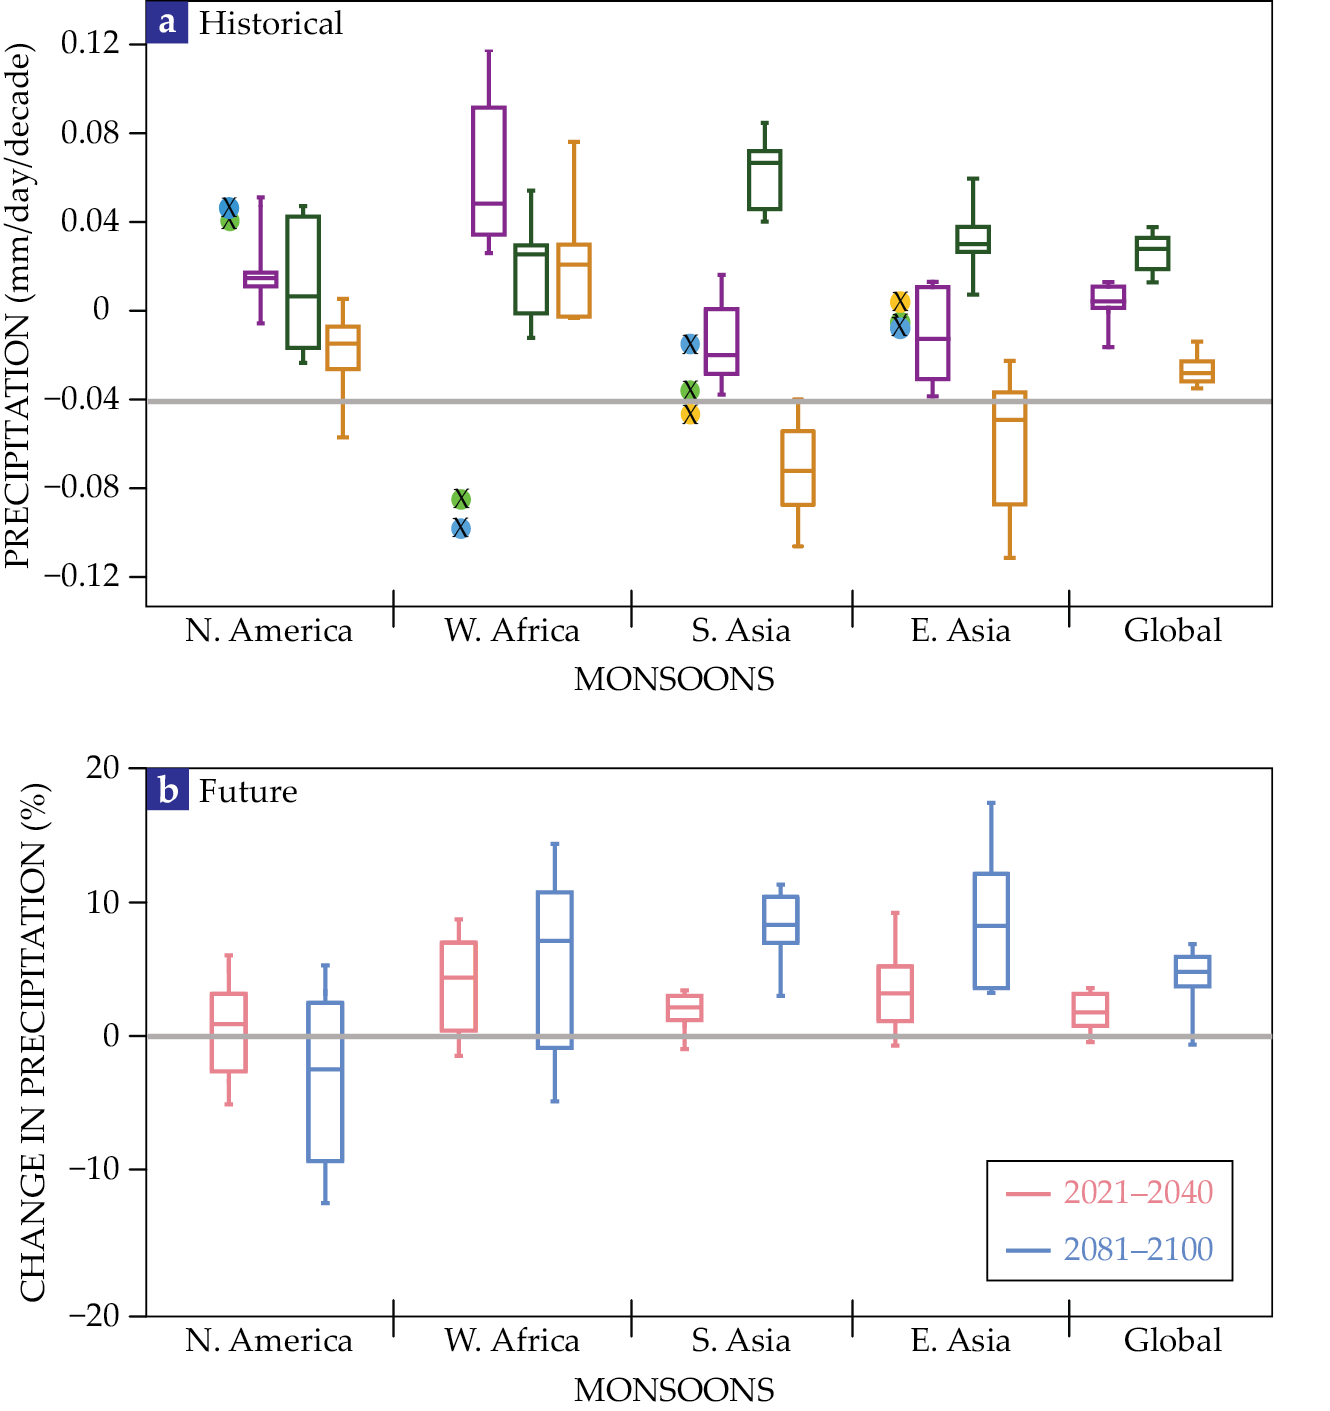
Figure 4.

Long-term changes. In the Northern Hemisphere, (a) historical trends of regional monsoons and the global monsoon from three observational data sets (colored dots) are compared with simulations by climate models (box-and-whisker plots) forced with greenhouse gases only (green), aerosols only (orange), or all historical forcings (purple). (b) For each regional monsoon and the global monsoon, future rainfall changes from the historical mean are plotted for the near term and the long term. Because wind patterns are so variable under future conditions, the future change in monsoon precipitation is highly uncertain. (Adapted from figure 1 of P. A. Arias et al., in Climate Change 2021: The Physical Science Basis—Working Group I Contribution to the Sixth Assessment Report of the Intergovernmental Panel on Climate Change, V. Masson-Delmotte et al., eds., Cambridge U. Press, 2021, p. 35.)
Most GHGs are well mixed in the atmosphere, so the radiative forcing they impose is approximately homogeneous. Nevertheless, the atmospheric response is not homogeneous. The warming of surface temperature, for example, is enhanced over land and at high latitudes, and the response of rainfall is even more varied, being characterized by wetting in the equatorial band and at mid- to high latitudes but by drying in the subtropics. The banded structure in rainfall anomalies can be described as the enhancement of the present-day gradients between moist and dry climates. That pattern is expected when an increase in atmospheric humidity in a warmer atmosphere—itself expected from the Clausius–Clapeyron relationship between temperature and the saturation of water vapor—is combined with a planetary circulation that is not greatly changed by the GHG forcing.
On the hypothetical homogeneous planet that we took as a first approximation of Earth, an enhancement of the present-day pattern would mean a rainier rainy season during the global monsoon and a drier dry season. As it turns out, simulations with comprehensive numerical models of the climate system indicate that such an approximation is sufficient to explain the combined regional monsoons and even some of the individual ones (see figure
For example, the predicted increase in Indian rainfall of 4% per degree of global warming is, in large part, the consequence of the increase in atmospheric humidity.
15
But for any quantitative prediction of rainfall, simulations need to incorporate wind changes in response to GHG increases. Just as is the case for the year-to-year natural variability, most wind anomalies come from gradients in the surface temperature of the global oceans. Unfortunately, winds are so sensitive to the details of the warming pattern that different climate models predict different responses, which lead to a large spread in the prediction of future monsoon changes (see figure
The effect of atmospheric aerosols is even more complicated. Unlike carbon dioxide, aerosols absorb and scatter light, tend to concentrate close to their sources instead of spreading evenly across the globe, and can change the brightness and life span of clouds. Thus uncertainties arise in the characterization of radiative forcing induced by aerosol as well as in the simulation of the response to such forcing.
Nevertheless, evidence is accumulating that 20th-century aerosol emissions induced long-term changes in monsoonal rainfall. Increases in North American and European aerosol emissions after World War II contributed to the mid-century drying trend in West Africa,
16
which culminated with the great droughts of 1968–73 and 1983–84. The increase in emissions in Asia contributed to the decline in average seasonal rainfall over central India
15
between the 1950s and the early 2000s. Clean air initiatives have greatly reduced aerosol emissions in North America and Europe, and similar ones are expected to be implemented in Asia. When that happens, the monsoons will respond to the changing pattern of radiative forcing (see figure
Rainfall extremes
Across the globe, the chitchat about the weather, the recollections of the farmers, and the data of the climatologists all agree: Rain has been falling more erratically with heavier downpours and spells of drought—and not just in monsoon regions. Those changes are an expected consequence of warming. 17 For more on extreme climate, see the article on page 40 in this issue.
One way of explaining the observations—especially relevant for tropical regions—starts with linking convection to the environment in which it happens. Raindrops form when a plume of air is sufficiently buoyant to reach high into the atmosphere and create a deep cloud. For the most part, that buoyancy is determined by how warm and moist the plume is compared with the environment above and whether it entrains dry air during its ascent: Moisture availability is the key parameter. During a rainfall event, precipitation always dries the air column, while the circulation can either replenish its moisture or bring drier air. The tug-of-war between those processes determines the length of the event and, to a good approximation, the total accumulation of rainfall. In an environment with more moisture, the circulation can have more extreme fluctuations, which leads to a broader distribution of rainfall and more common extreme events.
A rough estimate of how extreme rainfall will change in a warming world is derived from the Clausius–Clapeyron relationship: A warmer atmosphere, without unexpectedly large changes in relative humidity, will contain more water vapor. In a convective event, low-level convergence will bring in that extra vapor, and its condensation will release extra heat, leading to a more vigorous circulation and convergence. For every 1 °C of warming, the direct increase in moisture resulting from the Clausius–Clapeyron effect will lead, at a typical tropical temperature, to a 7% increase in rainfall, and the additional feedback with the convergent circulation can more than double that increase.
The theory predicts the intensity of individual convective elements but is not sufficient to predict more complex changes, such as shifts in the tracks of tropical depressions. Thus predicting flood risk at the local level remains a research goal.
The world’s monsoons are continuously monitored and anticipated in weather forecasts, seasonal outlooks, and climate projections. It is the task of meteorologists and climate scientists to deepen our understanding of the workings of the atmosphere to reduce uncertainties in all those predictions. As we make clear here, we are hard at work on that task. But societies have already been given enough information to become more resilient to the inevitable extreme weather and climate events and to prevent the worsening of such hazards.
Although food production in India, for example, is still tightly linked to the seasonal rainfall, the nation’s GDP is not so tightly linked because the Indian economy has diversified, and agriculture for the past several decades has played a diminished role (see figure
Just as important, though, the world needs to prevent the ongoing exacerbation of weather and climate hazards by slowing climate change. To do so requires curtailing and eventually ending our emission of greenhouse gases—a tall order for sure, but here, too, we know enough to act. 18
References
1. E. Halley, Philos. Trans. R. Soc. London 16, 153 (1686). https://doi.org/10.1098/rstl.1686.0026
2. S. Gadgil, J. Earth Sys. Sci. 127, 1 (2018). https://doi.org/10.1007/s12040-017-0916-x
3. G. C. Simpson, Q. J. R. Meteorol. Soc. 47, 151 (1921). https://doi.org/10.1002/qj.49704719901
4. T. Schneider, Annu. Rev. Earth. Planet. Sci. 34, 655 (2006). https://doi.org/10.1146/annurev.earth.34.031405.125144
5. R. Geen et al., Rev. Geophys. 58, e2020RG000700 (2020). https://doi.org/10.1029/2020RG000700
6. W. R. Boos, Z. Kuang, Nature 463, 218 (2010). https://doi.org/10.1038/nature08707
7. W. R. Boos, S. Pascale, Nature 599, 611 (2021). https://doi.org/10.1038/s41586-021-03978-2
8. J. C. H. Chiang et al., J. Clim. 33, 7945 (2020). https://doi.org/10.1175/JCLI-D-19-0888.1
9. S. E. Nicholson, Clim. Dyn. 32, 1155 (2009). https://doi.org/10.1007/s00382-008-0514-3
10. K. Kikuchi, J. Meteorol. Soc. Jpn. Ser. II 99, 933 (2021). https://doi.org/10.2151/jmsj.2021-045
11. G. Walker, Q. J. R. Meteorol. Soc. 54, 79 (1928). https://doi.org/10.1002/qj.49705422601
12. J. Bjerknes, Mon. Weather Rev. 97, 163 (1969). https://doi.org/10.1175/1520-0493(1969)097<0163:ATFTEP>2.3.CO;2
13. J. D. Neelin, C. Chou, H. Su, Geophys. Res. Lett. 30, 2275 (2003). https://doi.org/10.1029/2003GL018625
14. B. Wang et al., Bull. Am. Meteorol. Soc. 102, E1 (2021). https://doi.org/10.1175/BAMS-D-19-0335.1
15. X. Li et al., J. Clim. 28, 4107 (2015). https://doi.org/10.1175/JCLI-D-14-00559.1
16. K. Marvel, M. Biasutti, C. Bonfils, Environ. Res. Lett. 15, 084023 (2020). https://doi.org/10.1088/1748-9326/ab858e
17. J. D. Neelin et al., Curr. Clim. Change Rep. 8, 17 (2022). https://doi.org/10.1007/s40641-021-00177-z
18. Project Drawdown, The Drawdown Review: Climate Solutions for a New Decade (2020).
More about the authors
Michela Biasutti is a research professor at Columbia University’s Lamont–Doherty Earth Observatory in Palisades, New York. Mingfang Ting is a professor at the Columbia Climate School in New York City. Spencer Hill is an assistant professor at the City College of New York.


