The changing face of Titan
DOI: 10.1063/1.2970210
Thy cheeks look red as Titan’s face, blushing to be encounter’d with a cloud.
—William Shakespeare, Titus Andronicus
Thy cheeks look red as Titan’s face, blushing to be encounter’d with a cloud.
—William Shakespeare, Titus Andronicus
Referring to the Sun, Shakespeare wrote this line sometime around 1590, about two Titan years before the discovery of that moon by Christiaan Huygens in 1655. Titan was given its name by John Herschel two centuries later, but little was learned about it until 1907, when the sharp-eyed Catalan astronomer Josep Comas Sola noticed that Titan’s tiny disk, barely perceptible even on a good night through a large telescope, is dark at the edges. Comas Sola correctly noted that this “limb-darkening” effect is also seen on Neptune and thus inferred that Titan has an atmosphere. That was confirmed in 1944 by Gerard Kuiper, who demonstrated that Titan’s ruddy reflectance spectrum shows absorption bands due to methane. It turns out that methane plays similar roles on Titan to those water plays on Earth, and the recent deluge of data from large telescopes and the NASA–European Space Agency Cassini–Huygens mission shows that Saturn’s giant moon has a remarkably Earth-like meteorology. 1
The discovery of a significant atmosphere sets Titan apart from the other satellites in the solar system. Indeed, the atmosphere makes it more planetlike than many planets. Titan was therefore a priority target for the Voyager tours of the outer solar system, and in 1980 Voyager 1 revealed several striking things about Titan’s atmosphere, although its surface stayed largely hidden.
First, the atmosphere is massive. The surface pressure is 1.5 bars, which, given Titan’s moonlike gravity of 1.35 m/s2, implies that a column of air in its atmosphere has 10 times more mass per unit area than Earth’s. The pressure, coupled with a low temperature of 94 K, implies a density of 5.3 kg/m3, four times that of sea-level air on Earth. Despite those exotic conditions, some remarkable parallels exist with Earth’s atmosphere. First, the surface temperature on Titan is close to the triple point of methane, just as Earth’s is close to that of water. The coincidence suggests that phase changes of methane can occur in a chilly version of Earth’s hydrological cycle. 2
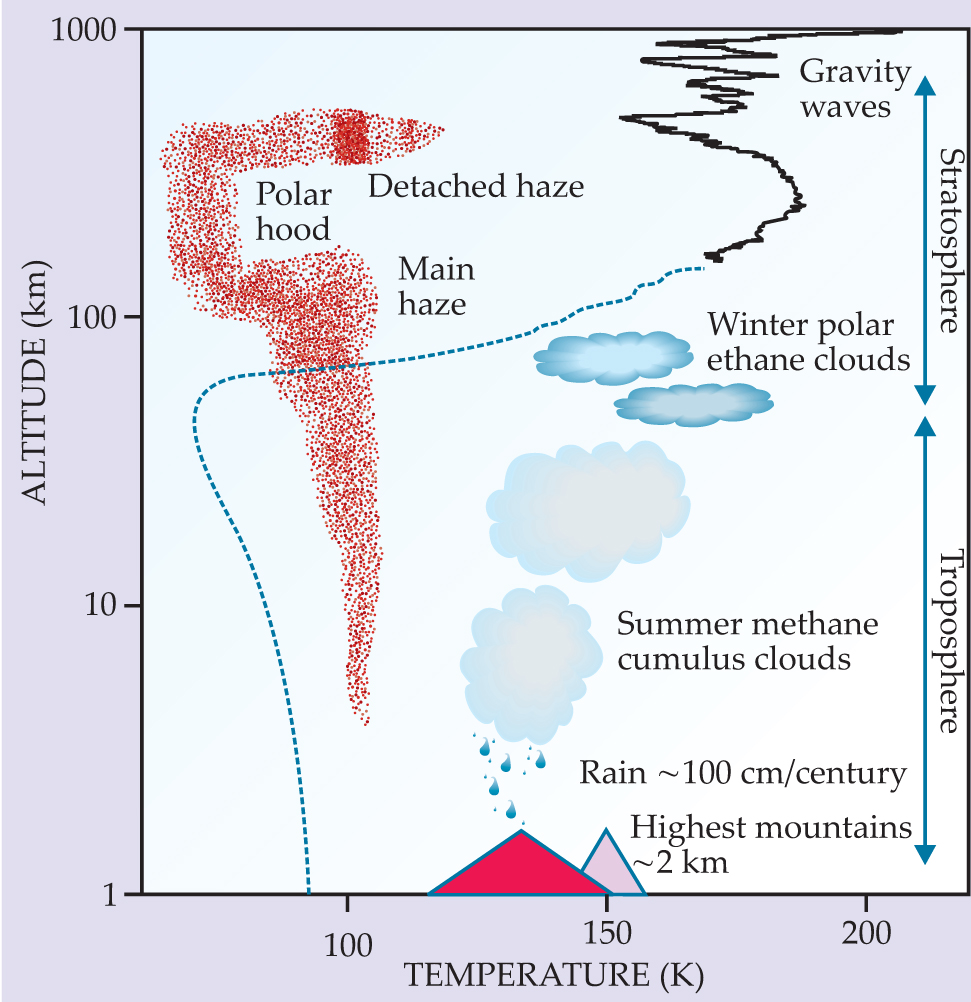
Second, the vertical structure of temperature mirrors that of Earth (see figure 1). A greenhouse-warmed convective troposphere drops in temperature from the moon’s surface to a minimum—the tropopause, at about 40 km—where moisture is cold trapped. Above that altitude is a stable stratosphere where molecules are warmed through solar absorption by Titan’s haze.

Figure 1. Vertical structure of Titan’s atmosphere and a schematic of its menagerie of clouds and haze. In 2005 the Huygens probe entered Titan’s atmosphere and landed on its surface. The temperature profile recorded during the hypersonic entry (solid line) and the subsonic parachute descent (dashed line) resembles that of Earth in shape, but with lower temperatures and a stretched vertical scale. Irregularities in the stratospheric temperature profile are due to upward-propagating gravity waves. While Earth’s tropospheric thickness and the height of its highest mountains are about the same (roughly 10 km), Titan’s troposphere is much more extended vertically. Various atmospheric structures, such as the detached haze layer, polar hood, and various clouds akin to ones shown in figures
On Earth, the fact that the main greenhouse gas, water vapor, is condensable leads to positive feedbacks that can amplify climate change. On Titan, much of the greenhouse effect is due to methane, 3 which is similarly condensable. On Earth it is ozone that absorbs short-wave sunlight, protecting us from excessive UV rays. On Titan it is a photochemical haze, produced by sunlight’s destruction of methane and by energetic particles in the Saturnian magnetosphere, that blocks most of the sunlight. Indeed, Titan’s atmosphere has much in common with a nuclear-winter scenario on Earth, in which obstruction of sunlight would lead to an antigreenhouse effect that cools the surface. Beyond observing the ubiquitous thick haze, Voyager 1 also identified almost 20 organic gases in Titan’s atmosphere and the molecular nitrogen that makes up all but a small percentage of it. Methane accounts for only 1.5–5% of those gases and, like water vapor on Earth, is variable. One-dimensional models of Titan’s photochemistry suggest that hundreds of meters of organics—in particular, ethane, which is liquid at Titan surface temperatures—should accumulate on the surface over the age of the solar system. 4
With our scientific appetites whetted by the prospect of surface liquids—perhaps even a global ocean—Titan was a prime target of the international Cassini–Huygens mission. A massive NASA-built spacecraft launched in 1997 has been in orbit around Saturn since 2004, and by the end of its nominal mission in June of this year it will have made 45 flybys of Titan, each one a frantic but exquisitely choreographed encounter designed to train a selection of Cassini’s arsenal of instruments on Titan as it sweeps past at 6 km/s. On the third encounter, in January 2005, the European-built Huygens probe made a 2.5-hour parachute descent through Titan’s atmosphere to its long-hidden surface.
Alien rain
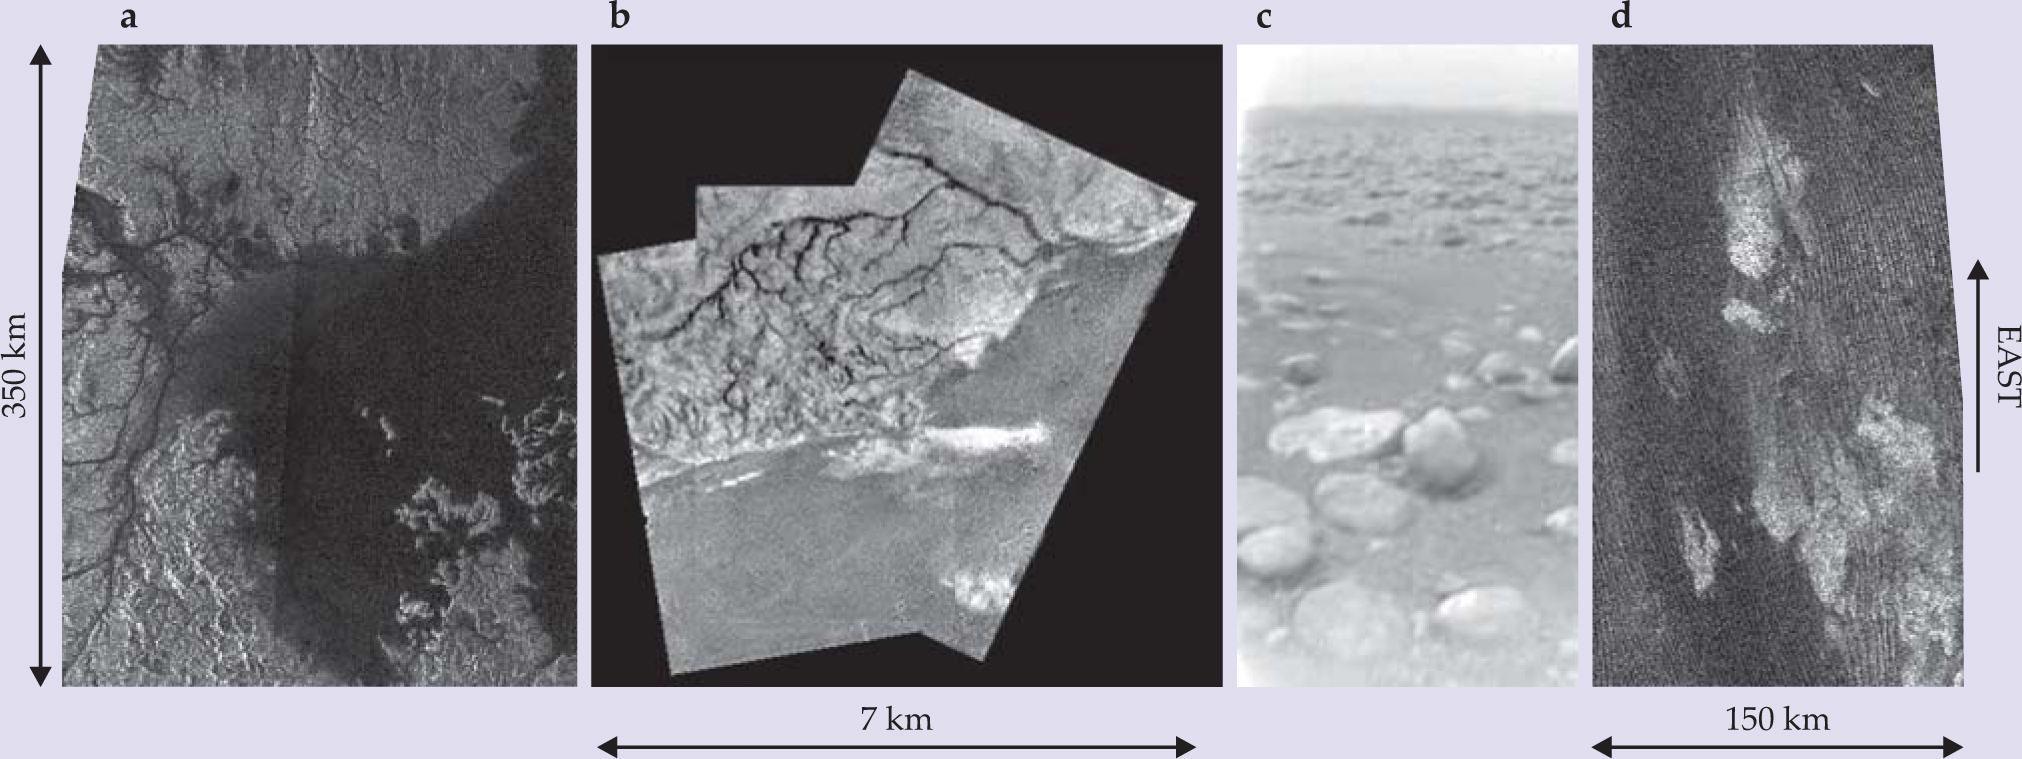
Titan is proving to be a bewilderingly complex object. But as the flybys tease out one piece of the puzzle at a time, the full picture is slowly emerging. Possibly the greatest surprise from Cassini so far is how Earth-like Titan’s landscape is. The pictures from the Huygens probe 5 show terrain that looks familiar—hills cut by a dendritic network of river channels. The probe actually landed in a streambed damp with methane and littered with rounded cobbles, a sure indication that the sediments had been tumbled in a river, perhaps during a flash flood. Radar and near-IR images from orbit have shown larger channels, complete with meanders like terrestrial rivers, in other locations (see figure 2).

Figure 2. A surface modified by an atmosphere. (a) A Cassini radar image reveals a network of dark river channels draining into a hydrocarbon lake near Titan’s north pole. (b) This view from the Huygens probe at about 8 km over Titan shows a network of smaller channels on highland terrain, evidently once fed by rainfall. (c) After the probe landed on the damp surface, its knee-high camera photographed rounded cobbles, up to about 15 cm across, on a streambed. (d) This radar image, taken by Cassini, shows a massive field of parallel sand dunes near Titan’s equator.
(Figures a and d courtesy of NASA/Jet Propulsion Laboratory; figures b and c courtesy of NASA/JPL, the European Space Agency, and the University of Arizona.)
Besides Earth, Titan is the only place in the solar system today where rain falls to the surface. But in Titan’s exotic environment, the balance between surface tension and aerodynamic forces on a falling drop of liquid methane allows the drops to be gigantic—about 1 cm in diameter, rather than the roughly 6-mm drops that fall on Earth. Moreover, in Titan’s thick atmosphere and low gravity, those drops fall at only 1.6 m/s (compared with 10 m/s on Earth), more like fluffy snowflakes do on Earth. Supporting that gentle picture is a relatively weak hydrological cycle: Every raindrop that falls is one that requires solar heat to reevaporate to complete the cycle, and Titan’s surface gets one-thousandth as much sunlight as the surface of Earth. When methane’s lower latent heat and density are taken into account, that translates to roughly 1 cm per Earth year of average rainfall on Titan, 6 compared with about 1 m per year on Earth.
However, Titan’s landscape reminds us that like many terrestrial desert areas similarly scarred by canyons, averages do not tell the whole story. Rain is a highly disequilibrium phenomenon; in rough terms, the atmosphere acts as a relaxation oscillator. Evaporation slowly fills the atmosphere with moisture until some threshold humidity is reached, triggering the formation of a convecting cloud that locally discharges much of its moisture into liquid drops that quickly fall to the ground. Titan’s dense atmosphere can hold enormous amounts of moisture—equivalent, if all condensed on the surface, to several meters of liquid, compared with the few centimeters of precipitable water in Earth’s atmosphere. Moreover, models of Titan rainstorms indicate that many tens of centimeters of rainfall can be dumped in just a few hours. 7 (Those models are developed from Earth models, although some key factors, such as the abundance of cloud-condensation nuclei and the efficiency of droplet coalescence in a cloud, are not well known for Titan.)
Because of the low overall intensity of its cycle, Titan is to Earth’s hydrological cycle what Venus is to Earth’s greenhouse effect—a terrestrial phenomenon taken to extremes. To locally recharge Titan’s atmosphere with moisture requires centuries of solar-driven evaporation. Imagine massive floods separated by centuries of drought, a spectacular if uncomfortable state toward which Earth’s climate may be evolving as global warming continues to increase the moisture-holding capacity of the atmosphere. 8
Seasonal change
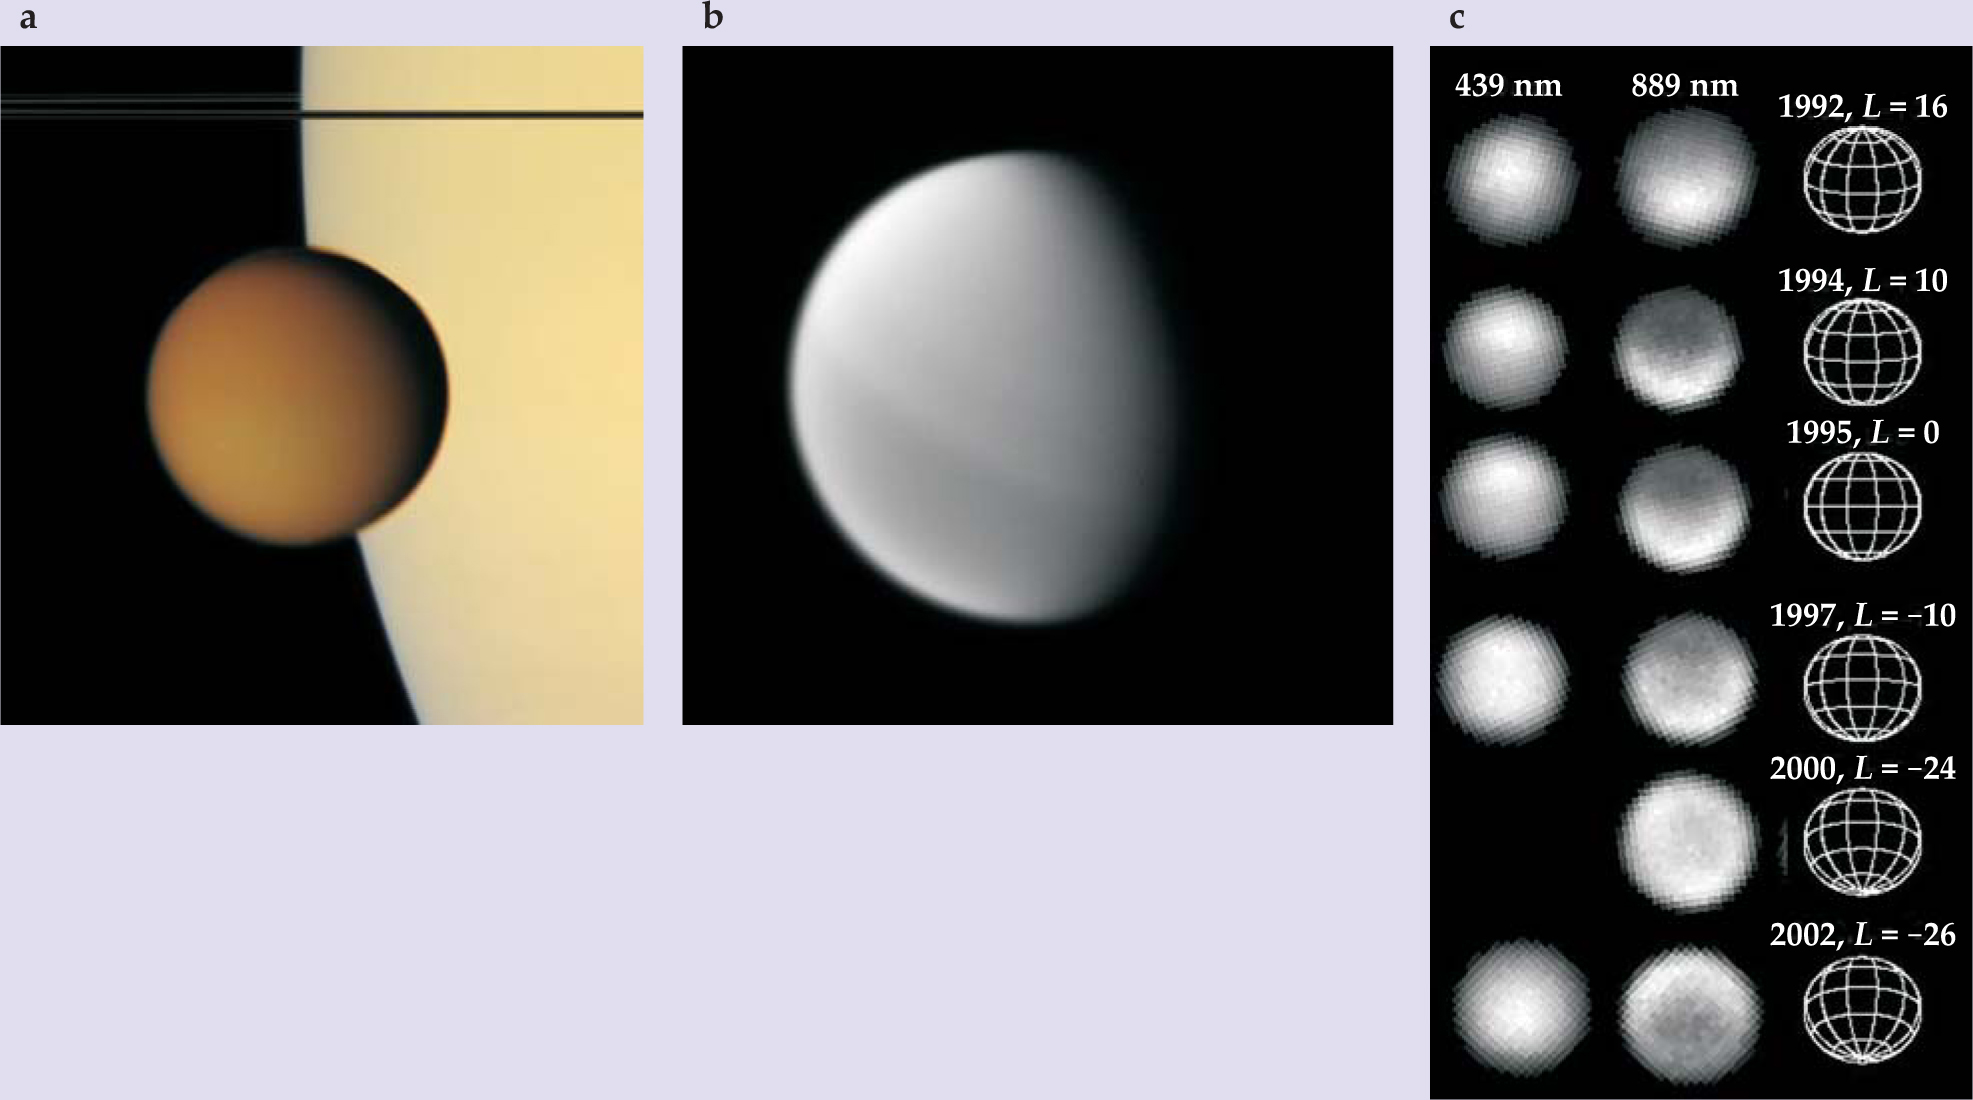
Changing cloud patterns have been observed on Titan for more than a decade. 9 In 1995 spectroscopic measurements from Earth’s surface and images from the Hubble Space Telescope indicated clouds in the upper troposphere where methane would be expected to condense (see figure 3). A vast and recurring cloud system around the south pole was imaged by the Keck and other telescopes between 2001 and 2005, during Titan’s southern summer. Throughout the season, solar heating of the surface was strongest at the south pole, which suggested that those clouds were like convective summer storms on Earth, triggered by surface heating. Both Cassini and ground-based data showed the cloud tops to be ascending at speeds of a few meters per second, just as convection models predicted. But in 2005, soon after Cassini’s arrival, those polar clouds disappeared. Smaller and more sporadic clouds have appeared since—particularly around 40° S. It seems likely that the overall pattern of circulation and the availability of moisture on the surface may control cloud formation as much as direct solar heating does.

Figure 1. Vertical structure of Titan’s atmosphere and a schematic of its menagerie of clouds and haze. In 2005 the Huygens probe entered Titan’s atmosphere and landed on its surface. The temperature profile recorded during the hypersonic entry (solid line) and the subsonic parachute descent (dashed line) resembles that of Earth in shape, but with lower temperatures and a stretched vertical scale. Irregularities in the stratospheric temperature profile are due to upward-propagating gravity waves. While Earth’s tropospheric thickness and the height of its highest mountains are about the same (roughly 10 km), Titan’s troposphere is much more extended vertically. Various atmospheric structures, such as the detached haze layer, polar hood, and various clouds akin to ones shown in figures
Nevertheless, seasonally changing solar heating appears to be the origin of Titan’s longest-monitored change, that of the haze in the stratosphere. Even in the 1970s, it was known that Titan’s overall brightness changed over the years, and by different amounts at blue and yellow wavelengths. The Voyager encounters showed that at the spring equinox at least, the changing brightness was due to a difference between the brightness of the two hemispheres, with the northern hemisphere of Titan at that time darker than the southern. As Titan goes around the Sun, its two hemispheres are presented to Earth by varying amounts, and their intrinsic brightness changes, most visibly at blue wavelengths, as the seasons wax and wane. 10
The haze material—tholin, named by Carl Sagan after the Greek word for muddy—has a reddish color. Whereas a haze-free Titan atmosphere would appear blue due to Rayleigh scattering by the gas—bluer, indeed, than Earth’s sky, since methane absorbs red light—the optically thick haze makes Titan appear red. The red haze lies above the bulk of the atmosphere and so blocks the blue light; 3 more haze in the north makes that hemisphere darker at blue wavelengths. In the near-IR methane absorption bands, where the haze is bright and the gas dark, the contrast is reversed.
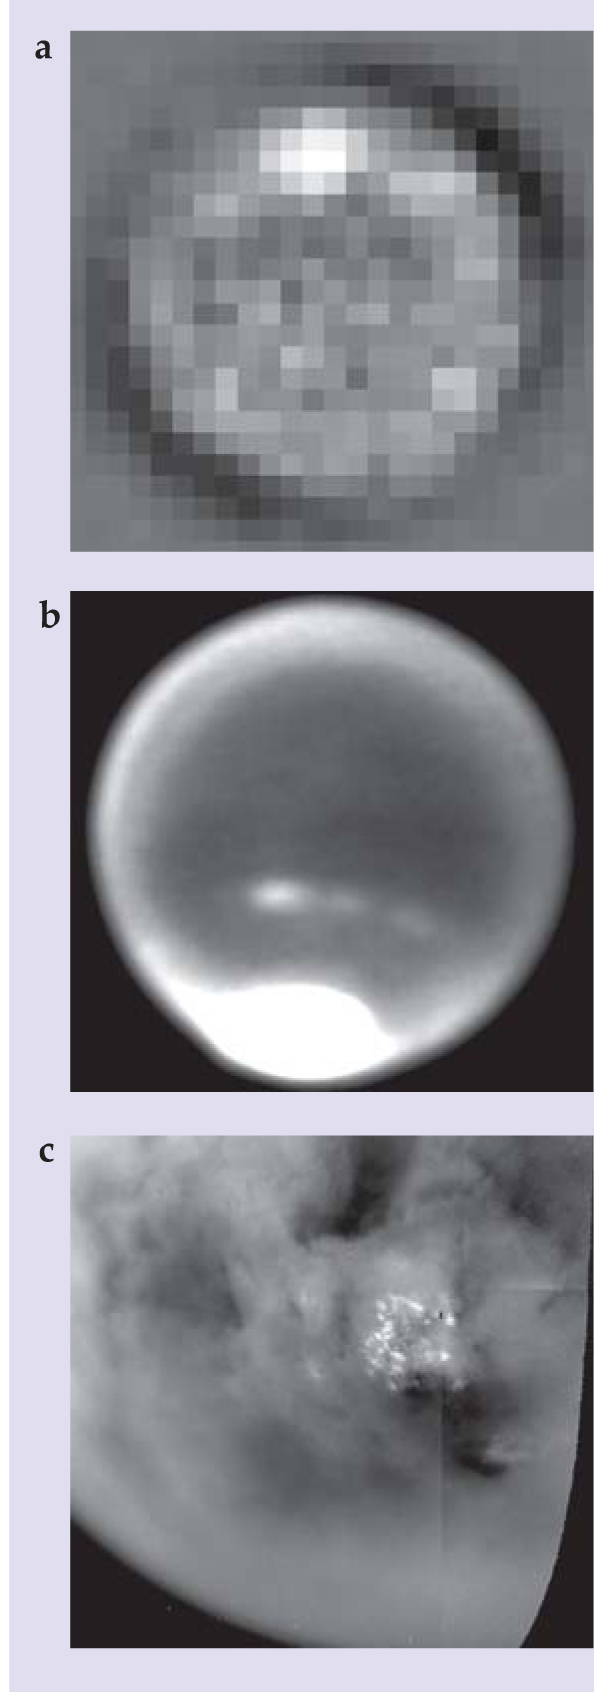
As the air warms and rises in the summer hemisphere, it drags haze with it to the winter hemisphere. And indeed, Hubble Space Telescope images taken in 1995, half a Titan year after Voyager 1, showed that the hemispheric asymmetry had reversed, indicating more haze then in the south (see figure 4). That contrast, with the enhanced haze in the south appearing as a smile in the near-IR, declined in the late 1990s and has now reverted to the Voyager picture 11 as we approach the same season in which its data were acquired. (For a schematic correlating Titan’s seasons to past, present, and future missions, see figure 5.)

Figure 5. Titan and Saturn’s year is 29.5 Earth years long. Because Saturn’s orbit around the Sun is somewhat eccentric, the seasons are of appreciably different lengths. (The designations “spring,” “summer,” and so forth apply to Titan’s northern hemisphere.) One Titan day equals 15.945 Earth days. A future flagship mission presently being considered by NASA and the European Space Agency would orbit Titan and study it in detail over several years (green) at a season complementary to that being measured by Cassini (red and blue) and the snapshots recorded by Voyager 1 and 2.
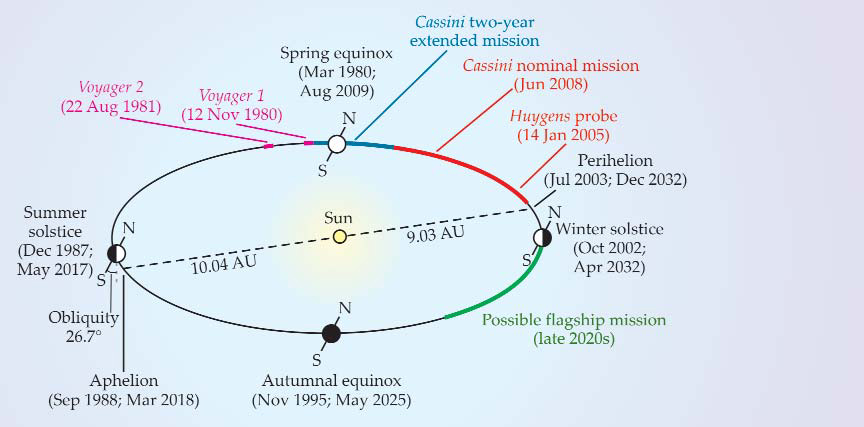

Figure 1. Vertical structure of Titan’s atmosphere and a schematic of its menagerie of clouds and haze. In 2005 the Huygens probe entered Titan’s atmosphere and landed on its surface. The temperature profile recorded during the hypersonic entry (solid line) and the subsonic parachute descent (dashed line) resembles that of Earth in shape, but with lower temperatures and a stretched vertical scale. Irregularities in the stratospheric temperature profile are due to upward-propagating gravity waves. While Earth’s tropospheric thickness and the height of its highest mountains are about the same (roughly 10 km), Titan’s troposphere is much more extended vertically. Various atmospheric structures, such as the detached haze layer, polar hood, and various clouds akin to ones shown in figures
Beyond the hemispherical haze advection, an additional process occurs in Titan’s polar regions, which are in darkness for the long polar winter. There, downwelling from the stratosphere brings air laden with organic gases to lower levels, 12 where many compounds, some of which have built up in the absence of destructive solar UV radiation, condense into a dark haze layer termed the polar hood. In images such as figure 6, that structure appears to bridge the main haze layer and a separate, “detached” haze layer, and thermal IR measurements indicate that concentrations of some gases such as methyl cyanide are enhanced by factors of 100 or more above the global average values. Dynamically isolated from the rest of the atmosphere by a circumpolar vortex, the polar hood has aspects in common with the polar stratospheric clouds that form during Earth’s polar winter. As with many other aspects of Titan, the chemistry and rates of processes differ from Earth’s, but the basic physical processes are the same.

Figure 6. Haze layers, the polar hood, and a winter polar ethane cloud system. (a) A backlit Cassini Imaging Science Subsystem (ISS) image from June 2006 shows Titan in UV light, with Saturn’s rings in the background. Light scattered from the haze makes Titan appear as a ring, rather than the simple crecent that an airless world would show. The separation between the main and detached haze layers is subtly evident at northern midlatitudes where the arrows point. (b) In this full-disk ISS UV image from September 2007, the dark north polar hood is striking and connects to the thin detached haze layer. (c) A near-IR image taken by Cassini‘s Visual and Infrared Mapping Spectrometer in December 2006 (with blue, green, and red representing 2-, 2.7-, and 5-μm wavelengths, respectively) shows a banded cloud system, probably of ethane ice crystals deep in the atmosphere, around the north pole.
(Figures a and b courtesy of NASA/Jet Propulsion Laboratory and the Space Science Institute.)
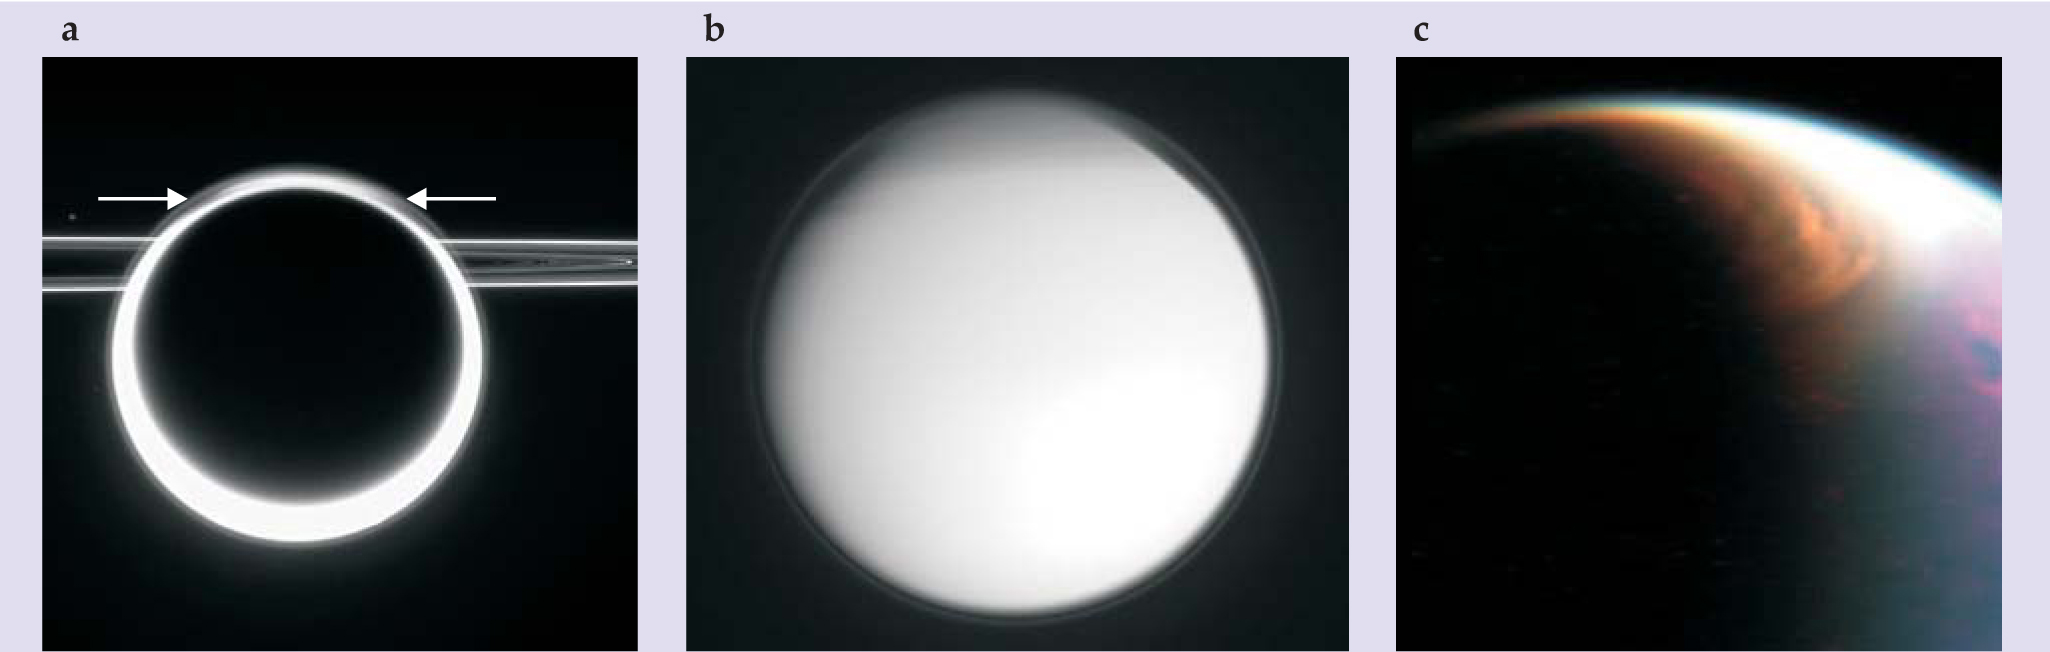
The stratospheric haze may also be connected with a recently observed extensive cloud over the north pole, presently just emerging from winter. That cloud, perhaps largely composed of ethane, may be connected with one of Titan’s most appealing landforms—lakes.
Lakes
Although surface deposits of liquid ethane and methane were long expected on Titan’s surface, it seems they form lakes only in the polar regions. 13 Titan’s high latitudes appeared from Voyager data to be only 2–3 K colder than the equator. The temperature gradient is itself an interesting problem in that it requires a surprisingly modest transport of heat from low to high latitudes given Titan’s small size and thick atmosphere. 14
Some other factors may be at work. The downwelling stratospheric circulation over the winter pole may lead to the preferential deposition of organics there, as described previously. Also, as with Earth’s oceans, it may be that geology, via topography, forces the lakes to high latitudes; perhaps the poles are simply lower in elevation, and thus liquid tends to accumulate there. More Cassini data may resolve the issue. If radar or near-IR images acquired over some years ever show the lake depths or extents to be systematically increasing at one pole at the expense of the other, it would support the idea of seasonally varying—and, by implication, methane-rich—lakes. Radar altimetry and other techniques are starting to build at least a crude model of Titan’s shape and identify the terrain’s role in controlling the distribution of surface liquids.
Unlike Earth’s oceans, however, Titan’s lakes do not present a reservoir that is significantly larger than the inventory of the main condensable greenhouse gas in the atmosphere. 15 If Titan had much larger seas, dangerously unstable climate feedbacks could occur. Those feedbacks might include atmospheric collapse, in which much of the atmosphere condenses onto the surface, or the reverse, a runaway greenhouse. Here, a warmer surface leads to more evaporation, and hence more greenhouse warming, and so on. However, the small methane inventory on the surface would not be able to buffer the atmosphere against photochemical depletion for more than a few tens of millions of years. Additional methane must come from a larger, hidden reservoir in the ground, like terrestrial groundwater, or be supplied episodically through cryovolcanoes. If it’s the latter, then the abundance of methane on Titan—and therefore the strength of the greenhouse effect—may have had a highly variable history, with much wetter or colder periods in the past. There is also the question of why there is not more liquid ethane on the surface. Perhaps some process removed it. 2
Dunes
Not all of Titan’s surface is wet. Indeed, some 20% of it, all at low latitudes, is covered with giant sand dunes. 15,16 The dunes present a number of intriguing and fundamental puzzles. Before the Cassini mission, the weak sunlight at Titan was not thought to be able to drive winds fast enough to move sand. (Incidentally, sand refers to the particle size; the material is likely composed of organics or ice rather than the silicate rock found on Earth.)
A striking feature of the dunes is that they are longitudinal in form, lining up along the mean transport direction. Such dunes form on Earth when the wind blows in two predominant nonparallel directions; imagine winds along the arms of a Y, with dunes forming along the stem. That convergent wind regime occurs in the Sahara and Arabian deserts on Earth; the most spectacular examples are found in Namibia, where a seasonal change in wind direction forms striking dunes. On Titan, whether the alternating wind regime is due to the gravitational tide or to seasons remains to be determined.
The varying tidal forces due to Titan’s slightly eccentric orbit around massive Saturn give the moon a feature that is unique, at least in our solar system. The gravitational tide produces a 1-millibar pressure bulge in Titan’s atmosphere. As the bulge propagates eastward around the equator once per Titan day, it may be the main driver of near-surface winds. 17 It may also be responsible for some of the layering in Titan’s haze. If tides are indeed responsible for the 0.5–1 m/s winds needed to sculpt dunes, then they may be quite predictable, like Earth’s ocean tides. A future mission that features a balloon might be able to exploit the winds.
The strong tidal pull of Saturn can also produce a tidal depth variation of a meter or two in Titan’s larger lakes, even though the tidal cycle is too slow to cause resonant tides there. Overall, Earth’s ocean tides are much weaker than those on Titan by a factor of 50 in height, but in some locations on Earth resonant basins amplify the tidal range by almost two orders of magnitude.
One of the toughest observations to explain is that the dunes indicate an almost exclusively eastward transport of sand, as pictured in figure
Fortunately, an entirely new window on the angular momentum balance of Titan’s atmosphere has recently opened 18 —Titan’s length of day. As the zonal winds spool up and settle down over the seasons, they must exchange angular momentum with the surface. That slightly changes the rotation rate of the solid surface. Titan is particularly sensitive to the seasonal change in winds for two reasons: First, because Titan’s atmosphere is so massive, it has a lot of angular momentum. Second, like other icy satellites such as Europa, Titan has an ice crust floating above an internal water ocean that largely decouples the crust from the interior. Thus the atmosphere has to torque just the crust around rather than the whole body. That could possibly account for deviations of hundreds of seconds from Titan’s period of 15.945 days.
That remarkably dynamic scenario, anticipated by models, was confirmed last year by radar observations: Identical landmarks seen on flybys made years apart were kilometers from their expected position if Titan’s rotation exactly matched its orbital period around Saturn. The data show that the spin period not only is faster than synchronous by about 0.36 degrees per year but appears to be speeding up.
A new world to discover
Titan is an outstanding laboratory for comparative planetology of atmospheres: Its meridional circulation and transport of volatiles mirror those on Mars; its greenhouse climate, hydrological cycle, and polar stratosphere are like Earth’s; and its zonal wind structure and opacity resemble those on Venus. The torrent of data from Cassini is now outpacing models, which must be explored to explain the wind patterns indicated by dunes and the seasonal changes that we are just beginning to observe. Models can also give us insight into what happens on time scales longer than we can presently observe.
There is much to look forward to learning about this ever-changing planetary body. NASA recently approved a two-year mission extension for Cassini with another 26 flybys. In addition to extending mapping coverage and observations of temporal and spatial variability in the ionosphere, that mission will see Titan through the northern spring equinox in 2009. As the Sun crosses into the northern hemisphere, scientists expect a dramatic change in cloud and circulation patterns. If the 10-year-old Cassini spacecraft continues to perform well, further mission extension may be contemplated. NASA and the European Space Agency are also considering Titan as the destination for a future outer solar-system flagship mission—perhaps with an orbiter remotely mapping the clouds, composition, and winds, and with one or more balloons or landers measuring conditions in situ.
I acknowledge the support of NASA’s Cassini Data Analysis Program. Cassini—Huygens is a joint endeavor of NASA, the European Space Agency, and the Italian Space Agency.
References
1. R. D. Lorenz, J. Mitton, Titan Unveiled: Saturn’s Mysterious Moon Explored, Princeton U. Press, Princeton, NJ (2008);
D. M. Harland, Cassini at Saturn: Huygens Results, Springer, New York (2007);
R. D. Lorenz, J. Mitton, Lifting Titan’s Veil: Exploring the Giant Moon of Saturn, Cambridge U. Press, New York (2002).2. J. I. Lunine, S. K. Atreya, Nat. Geosci. 1, 159 (2008).https://doi.org/10.1038/ngeo125
3. C. P. McKay, J. B. Pollack, R. Courtin, Icarus 80, 23 (1989);https://doi.org/ICRSA5
10.1016/0019-1035(89)90160-7
C. P. McKay, J. B. Pollack, R. Courtin, Science 253, 1118 (1991);https://doi.org/SCIEAS10.1126/science.11538492
R. D. Lorenz, C. P. McKay, J. I. Lunine, Planet. Space Sci. 47, 1503 (1999).https://doi.org/PLSSAE10.1016/S0032-0633(99)00038-0 4. Y. L. Yung, M. A. Allen, J. P. Pinto, Astrophys. J. Suppl. Ser. 55, 465 (1984);https://doi.org/SCIEAS
10.1086/190963
J. I. Lunine, D. J. Stevenson, Y. L. Yung, Science 222, 1229 (1983).https://doi.org/10.1126/science.222.4629.12295. M. G. Tomasko et al., Nature 438, 765 (2005).https://doi.org/NATUAS
10.1038/nature04126 6. R. D. Lorenz, Planet. Space Sci. 41, 647 (1993);https://doi.org/PLSSAE
10.1016/0032-0633(93)90048-7
Science 290, 467 (2000).https://doi.org/SCIEAS10.1126/science.290.5491.467 7. K. E. Trenberth, Climatic Change 39, 667 (1998);https://doi.org/NATUAS
10.1023/A:1005319109110
Climatic Change 42, 327 (1999).https://doi.org/10.1023/A:10054889209358. R. Hueso, A. Sa´nchez-Lavega, Nature 442, 428 (2006);https://doi.org/10.1038/nature04933
E. L. Barth, S. C. R. Rafkin, Geophys. Res. Lett. 34, L03203 (2007).https://doi.org/GPRLAJ10.1029/2006GL028652 9. C. A. Griffith, J. L. Hall, T. R. Geballe, Science 290, 509 (2000);https://doi.org/SCIEAS
10.1126/science.290.5491.509
M. E. Brown, A. H. Bouchez, C. A. Griffith, Nature 420, 795 (2002);https://doi.org/NATUAS10.1038/nature01302
C. C. Porco et al., Nature 434, 159 (2005);https://doi.org/NATUAS10.1038/nature03436
H. G. Roe et al., Science 310, 477 (2005);https://doi.org/SCIEAS10.1126/science.1116760
E. L. Schaller et al., Icarus 184, 517 (2006).https://doi.org/ICRSA510.1016/j.icarus.2006.05.025 10. G. W. Lockwood, D. T. Thompson, Nature 280, 43 (1979);https://doi.org/NATUAS
10.1038/280043a0
L. A. Sromovsky et al., Nature 292, 698 (1981).https://doi.org/NATUAS10.1038/292698a0 11. R. D. Lorenz et al., Icarus 142, 391 (1999).https://doi.org/ICRSA5
10.1006/icar.1999.6225 12. F. M. Flasar, Science 313, 1582 (2006);https://doi.org/SCIEAS
10.1126/science.1130698
R. D. Lorenz, M. T. Lemmon, P. H. Smith, Mon. Not. R. Astron. Soc. 369, 1683 (2006);https://doi.org/MNRAA410.1111/j.1365-2966.2006.10405.x
N. A. Teanby et al., Icarus 186, 364 (2007).https://doi.org/ICRSA510.1016/j.icarus.2006.09.024 13. R. M. Lopes et al., EOS Trans. Am. Geophys. Union 88, 569 (2007);https://doi.org/10.1029/2007EO510001
E. R. Stofan et al., Nature 445, 61 (2007).https://doi.org/NATUAS10.1038/nature05438 14. R. E. Samuelson, N. R. Nath, A. Borysow, Planet. Space Sci. 45, 959 (1997);https://doi.org/PLSSAE
10.1016/S0032-0633(97)00090-1
R. D. Lorenz et al., Geophys. Res. Lett. 28, 415 (2001).https://doi.org/GPRLAJ10.1029/2000GL012336 15. R. D. Lorenz et al., Geophys. Res. Lett. 35, L02206 (2008).https://doi.org/GPRLAJ
10.1029/2007GL032118 16. J. Radebaugh et al., Icarus 194, 690 (2008);https://doi.org/ICRSA5
10.1016/j.icarus.2007.10.015
R. D. Lorenz et al., Science 312, 724 (2006).https://doi.org/SCIEAS10.1126/science.1123257 17. T. Tokano, F. M. Neubauer, Icarus 158, 499 (2002).https://doi.org/ICRSA5
10.1006/icar.2002.6883 18. R. D. Lorenz et al., Science 319, 1649 (2008);https://doi.org/10.1126/science.1151639
T. Tokano, F. Neubauer, Geophys. Res. Lett. 32, L24203 (2005).https://doi.org/GPRLAJ10.1029/2005GL024456
More about the authors
Ralph Lorenz is in the planetary exploration group at the Johns Hopkins University Applied Physics Laboratory in Laurel, Maryland.
Ralph D. Lorenz, Applied Physics Laboratory, Johns Hopkins University, Laurel, Maryland, US .


