Surface-enhanced Raman scattering
DOI: 10.1063/1.2812122
When light interacts with matter, it can scatter in-elastically from vibrational quantum states. During that process, photons may lose energy to, or gain it from, vibrational excitations. A change in the photon energy must produce a concomitant shift in the frequency of the scattered light (see
Raman scattering provides a rich variety of information on the structure and composition of matter, based on its vibrational fingerprints. The vibrational information, which usually occurs at IR frequencies, can be obtained by monitoring the frequency shifts between excitation and scattered light. As a scattering process, however, the Raman effect is exceedingly weak: Typical Raman cross sections per molecule range between 10−30 and 10−25 cm2, with the larger values occurring during resonant Raman conditions, when the frequency of light happens to match an electronic transition in the molecule. By comparison, fluorescence spectroscopy, based on the absorption and emission of light, exploits effective cross sections between 10−17 cm2 and 10−16 cm2.
The advent of the laser as an intense and monochromatic source of excitation light was a milestone in the history of Raman spectroscopy and dramatically improved scattering signals. Still, spectroscopists remained hampered by small signal intensities, particularly from surfaces where the number of molecules that produce a Raman effect is small.
That research environment helps explain spectroscopists’ interest in another observation, made nearly 50 years after the discovery of the Raman effect. In 1974 Martin Fleischmann and coworkers reported an unexpectedly strong Raman signal from a monolayer of pyridine adsorbed on an electrochemically roughened silver electrode. 3 They explained the signal strength as the result of a large number of molecules from the increased surface area on the rough electrode. In 1977 Richard Van Duyne, his graduate student David Jeanmaire, and, independently, M. G. Albrecht and Alan Creighton confirmed the result—a Raman enhancement of about a million—compared with the signal from pyridine molecules in the absence of metal. And they concluded that so strong a signal cannot be explained by an increase in surface area alone: A genuine enhancement in the Raman scattering efficiency must have been responsible. 4,5
Shortly thereafter, researchers realized that the excitation of surface plasmons in the metal were largely behind the result and could explain the enhanced Raman signals. In the 30 years since its discovery and confirmation, surface-enhanced Raman scattering (SERS) has matured into a powerful spectroscopic method that exploits the interaction of light, molecules, and metal nanostructures to boost Raman signals high enough—in some cases up to 14 orders of magnitude—that researchers can resolve the chemical structure of materials, even at the single-molecule level. Moreover, SERS has contributed to the development of plasmonics and the related field of near-field optics, which are revolutionizing optics and spectroscopy.
The Raman effect
The inelastic scattering of photons from matter can be illustrated in a molecular-energy diagram. Depending on whether incident photons interact with a molecule in its vibrational ground or first-excited state (n = 0 or 1), the Raman-scattering (RS) signal appears shifted to lower or higher energies than the excitation energy hν L. Light shifted lower is said to be Stokes scattered and has energy hν S = hν L – hν M; light shifted higher is called anti-Stokes scattered and has energy hν aS = hν L + hν M, where hν M is the molecule’s vibrational energy.
The Raman-scattering power P RS depends on the light’s excitation intensity I L, the number N of molecules in the probed volume, and the Raman cross section σ R, which is determined by the molecule’s polarizability. In general, the signal from an anti-Stokes Raman process is far less intense than that produced by Stokes scattering because only a small fraction of molecules, determined by a Boltzmann population distribution, are in an excited vibrational state.
In hyper-Raman scattering (HRS), two photons are simultaneously scattered from a molecule. The energies of the accompanying Raman signals are thus shifted relative to twice the energy of the excitation laser: hν HS = 2hν L – hν M and hν HaS = 2hν L + hν M; the subscripts HS and HaS refer to hyper-Raman Stokes and anti-Stokes photons. Because two-photon HRS follows different symmetry selection rules than one-photon RS, the spectral information obtained in each can be complementary. What’s more, the power of RS signals P RS depends linearly on the laser’s excitation intensity, whereas HRS signals depend on the square of the intensity.

Enhancement mechanisms
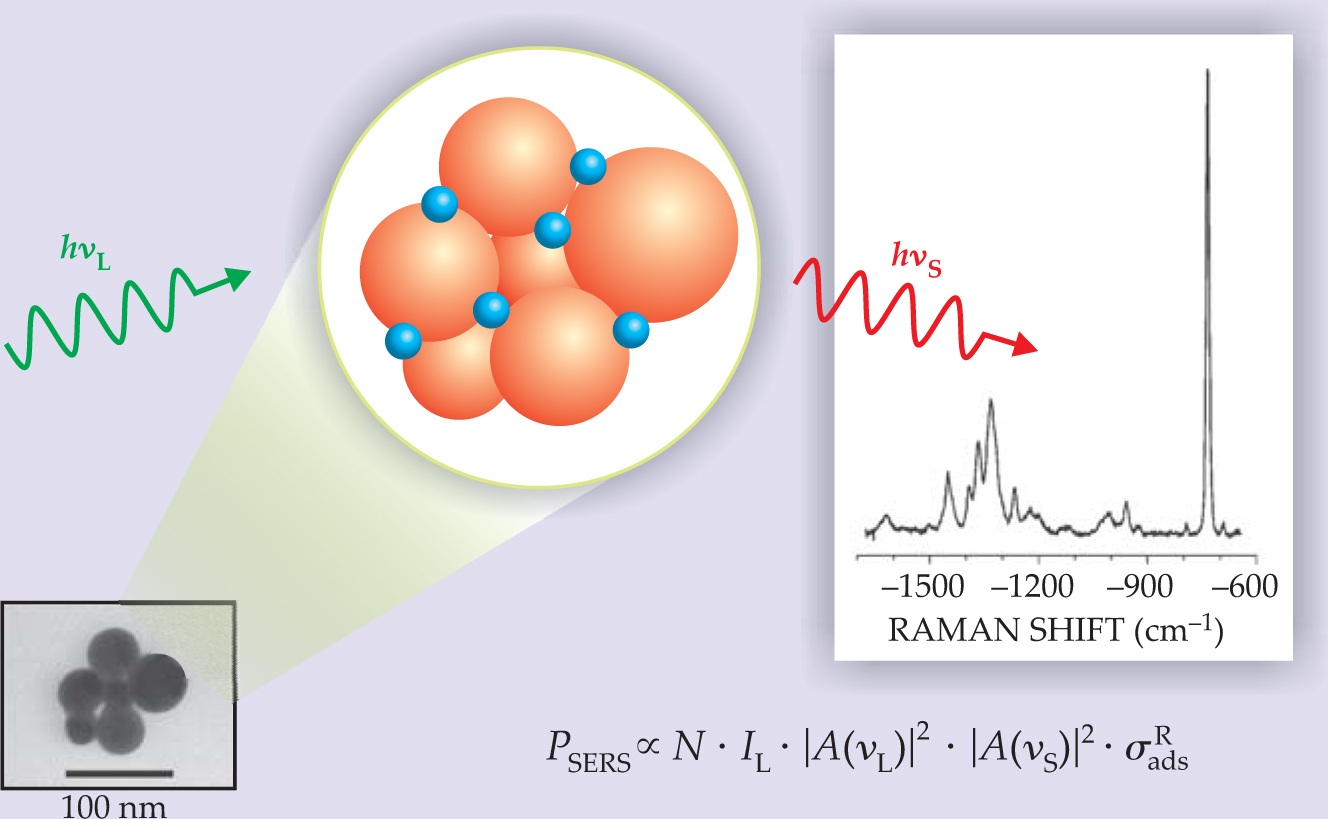
Figure 1 illustrates the SERS process. One can envision enhanced Raman scattering from molecules on metal as arising in two ways. An increased Raman signal appears due to a magnification of both incident and Raman-scattered fields, an effect known as electromagnetic enhancement. Moreover, the electronic interaction between molecule and metal can modify the scattering process itself and produce an effectively larger cross section than would occur by scattering light from the molecule alone, an effect known as electronic or chemical SERS. The total enhancement is a product of the two mechanisms. Here we take each in turn.

Figure 1. Surface-enhanced Raman scattering. Molecules (blue) are adsorbed onto metal nanoparticles (orange) either in suspension or on a surface. As in ordinary Raman scattering, the SERS spectrum reveals molecular-vibration energies based on the frequency shift between incident (green) and scattered (red) laser light. The power PSERS of the Raman signal depends on the number N of molecules involved in the process, the laser’s intensity I L, the effective Raman cross section of the adsorbed molecule σ ads R, and enhancement factors |A(ν L)|2 and |A(ν S)|2, which quantify the magnification of laser-excitation and scattered fields, respectively. The spectrum comes from 10−9 mol/L of adenine on silver nanoclusters.
In the vicinity of metal nanoclusters, field enhancement occurs because of the resonant interaction between the optical fields and surface plasmons in the metal (see
The enhancement depends on the type of metal, its degree of roughness—the sizes and shapes of the clusters that form—and the frequency of the incident light. The original observation of SERS, in fact, was a fortunate accident that occurred because the laser frequency happened to fall in the plasmon resonance of nanometer-sized bumps on the rough silver electrodes.
SERS enhancement is particularly strong when both laser and scattered fields are in resonance with the surface plasmons. The frequency shift between the laser and scattered light is usually small compared with the width of the plasmon resonance. Therefore, the laser and Raman-scattered fields increase by about the same amount, and the signal power scales roughly with the fourth power of the local optical-field enhancement.
The very simple model of a molecule near a metal sphere outlined in
But electromagnetics is not the whole story. Early researchers noticed a dependence of the scattering signal on electrode potential, which suggested electronic coupling of molecule and metal. Indeed, the presence of metal in the system may alter the polarizability of adsorbed molecules, for example, and increase the Raman-scattering efficiency. Electronic SERS enhancement can also occur due to new resonant Raman effects that occur from the presence of metal: Electronic levels in the adsorbed molecule become shifted or broadened or new ones appear because of charge transfer between molecule and metal.
An interesting electronic model is one based on ballistic electrons and holes that are excited in the metal and couple to orbitals in the molecule. According to the model, discussed since the early days of SERS, 7 the heightened SERS signal is the result of inelastic tunneling of the ballistic electrons to the lowest unoccupied molecular orbital of the chemisorbed molecule. The return of the electron to its initial state in the metal—that is, the recombination of electron and hole—emits a Raman-shifted photon.
The charge-transfer process could explain the differences in SERS-enhancement factors for different molecules and the dependence of the SERS enhancement on the electrode potential. For a deeper discussion on SERS-enhancement mechanisms and an overview on the early days of SERS, see references .
The role of surface plasmons
For their effect, enhanced Raman signals rely on the same phenomena as stained-glass windows in old cathedrals: the resonant excitation of surface plasmons in metal nanostructures. Imagine a small silver sphere with dimensions smaller than the wavelength of incident light. Under the influence of the light’s time-varying electric field E 0, the collective movement of free electrons in the metal against the restoring force of the ionic cores produces an oscillating electron density—a localized surface plasmon. The plasmon absorption band of isolated small silver spheres, pictured here, occurs around 400 nm.
When the laser light is resonant with the surface plasmon, the metal sphere radiates its own dipolar field E SP. The magnitude of that field at a nearby molecule depends on the sphere’s radius r, its distance d from the molecule, the metal’s dielectric constant ε, and the incident field strength E 0:
So the molecule feels an enhanced local field E M, the sum of the electric-field magnitudes, E 0 + E SP. The field enhancement A( ν ) at the molecule is determined by the ratio of the field amplitudes E M/E 0.
The electromagnetic SERS enhancement factor G SERS EM is determined by the product of the individual enhancement factors |A( ν L)|2 and |A( ν S)|2 for the laser and Raman-scattered fields, respectively. G SERS EM is particularly strong when the real part of ε( ν ) is equal to –2ε0, the condition for resonant excitation of surface plasmons in the metal sphere, and when the imaginary part of ε( ν ) is small.

Sizing things up
An interesting question is, What is the size of the total SERS enhancement factor? The earliest experiments reported modest enhancement factors of 104 to 106, but later ones performed on dyes reported enhancements of 1010 to 1011 by taking into account resonant Raman scattering in the molecule as well as electromagnetic and electronic effects. However, researchers had assumed—incorrectly it turns out—that all molecules in a SERS experiment contribute to the observed signal. As a result, they underestimated the enhancement factors.
This year a new approach, based on optical pumping of vibrational levels using an extremely strong spontaneous Raman process, addressed that issue. The experiments found unexpectedly large SERS cross sections per molecule, on the order of at least 10−16 cm2. Compared to typical non-resonant Raman cross sections (about 10−30 cm2), such cross sections, inferred for NIR excitation that was not in resonance with electronic transitions in the molecule, imply SERS-enhancement factors of about 14 orders of magnitude. The studies also showed that a very small fraction of the molecules present in the probed volume are actually involved in the SERS process at such a high enhancement level. 10
Electromagnetic and electronic effects could account for the observed 1014 enhancement measured in the vibrational-pumping studies. Interestingly, so large an enhancement is always related to the metal nanostructures’ specific morphologies, such as interstitial junctions between silver or gold particles and fractal structures that can form. 9–12 And experimental observations provide evidence that the electromagnetic contribution alone accounts for the bulk of the enhancement. Theoretical estimates corroborate that assessment. For example, Mark Stockman (Georgia State University) and coworkers argue that a “self-similar” system made from nanospheres of different sizes arranged in a chain acts as a lens to magnify the signal: The SERS enhancement increases along the chain, from bigger spheres to smaller ones, reaching a maximum in the gaps between the smallest spheres. 12 George Schatz (Northwestern University) and coworkers have shown that enhancement factors of almost 1014 can also result from the combination of plasmon excitations and long-range photonic interactions. 13 But still other studies rely on electronic charge-transfer mechanisms to explain extremely large enhancements, so the extent of the relative contribution to SERS from electromagnetic and electronic effects remains an area of active investigation.
Single-molecule spectroscopy
For a Raman cross section of 10−29 cm2, large numbers of molecules are required to convert enough laser photons to Raman photons to achieve a usable signal. From 100 mW laser light focused to 1 μm2, a single molecule scatters only 10−4 photons per second. That means one would have to wait more than an hour for a single Raman photon. Before the advent of SERS, such estimates made single-molecule Raman spectroscopy science fiction.
By virtue of the extremely high enhancement factors obtainable in SERS, however, one can get insight into an individual molecule’s intrinsic vibrational properties and monitor its structural changes without resorting to ensemble averages. Indeed, the structure-sensitive detection of single molecules represents the ultimate limit in chemical analysis. 10,14
figure 2 illustrates a single-molecule SERS experiment on silver nanoclusters dispersed in solution. Brownian motion of the silver clusters drives single target molecules into and out of the scattering volume. Evidence for single-molecule detection comes from a statistical analysis of the Raman signals. When the average number of target molecules in the scattering volume approaches one or fewer, the normally Gaussian distribution of Raman intensities, which is characteristic of scattering from many molecules, changes to a Poisson distribution.

Figure 2. Single-molecule SERS. (a) A microscope attachment is used to focus near-IR laser light on a small volume of solution containing silver nanoclusters and attached target molecules (crystal violet dye) and channel the Raman-scattered light to a spectrometer. At concentrations around 10−14 mol/L, the molecules are dilute enough to ensure that, on average, no more than one molecule is in the focus volume at a time. The concentration, roughly 1/100 the concentration of the metal aggregates, means that statistically one out of 100 nanoclusters carries a single target molecule. (b) SERS spectra show the result of 100 separate measurements, one per second. (c) A statistical analysis of the Raman signals from one characteristic mode (at 1174 cm−1) indicates that the signals follow a Poisson distribution. The plot reflects the probability of finding 0, 1, 2, or 3 molecules in the probed volume during the actual measurement.
(Adapted from ref. 10, 1997.)
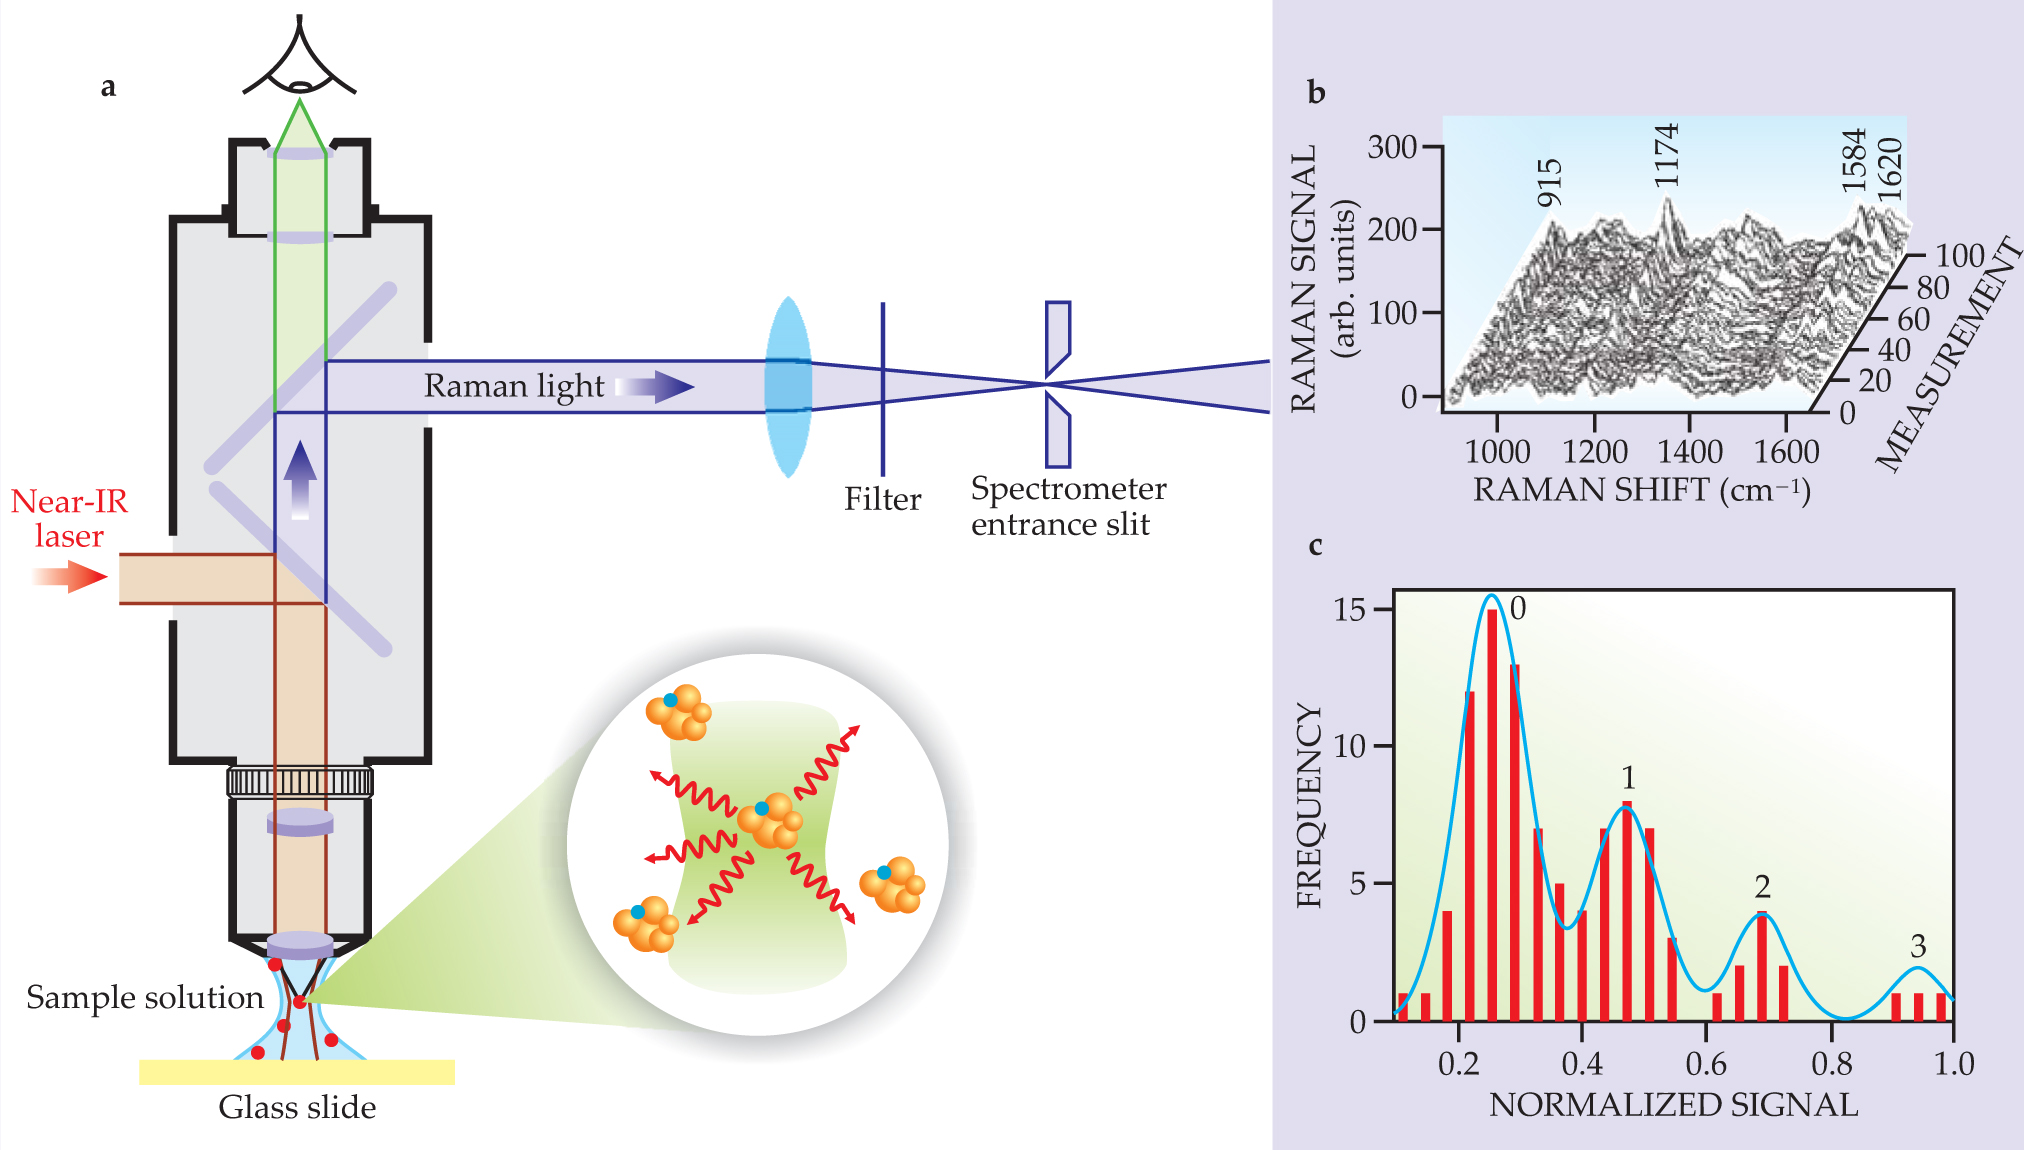
Poisson statistics imply relatively uniform enhancement factors for all target molecules. Therefore, a Poisson distribution in the SERS signal intensities can be observed only in systems whose molecule–metal interactions are fairly uniform. That can be achieved in a system whose concentration of target molecules is much less than the concentration of enhancing nanoclusters. Each molecule can then find the “hottest” spot—the region that experiences the greatest field enhancement—on its own silver cluster. Experiments show that the hottest spots have dimensions below 2 nm. Exactly how single molecules are directed to those spots is one of the key questions in single-molecule SERS.
SERS spectra collected over time can exhibit fluctuations in signal strength along with spectral changes such as the emergence of new Raman lines, sometimes even unrelated to the target molecule. Those temporal fluctuations in scattering power or sudden spectral changes—both referred to as “blinking” in the literature—are not necessarily a signature of single-molecule detection, as is sometimes claimed. Rather, the fluctuations are inherently related to low-concentration “many-molecule” SERS. Different effects may account for the blinking, such as thermally and nonthermally activated diffusion of molecules into and out of hot areas, the trapping and release of molecules in high-field gradients, and genuine structural transformations that sometimes occur in the target molecule.
Trace analysis and biological probes
Although Raman shifts, relative peak intensities, and linewidths in SERS may differ slightly from those found in normal Raman spectra because of electronic interactions between molecule and metal and because of selection rules that are altered due to field gradients, a SERS spectrum allows researchers to establish the identity of molecules in extremely small quantities. The size of the probed volume is determined by the confinement of the local optical field, which can be two orders of magnitude smaller than half the wavelength of light, the limit achievable in a confocal setup in normal spectroscopy.
That ultrafine detection capability makes SERS especially appealing in biophysical and biomedical spectroscopy. Let’s imagine you’d like to detect a particularly elusive biological molecule that exhibits a weak spectroscopic signal. One approach is to apply a SERS label to the molecule. The label, comprising silver or gold particles with a “reporter” molecule attached, effectively acts as a pointer: It reveals the biomolecule through the spectroscopic signature of the reporter molecule.
Compared with conventional fluorescence labels, SERS labels offer several advantages. They provide distinct spectral signatures even for similar reporter molecules. And because SERS can take place at excitation frequencies that are nonresonant with electronic levels of the molecule of interest, all SERS labels can be excited with the same laser frequency. That means that a variety of labels might be used to identify many different biomolecules, such as different strands of DNA, all at the same time. 15
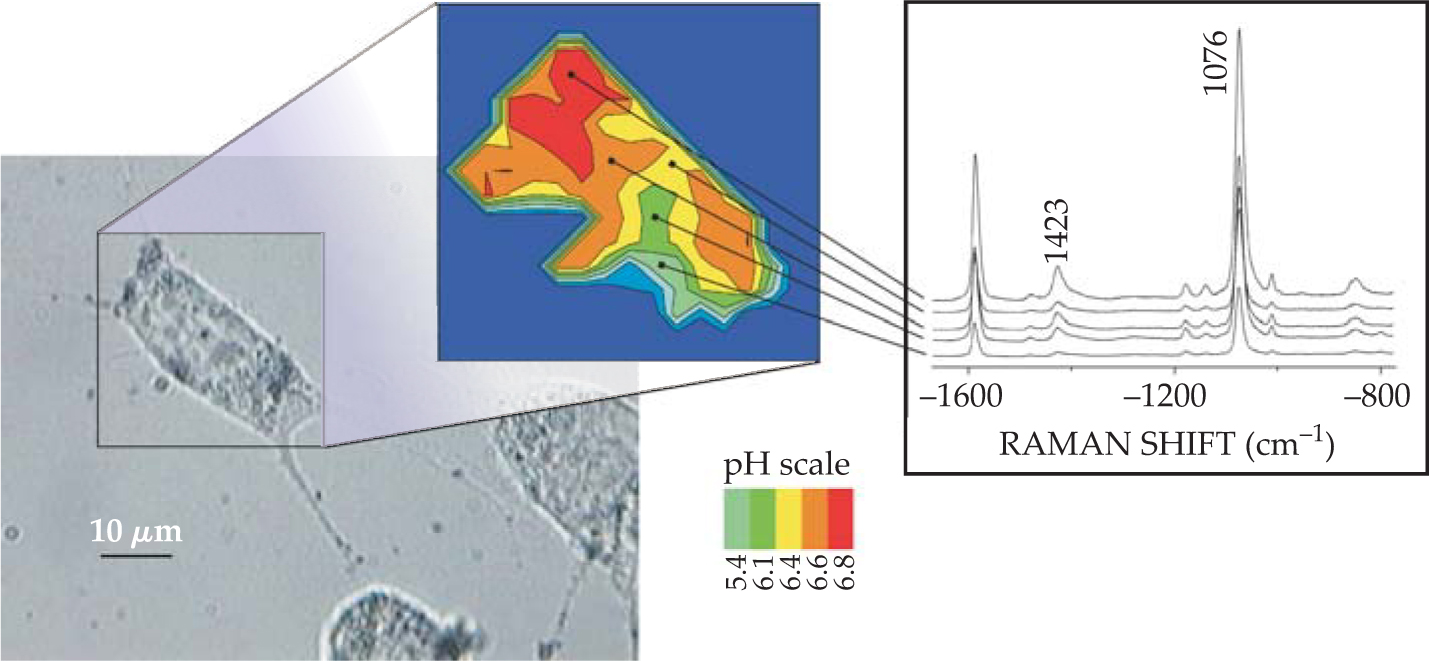
Another application exploits gold nanoparticles as biocompatible nanosensors that can be placed inside small structures such as live cells. The mobile sensors can probe the chemistry taking place in different parts of the cell by revealing enhanced Raman spectra of cellular molecules in their own environment. Moreover, gold or silver nanoclusters, with attached reporter molecules that exhibit a well-known and calibrated pH-dependent SERS signature, can be used to probe the pH levels in cells. figure 3 depicts the idea, with the pH levels inferred from the relative signals of pairs of Raman lines in the same spectrum. 16 The approach allows direct quantitative measurements and avoids the need to account for any correction in background absorption, scattering, and emission.

Figure 3. Probing and imaging a live cell filled with gold nanoparticles. Surface-enhanced Raman scattering measures the pH-sensitive spectrum of 4-mercaptobenzoic acid on the gold particles. The relative intensity ratios of the Raman lines at 1423 cm−1 and 1076 cm−1 can be calibrated to the pH levels to map them out in different cellular compartments. Each spectrum was collected in 1 second using 3-mW, 830-nm continuous-wave laser excitation.
(Adapted from ref. 16.)
Particularly challenging is the application of SERS to complex living systems and medical problems. Cellular and in vivo environments are awash in stray molecules and possibly contaminants that can interfere with the signal. To compound the difficulty, the concentrations of all the molecules, including those of interest, may be in flux. Figure 4 illustrates the basic concept behind the first in vivo application of SERS—an experiment designed by Van Duyne and colleagues from Northwestern University in 2006 to measure glucose concentrations inside an animal’s body. 17 The group prepared a sensor made up of a self-assembled monolayer of silver clusters to ensure uniform and strong average enhancement. The SERS-active sensor was then subcutaneously placed in a rat in such a way that the glucose concentration of the interstitial fluid could be measured spectroscopically through an optical window in front of the sensor.

Figure 4. Sensing glucose concentrations in vivo. (a) A rat with a surgically implanted sensor made from a monolayer of silver nanoclusters is integrated into a conventional Raman-spectroscopy system. Glucose molecules can quickly adsorb and desorb on the prepared surface. (b) As glucose is intraveneously injected into the rat intermittently over three hours, researchers plot glucose concentration measured using the implanted SERS sensor (blue), along with measurements made with a commercial blood-glucose meter (green). The inset shows a typical in vivo spectrum, compared with an ex vivo aqueous spectrum of the same surface.
(Adapted from ref. 17.)
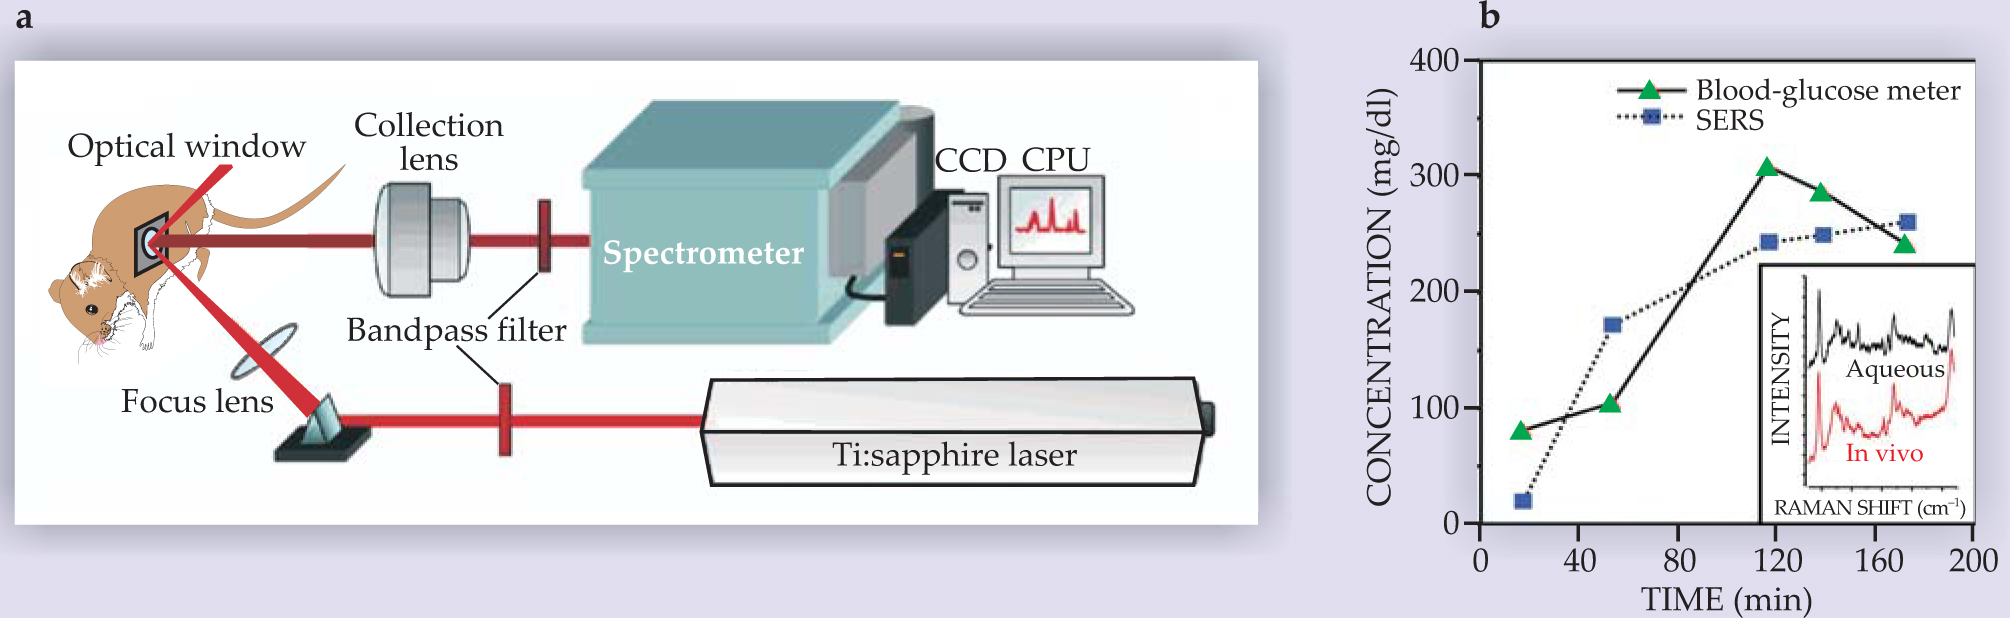
In the Northwestern experiment, glucose was found to bind reversibly to the sensor’s surface, and changes in its concentration could be measured as quickly as every 30 seconds. The hope is that SERS sensors designed for other specific target molecules might find similar applications in fundamental research and the treatment and care of diabetics.
Scanning-probe tips and two-photon methods
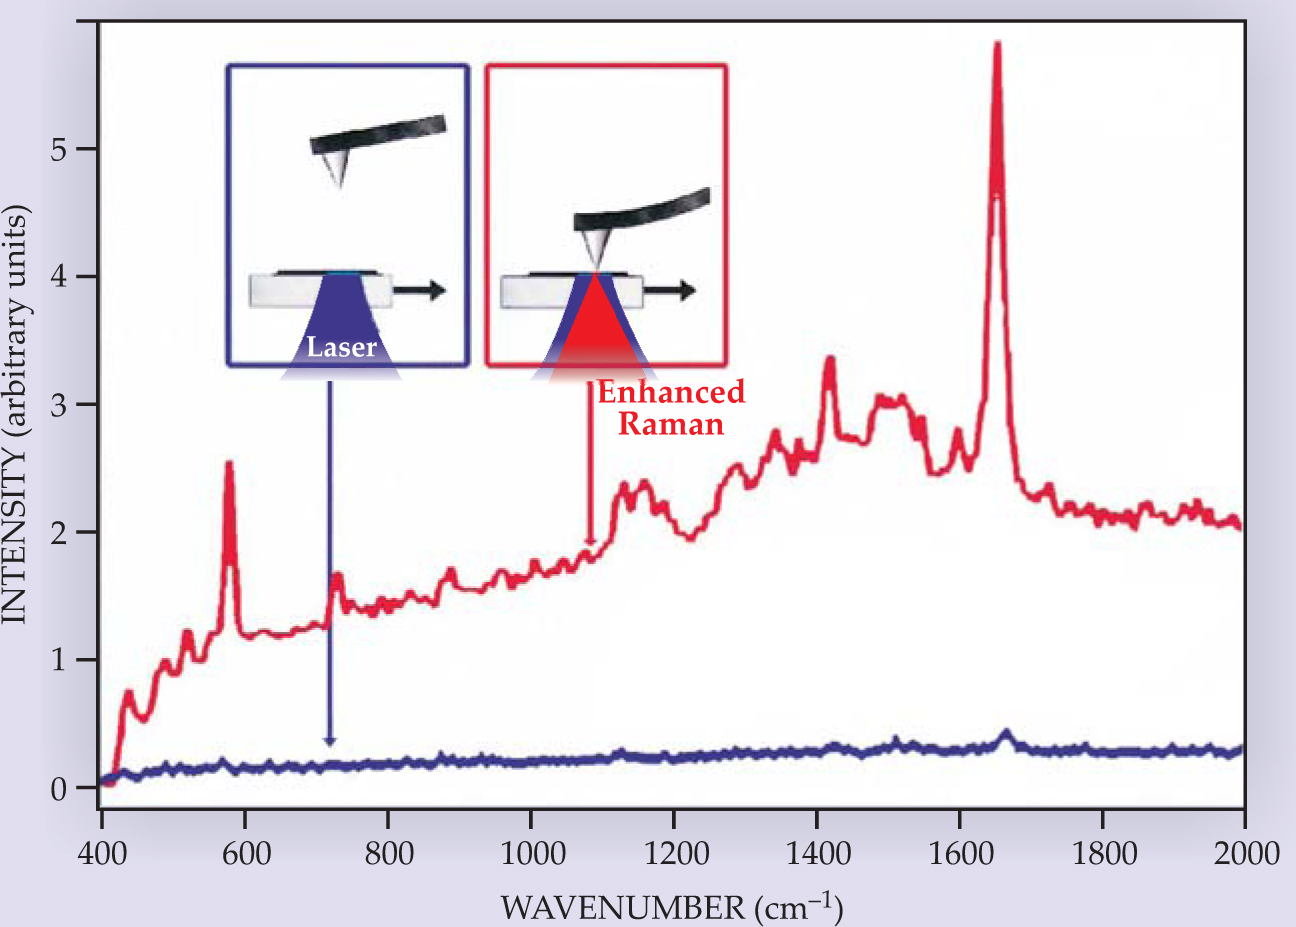
The strong field enhancement and local confinement of the SERS effect open up exciting new capabilities that are pushing spectroscopic methods to new limits. One of those methods, tip-enhanced Raman spectroscopy (TERS), combines highly confined probe volumes with scanning-probe microscopy. 18 A fine metal tip, brought within a few nanometers of the surface of a molecular film, say, strongly enhances the Raman-scattered signal from the film (see figure 5). In addition to the enhanced Raman signal at nanoscale resolution, the scanning tip also provides complementary topographic information of the sample.

Figure 5. Tip-enhanced Raman spectroscopy. Two Raman spectra of brilliant cresyl blue dye molecules dispersed on a glass are pictured here. One (blue) is made as a silver-coated atomic-force-microscope tip hovers well away from the surface, and the other (red) is made with the metal tip nanometers from the surface. Raman excitation and the collection of scattered light are performed from below the glass. The presence of the metal tip near the sample surface greatly enhances the Raman signal.
(Adapted from ref. 18, R. M. Stöckle et al.)
To date, the best enhancement factors obtained from a tip are 3 to 7 orders of magnitude. Most sensitive applications of TERS are therefore possible in combination with a strong, resonant Raman process. That is the case, for example, in experiments on individual single-wall carbon nanotubes, which exhibit an extremely strong Raman effect when the light is resonant with their sharp electronic levels. Researchers led by Sunney Xie (Harvard University) and Lukas Novotny (University of Rochester) measured TERS spectra from individual single-wall nanotubes and simultaneously imaged the nanotubes’ spatial contours. 18 The dual measurements allowed them to correlate several vibrational modes with the corresponding topographic profile to identify local structural variations along the nanotubes.
Other methods that are gaining interest among researchers include two-photon techniques. By using two lower-energy photons during the scattering process, light can be shifted to longer wavelengths than is possible during one-photon scattering. The lower-energy incident photons penetrate many materials more deeply and simultaneously reduce the degradation of light-sensitive samples. So far, most two-photon applications are based on fluorescence. Hyper-Raman scattering (HRS), outlined in box 1, is a potential tool for probing the chemistry of materials using two-photon scattering.
As an incoherent process, however, HRS is extremely weak, with scattering cross sections on the order of 10−65 cm4·s, some 35 orders of magnitude smaller than those of ordinary one-photon-excited Raman scattering and 15 orders of magnitude below typical two-photon absorption cross sections. So far, the extremely small hyper-Raman cross sections have precluded application of HRS as a practical spectroscopic tool. Because of its nonlinear dependence on the enhanced excitation field, however, HRS benefits from high local fields much more than does one-photon scattering. The extremely strong electromagnetic enhancement that accompanies HRS raises its effective cross section to about 10−45 cm4·s, higher than the highest cross sections ever obtained from two-photon fluorescence.
That effective cross section suggests that researchers can use versatile surface-enhanced hyper-Raman-scattering (SEHRS) labels for certain applications. Moreover, the effect may provide the capability to run ultrasensitive and nondestructive vibrational analyses of a sample based on two-photon excitation. 16
Yet another challenge to SERS is how to precisely quantify and control the enhancement effect. The highest experimentally obtained enhancement factors have come from structures made of silver and gold nanoparticles that aggregate naturally and occasionally form fractal surfaces. As nanotechnology matures, researchers may design and build surface structures with properties that optimize the various contributions to the enhancement. That would involve designing features not just at the 10- to 100-nm scale, which affects the electromagnetic response of a structure, but also at the atomic scale, where the electronic interactions between molecule and metal occur.
But one could go further yet. The SERS concept is not restricted to metals, so researchers may even envision synthetic materials, for instance, that contain a high density of free carriers and atomic-scale active sites that favor charge-transfer processes.
References
1. C. V. Raman, K. S. Krishnan, Nature 121, 501 (1928). https://doi.org/10.1038/121501c0
2. G. Landsberg, L. Mandelstam, Naturwissenschaften 16, 557 (1928). https://doi.org/10.1007/BF01506807
3. M. Fleischmann, P. J. Hendra, A. J. McQuillan, Chem. Phys. Lett. 26, 163 (1974). https://doi.org/10.1016/0009-2614(74)85388-1
4. D. L. Jeanmaire, R. P. Van Duyne, J. Electroanal. Chem. 84, 1 (1977). https://doi.org/10.1016/S0022-0728(77)80224-6
5. M. G. Albrecht, J. A. Creighton, J. Am. Chem. Soc. 99, 5215 (1977). https://doi.org/10.1021/ja00457a071
6. M. Kerker, Appl. Opt. 30, 4699 (1991). https://doi.org/10.1364/AO.30.004699
7. A. Otto, in Light Scattering in Solids IV: Electronic Scattering, Spin Effects, SERS and Morphic Effects, vol. 54, M. Cardona, G. Guntherodt, eds., Springer, Berlin, Germany (1984), p. 289.
8. A. M. Michaels, J. Jiang, L. Brus, J. Phys. Chem. B 104, 11965 (2000). https://doi.org/10.1021/jp0025476
9. M. Moskovits, Rev. Mod. Phys. 57, 783 (1985). https://doi.org/10.1103/RevModPhys.57.783
10. K. Kneipp, Y. Wang, H. Kneipp, I. Itzkan, R. R. Dasari, M. S. Feld, Phys. Rev. Lett. 76, 2444 (1996); https://doi.org/10.1103/PhysRevLett.76.2444
K. Kneipp, Y. Wang, H. Kneipp, L. T. Perelman, I. Itzkan, R. R. Dasari, M. S. Feld, Phys. Rev. Lett. 78, 1667 (1997). https://doi.org/10.1103/PhysRevLett.78.166711. M. I. Stockman, V. M. Shalaev, M. Moskovits, R. Botet, T. F. George, Phys. Rev. B 46, 2821 (1992). https://doi.org/10.1103/PhysRevB.46.2821
12. K. Li, M. I. Stockman, D. J. Bergman, Phys. Rev. Lett. 91, 227402 (2003). https://doi.org/10.1103/PhysRevLett.91.227402
13. S. Zou, G. C. Schatz, Chem. Phys. Lett. 403, 62 (2005). https://doi.org/10.1016/j.cplett.2004.12.107
14. S. Nie, S. R. Emory, Science 275, 1102 (1997). https://doi.org/10.1126/science.275.5303.1102
15. Y. C. Cao, R. Jin, C. A. Mirkin, Science 297, 1536 (2002). https://doi.org/10.1126/science.297.5586.1536
16. J. Kneipp, H. Kneipp, B. Wittig, K. Kneipp, Nano Lett. 7, 2819 (2007). https://doi.org/10.1021/nl071418z
17. D. A. Stuart, J. M. Yuen, N. Shah, O. Lyandres, C. R. Yonzon, M. R. Glucksberg, J. T. Walsh, R. P. Van Duyne, Anal. Chem. 78, 7211 (2006). https://doi.org/10.1021/ac061238u
18. R. M. Stöckle, Y. D. Suh, V. Deckert, R. Zenobi, Chem. Phys. Lett. 318, 131 (2000);
A. Hartschuh, E. J. Sánchez, X. S. Xie, L. Novotny, Phys. Rev. Lett. 90, 095503 (2003). https://doi.org/10.1103/PhysRevLett.90.095503
More about the authors
Katrin Kneipp is an associate professor at the Wellman Center for Photomedicine at Harvard University Medical School in Boston and the Harvard-MIT Division of Health Sciences and Technology in Cambridge.
Katrin Kneipp, Wellman Center for Photomedicine, Harvard University Medical School, Boston, US .


