Solar eruptive events
DOI: 10.1063/PT.3.1520
Solar flares have been phenomena of both academic and practical interest since their discovery in 1859. From the academic point of view, they are the nearest events for studying the explosive release of energy in astrophysical magnetized plasmas. From the practical point of view, they have been associated with the disruption of communication channels on Earth, from telegraph communications in 1859 to radio and television signals today. More generally, solar eruptive events can wreak havoc on the electrical power grid, satellite operations, and GPS signals, and energetic charged particles and radiation are dangerous to passengers on high-altitude polar flights and to astronauts.
Flares are not the only explosive phenomena on the Sun. More difficult to observe but equally energetic are the large coronal mass ejections (CMEs), ejections of up to 10 billion tons of magnetized plasma into the solar wind at speeds that can exceed 1000 km/s. CMEs are primarily observed from the side, with coronagraphs that block out the bright disk of the Sun so that light scattered from the ejected mass can be seen. Major geomagnetic storms and technological damage are now known to arise from the interaction of CMEs with Earth’s magnetosphere.
Solar flares can be observed without CMEs, and CMEs can be observed without flares. The two phenomena often occur together, however, and almost always do in the case of large flares and fast CMEs. The term “solar eruptive event” refers to the combination of a flare and a CME.
Solar eruptive events generate a lot of heat: They can heat plasma to temperatures as high as 5 × 10⁷ K and produce radiation across the electromagnetic spectrum. But that’s not all. A fascinating aspect of solar eruptive events is the acceleration of electrons and ions to suprathermal—often relativistic—energies. The accelerated particles are primarily observed through their emissions at radio frequencies and in the higher-energy x-ray and gamma-ray regimes. The radio and x-ray emissions are both from mildly relativistic electrons with energies of tens of keV and above. Gamma-ray line emission comes indirectly from accelerated protons and heavier ions with MeV and higher energies. The difficulty in collecting spatially and spectrally resolved x-ray and gamma-ray data has long been a barrier to learning about the accelerated particles.
Considerable progress has been made in the past decade in understanding the relationship between the flare, the CME, energy release, and particle acceleration. But many new questions have also arisen. In this article, I describe those new insights and our evolving understanding of solar eruptive events.
Reconnection and the standard model
The energy for solar eruptive events is thought to be supplied primarily by magnetic energy that builds up in the corona. 1 , 2 However, classical Ohm’s law heating by currents associated with the coronal magnetic field cannot dissipate enough energy on the required time scales. In the late 1940s through the 1960s, solar physicists developed the fundamental concepts of a different mechanism called magnetic reconnection. As shown in figure 1, when two oppositely directed magnetic field components interact, the field lines’ topology changes as the lines break and reconnect, with physical consequences for the charged particles in orbit around the field lines. The inflowing magnetic fields induce the formation of a thin current sheet, which allows reconnection to occur.

Figure 1. Magnetic reconnection and the standard model for solar eruptive events. (a) In magnetic reconnection, oppositely directed magnetic field lines (blue) flow inward and reconnect, releasing much of their magnetic energy to the ambient plasma. The reconnected field lines (green) flow outward, and their associated plasma is ejected in reconnection jets. In the reconnection region (gray), a sheet of current flows perpen-dicular to the plane of the page. (b) In a solar eruptive event, reconnection occurs in an arcade of loops rising above the visible surface of the Sun. (c) Because of shearing of the original arcade, the loops generally reconnect with their neighbors, not with themselves. A twisted magnetic flux rope forms and expands upward to become a coronal mass ejection.
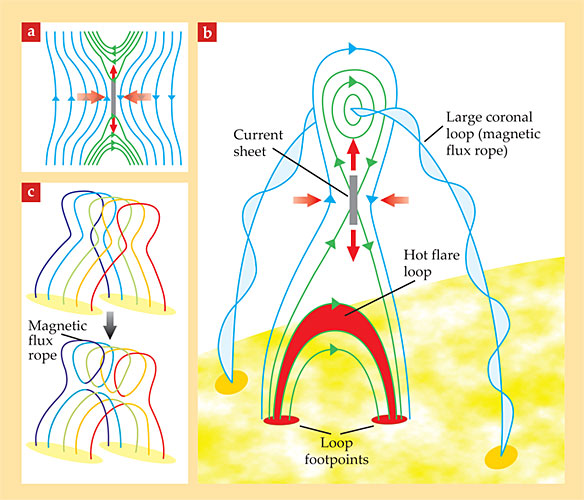
Most of the original magnetic energy is converted to various forms of kinetic energy. (See the article by Forrest Mozer and Philip Pritchett, PHYSICS TODAY, June 2010, page 34 .) Much of that energy is thermal. Some goes into accelerating the suprathermal particles. Also, the newly reconnected magnetic field and associated plasma are ejected from the two ends of the current sheet as so-called reconnection jets. Conditions in the solar corona mean that reconnection-jet speeds are on the order of 1000 km/s.
Two fundamental models for magnetic reconnection emerged. 1 In the Sweet–Parker model, the current sheet in which reconnection occurs is arbitrarily long and wide, whereas its thickness is constrained. In the Petschek model, the current sheet length is on the order of its thickness, and most of the energy is released in two slow shock waves emanating from the ends of the current sheet. Energy conversion is much faster in the Petschek model than in the Sweet–Parker model, so the two are also called “fast reconnection” and “slow reconnection.” At first, they were regarded as competing theories, but we now have evidence that both fast and slow reconnection can occur—even in the same solar eruptive event.
Unfortunately, in both models, the thickness of the current sheet is orders of magnitude too small to be resolved by any existing or planned solar imager. But the consequences of magnetic reconnection can be detected on larger scales. Solar-flare observations in the 1960s and 1970s led to the development of a standard model for solar eruptive events. According to that model, sketched in figure 1b, reconnection occurs in a vertical current sheet in the corona, the outer solar atmosphere where the temperature is normally about 106 K. The newly reconnected magnetic field ejected downward builds up an arcade of loops below the current sheet, and the field ejected upward builds up a magnetic flux rope, as shown in figure 1, that erupts to form the CME.
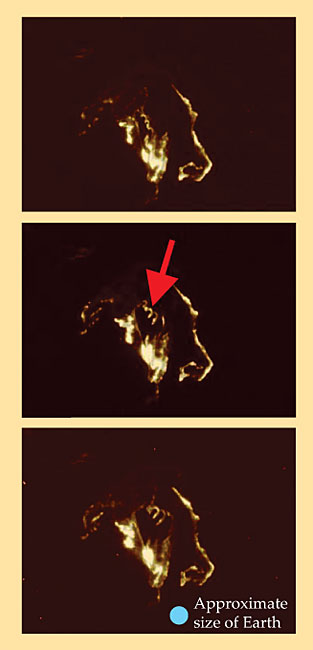
But the observations from which the standard model was developed showed only part of the picture. They focused mainly on the arcade of heated magnetic loops with roughly parallel ribbons of emission at their footpoints (depicted in figure 1). The hot loops appear to expand upward and the ribbons separate with time, consistent with the buildup of magnetic loops as reconnection proceeds. There was no direct evidence for the vertical current sheet. Only recently have observations revealed the expanding magnetic flux rope, 3 as shown in figure 2.

Figure 2. The magnetic flux rope, indicated by the red arrow, is visible in three consecutive images of a solar flare, taken on 15 July 2002 by the Transition Region and Coronal Explorer. (Adapted from ref.
Heat, light, and electrons
X-ray and gamma-ray emissions are produced in the interaction of accelerated particles with ions in the ambient thermal plasma. Therefore, they primarily originate from low in the solar atmosphere, where the plasma density is high. The accelerated particles must stream downward from the reconnection region in the corona, spiraling around the magnetic field lines of the newly reconnected loops toward the photosphere, the visible surface of the Sun. Collisions with ambient electrons and ions extract energy from the accelerated particles, thermalizing the particles and heating the plasma along the loops. Still, the prevalent understanding of plasma physics indicated that most of the heat of the flare must be imparted to the plasma directly, not via the accelerated particles.
But in the 1980s, results from NASA’s Solar Maximum Mission (SMM) established that the rate of increase of radiation from heated plasma was typically proportional to the x-ray flux from accelerated electrons. That is, the accelerated electrons are responsible for much, if not all, of the heating of flare plasma. But that implies (as some earlier results had suggested) that most of the energy released during magnetic reconnection goes into accelerated electrons.
Many other intriguing results came from SMM. The accelerated electrons typically lose most of their energy in the chromosphere, the layer of the solar atmosphere below the corona and just above the photosphere. (For more on the solar atmosphere, see the Quick Study by Charles Kankelborg on page 72 of this issue.) For the first time, SMM provided direct evidence that the x rays from the accelerated electrons are indeed emitted from the two footpoints of a magnetic loop. And it found widespread Doppler blueshifting of spectral lines, which established that plasma was flowing upward, toward the observer.
Then, in the 1990s, Japan’s Yohkoh satellite found that some flare loops had cusps at the top, just as would be expected if they were the result of magnetic reconnection in a current sheet above them. Also, a few x-ray sources were found above the hot x-ray loops. Establishing the cause of those emissions was difficult, but in one case it was possible to determine that the emission was most likely from accelerated electrons, not hot plasma. That is, electrons were being accelerated in the region where reconnection is expected to occur. The Yohkoh x-ray images were crucial to developing confidence in the standard model and some variations on it. 4
Enter RHESSI
But Yohkoh’s spectral range and resolution were both limited. To make further progress in understanding particle acceleration, images and high-resolution spectra of the higher-energy x-ray and gamma-ray sources were needed. That capability was achieved in 2002 with the launch of NASA’s Ramaty High Energy Solar Spectroscopic Imager. RHESSI was named after Reuven Ramaty, a coinvestigator of the mission who unfortunately did not live to see the results.
The imager consists of nine pairs of fine metal grids in front of nine cooled germanium detectors within a long tube on a spinning spacecraft. 5 Rather than focusing the x rays and gamma rays, the grids convert spatial information to temporal information by selectively blocking and unblocking photons arriving from different directions. Each grid pair provides information about a different size scale; from their combined data, images of the source can be constructed on the ground. In addition to producing the first images of gamma-ray sources, RHESSI offers unprecedented x-ray and gamma-ray spectral resolution.
On 15 April 2002, just two months after it was launched, RHESSI imaged a flare at the limb of the Sun, the visible edge of the solar disk. 6 Some of the images are shown in figure 3. Because limb flares are observed from the side, they provide a better view of the height structure of the emission. A hot coronal loop was observed with a typical flare temperature of about 3 × 10⁷ K. But the loop top was higher at higher x-ray energies than at lower x-ray energies: The x-ray loop consisted of layers of magnetic loops, with the higher loops hotter than the lower loops. The layered structure had previously been observed at other wavelengths, especially the extreme UV, which is sensitive to lower-temperature plasma. The layering is consistent with continuous formation and heating of newly reconnected loops above previously formed, cooling loops.

Figure 3. X-ray images, taken by the Ramaty High Energy Solar Spectroscopic Imager, of a solar flare on 15 April 2002. The white curve in each panel marks the visible edge of the solar disk, and the bright yellow feature is the arcade of hot x-ray loops. In the first three images, a compact x-ray source forms at the top of the loops, then moves away from them (and away from the Sun). In the fourth image, which uses a slightly different color scale, the original compact source has left the field of view, but new sources have formed along the trajectory it took. Some structure must have given rise to those sources—probably an extended reconnection current sheet. (Adapted from ref.
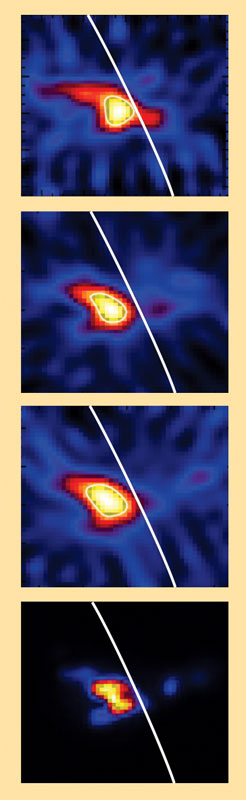
Above the loops, RHESSI observed a compact x-ray source. The source, which was found to be thermal, looked like a cusp at first. But with time it separated from the underlying loop, moved upward at about 300 km/s, and disappeared from the field of view. When it was stationary, the source was hotter on the bottom than on the top—the mirror image of the underlying loop. Energy release appears to have occurred between the loop top and the compact coronal source.
After the source left the field of view, additional compact coronal sources appeared along the path it had followed. 7 There must have been a thin structure, most likely the reconnection current sheet seen edge on, giving rise to them. The sources probably form via the so-called tearing mode instability, 1 which drives pairs of localized reconnections and, consequently, the growth of magnetic islands in the current sheet.
The 15 April flare was associated with a CME observed with the coronagraph on the Solar and Heliospheric Observatory (SOHO). The 300 km/s upward speed of the first compact x-ray source was found to match the speed of the CME.
The next day—16 April 2002—RHESSI observed another flare with a compact coronal source above a hot flare loop. The same event was imaged in the extreme UV by the Transition Region and Coronal Explorer. TRACE observed a larger loop that enclosed both the compact source and the hot x-ray loop, expanded at 45 km/s, and accelerated to 75 km/s at the start of the most intense x-ray burst. The compact source moved with the TRACE loop, always remaining just below the loop top. The TRACE loop was subsequently observed in SOHO’s coronagraph as a slow CME.
As the TRACE loop and compact source expanded upward during the flare, SOHO observed blueshifted and redshifted components between the two x-ray sources. 8 Their Doppler shifts, corrected for projection effects, corresponded to speeds of about 1000 km/s, as expected for the reconnection jets. The radial extent of the jets indicates that the reconnection current sheet was short, suggestive of Petschek, or fast, reconnection.
Coronal rays and slow reconnection
Occasionally, in the wake of a CME, coronagraph images will show a long, thin, radial structure, similar to the coronal rays first seen in eclipse observations. Figure 4 shows an example. 9 The ray follows the outward path of the CME and connects the top of the hot flare loops to the bottom of the CME. Spectroscopic observations show that a post-CME ray is hotter than the surrounding corona: It is almost certainly the reconnection current sheet seen edge on. Such a long, thin current sheet suggests Sweet–Parker, or slow, reconnection.

Figure 4. A coronal mass ejection imaged over 12 hours on 18 November 2003 by the Solar and Heliospheric Observatory. The thin structure in the last several images is a post-CME coronal ray, probably the extended reconnection current sheet seen edge on. (Adapted from ref.
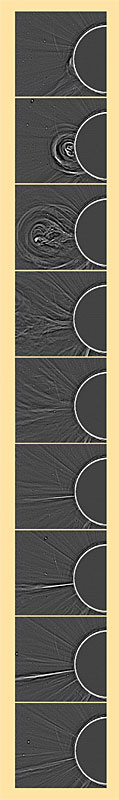
Post-CME coronal rays are observed only after the period of most rapid energy release. We therefore have evidence that reconnection is fast when energy release is fast, and reconnection is slow when energy release is slow.
But the rays are not the simple laminar structures Peter Sweet and Eugene Parker imagined the current sheets to be. Just as RHESSI observed discrete sources in an apparent current sheet, discrete sources appear in the thin rays behind CMEs. And when the current sheet is not observed edge on, x-ray and extreme UV images show multiple compact sources moving downward above the arcade of flare loops. Those structures, called supra-arcade downflows, are thought to originate from localized fast reconnections in the extended current sheet. 10
Electron acceleration
As the case for large-scale magnetic reconnection in the corona grows stronger, attention has turned to the questions of when, where, and how electrons are accelerated. The higher-energy x-ray flux, due to accelerated electrons, is normally greatest when the plasma heating rate is greatest: during the period of fast reconnection. Furthermore, the electron acceleration rate has been found to be correlated with the rate of change of the loop footpoint separation and the loop height. And when it has been possible to follow a CME all the way from the flaring region into the interplanetary medium, the electron acceleration rate has been found to be correlated with the rate of acceleration of the CME. None of those correlations is perfect, but they do indicate a single primary driver: the rate of magnetic reconnection.
Because the current sheet necessarily contains an electric field, it seemed likely that the electrons are accelerated there. But evidence is mounting to the contrary. The rate of electron acceleration is greatest during the period of fast reconnection, when the current sheet is shortest. Flare modeling 11 has found that acceleration must continue on individual field lines for up to hundreds of seconds, much longer than a field line can remain connected to the current sheet. Recent observations of coronal x-ray sources also indicate that the emission from accelerated electrons is farther from the inferred location of the current sheet than are the hottest loop-top and compact thermal x-ray sources. 12
Based on those results, the most likely location for the electron acceleration is in the outflowing reconnection jets. The downward jet, which directs electrons into a region of denser plasma, is responsible for the electrons observed in x rays, whereas the upward jet probably produces some of the radio sources observed higher in the corona. The acceleration mechanism is unknown, although a combination of turbulent acceleration, betatron acceleration, and shock acceleration is likely.
The total power imparted to the accelerated electrons has been a difficult quantity to measure. The low-energy end of the electrons’ x-ray spectrum overlaps with the high-energy end of the spectrum of thermal plasma. But RHESSI’s high-resolution spectra have made it possible to separate the two spectra in many flares: The thermal spectrum decays exponentially at higher energies, and what’s left is the accelerated-electron spectrum. The results confirm that the electrons do carry a significant fraction of the energy released in the flare, sufficient to power the heating and hydrodynamic evolution of the flare plasma. 13
Ions: A mysterious partner
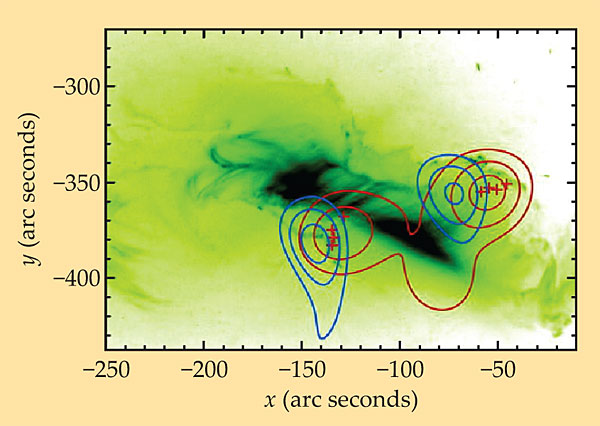
Gamma-ray line emissions are known to appear at the same time as the x-ray emissions. And the time-integrated emission at 2.2 MeV (a gamma-ray line that originates from nuclear capture by hydrogen of neutrons produced in interactions of accelerated ions with ambient nuclei) is known to be correlated with the time-integrated emission from accelerated electrons. 14 Both of those observations suggest that electron and ion acceleration are closely associated. On the other hand, RHESSI images such as the one in figure 5 show that the peak emission from accelerated protons does not originate from the same location as the emission from the accelerated electrons. 15

Figure 5. Ion acceleration and electron acceleration are thought to be related. But in a flare observed on 28 October 2003, gamma-ray emission from accelerated ions (blue contours) and x-ray emission from accelerated electrons (red contours) originate from different locations. The x-ray and gamma-ray data are from the Ramaty High Energy Solar Spectroscopic Imager; the green background image was taken by the Transition Region and Coronal Explorer and shows the arcade of hot flare loops. (Adapted from ref.
The reason for the different locations is unknown, although theoretical explanations have been advanced. 16 Also unknown is the total power in the accelerated ions. The existing gamma-ray line observations only provide information about protons, the most abundant ion, with energies down to a few MeV at best; extrapolations from those observations down to 1 MeV suggest that the power in accelerated ions may be similar to that in electrons. Future observations should tell us more.
Two-step reconnection
The RHESSI observations of hot, loop-top x-ray sources yielded a particularly surprising result that is unaccounted for by the standard model: Before expanding upward, the loops appear to contract downward. Observations of loop footpoints showed that the contraction was associated with a decrease in the distance between the footpoints—a decrease specifically due to a decrease in magnetic shear, the angle of the line connecting the footpoints to a line perpendicular to the magnetic neutral line between the ribbons of emission. 17 The downward motion has since been identified at other wavelengths as well.
The most likely explanation is that the most highly sheared part of a preflare arcade rises above the rest and is the first to develop fast reconnection. Because of the shear, loops reconnect not with themselves but with their neighbors, as shown in figure 1. The rapid rise associated with fast reconnection then induces fast reconnection in the next neighboring loops, and the process propagates along the ribbons to initially lower loops. Then the loop footpoints separate in the direction perpendicular to the ribbons, and the loop tops expand upward as reconnection continues above the arcade loops and newly reconnected loops settle onto those formed earlier. Thus in some solar eruptive events, reconnection proceeds in two stages: propagation of fast reconnection along the arcade and subsequent recon-nection well above the arcade as the CME propagates outward. The latter stage is well described by the standard model.
Looking forward
Understanding of solar eruptive events has advanced greatly over the past decade, thanks in large part to RHESSI and its data on high-energy x rays and gamma rays. 18 The standard model, developed decades ago based on a partial picture, has been well supported, but with some important refinements and modifications. We now have evidence for the current sheet and reconnection jets. But the current sheet has turned out to be a more complicated structure than originally thought. And the all-important electron acceleration apparently takes place in the jets, not the current sheet.
The interpretation of flare images has been hampered by overlapping structures and projection effects. The current fleet of solar observatories in space, including the Solar Dynamics Observatory, the Solar Terrestrial Relations Observatory, and Hinode, has the potential to overcome that challenge by taking fast, high-resolution images from different perspectives. We expect to continue to see substantial progress as the data from those instruments—and, of course, x-ray and gamma-ray observations from RHESSI—are analyzed.
An important test of coronal particle acceleration is to use numerical models to connect direct observations of hot flare plasma to x-ray data on the accelerated electrons presumed to be heating that plasma. Numerical models are up to the task, but so far, observational capabilities are not. The required UV, extreme UV, and x-ray spectroscopic imaging is feasible but difficult to accomplish, and the ability to simultaneously observe both the brightest flare sources and the fainter sources in the corona remains a challenge. A suite of instruments optimized for studying solar eruptive events, including ground-based optical and radio observatories, is under study in the solar physics community.
References
1. E. Priest, T. Forbes, Magnetic Reconnection: MHD Theory and Applications, Cambridge U. Press, New York (2000).
2. M. Aschwanden, Physics of the Solar Corona: An Introduction, Springer, New York (2004).
3. Y. Liu et al., Astrophys. J. Lett. 593, L137 (2003). https://doi.org/10.1086/378284
4. K. Shibata, T. Magara, Living Rev. Sol. Phys. 8, 6 (2011).
5. R. P. Lin et al., Sol. Phys. 210, 3 (2002). https://doi.org/10.1023/A:1022428818870
6. L. Sui, G. D. Holman, Astrophys. J. Lett. 596, L251 (2003). https://doi.org/10.1086/379343
7. L. Sui et al., Astrophys. J. 633, 1175 (2005). https://doi.org/10.1086/462410
8. T. Wang, L. Sui, J. Qiu, Astrophys. J. Lett. 661, L207 (2007). https://doi.org/10.1086/519004
9. J. Lin et al., Astrophys. J. 622, 1251 (2005). https://doi.org/10.1086/428110
10. D. E. McKenzie, S. L. Savage, Astrophys. J. 697, 1569 (2009). https://doi.org/10.1088/0004-637X/697/2/1569
11. H. Warren, Astrophys. J. 637, 522 (2006). https://doi.org/10.1086/497904
12. W. Liu et al., Astrophys. J. 698, 632 (2009). https://doi.org/10.1088/0004-637X/698/1/632
13. A. G. Emslie et al., J. Geophys. Res. 109, A10104 (2004). https://doi.org/10.1029/2004JA010571
14. A. Y. Shih, R. P. Lin, D. M. Smith, Astrophys. J. Lett. 698, L152 (2009). https://doi.org/10.1088/0004-637X/698/2/L152
15. G. Hurford et al., Astrophys. J. Lett. 644, L93 (2006). https://doi.org/10.1086/505329
16. N. Vilmer, A. L. MacKinnon, G. J. Hurford, Space Sci. Rev. 159, 167 (2011). https://doi.org/10.1007/s11214-010-9728-x
17. W. Liu et al., Astrophys. J. 693, 847 (2009). https://doi.org/10.1088/0004-637X/693/1/847
18. Special volume, “High-Energy Aspects of Solar Flares: A RHESSI-Inspired Monograph,” Space Sci. Rev. 159(1–4) (2011).
More about the authors
Gordon Holman is a research astrophysicist in the Solar Physics Laboratory at NASA’s Goddard Space Flight Center in Greenbelt, Maryland.


