Ptychography: A solution to the phase problem
DOI: 10.1063/PT.3.4835


Over the past 15 years, ptychography applications and methods have advanced significantly. Ptychography is a computational microscopy technique for acquiring images with resolutions beyond the limits imposed by beam diameter, optical aberration, and numerical aperture—NA, a measure of the range of incident angles an optical system can accept. Nowadays it encompasses various experimental techniques with visible light, UV light, x rays, and electrons. Emerging applications include, for example, accurate wavefront-aberration measurement for space telescopes.

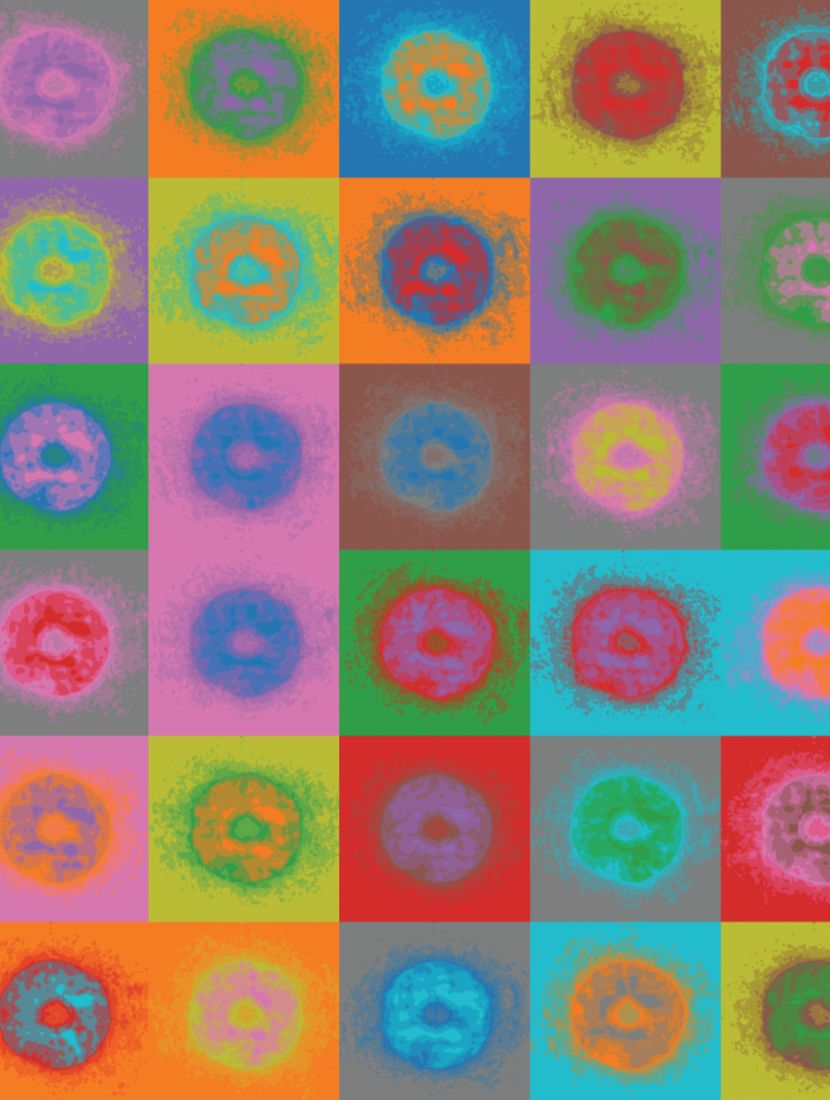
X-ray ptychography measurements taken at the Swiss Light Source. (Image by Pierre Thibault.)
A bit of history
Ptychography was introduced in 1969 in a three-part paper
1
by Walter Hoppe, an influential figure in the field of electron microscopy. (For more about the technique’s name, see box
About the name
Ptychography is a cumbersome word. In English, the “p” is silent, as in “psychology,” so the word is pronounced tie-KOH-gra-fee. Its etymological roots are from the ancient Greek πτυχή (ptukhḗ, “a fold”) and the Greek γράφω (grapho, “to write”). The reasoning behind the name requires a small detour into the German language. As mentioned in the main text, a convolution in reciprocal space is a central aspect of the original technique. In German, convolution is usually referred to as Faltung (folding). From there one can draw a connection between the technique and the ancient Greek word for fold, although the connection is somewhat convoluted. (The authors apologize dearly for the pun.)
Hoppe’s idea was to retrieve a crystal’s structure by illuminating it with a tightly focused coherent electron beam and measuring the far-field intensity distribution. In the far-field limit, the scattered beam encodes the crystal’s reciprocal-space structure, and periodic sharp points, called Bragg peaks, appear when a periodic structure is illuminated with a homogeneous coherent field. The complex-valued wave fields of those peaks are needed to reconstruct the real-space structure through Fourier synthesis. The magnitude of the wave fields can be obtained from the peaks’ measured intensities, but the corresponding phases cannot be directly measured. The impossibility of directly measuring those phases, and the difficulty of retrieving them through indirect means, is known as the phase problem. (See, for example, the article by Keith Nugent, David Paganin, and Tim Gureyev, Physics Today, August 2001, page 27 .)
Ptychography was Hoppe’s attempt at tackling the difficult task. In the regime where multiple-scattering effects are negligible, the transmitted wave field is proportional to the product of the beam’s wave field and the crystal’s transmissivity, which depends primarily on its electron density distribution. In reciprocal space, that product becomes the convolution of the crystal’s reciprocal-space structure, consisting of narrow peaks, and the Fourier transform of the beam. Hoppe realized that if the beam was small enough—comparable to the lattice spacing—the width of its Fourier transform would be comparable to the spacing between the Bragg peaks, and the convolution would broaden those peaks enough that they would overlap and interfere with each other. Translating the beam by small steps then creates a beating pattern in the overlap region from which the phases of the peaks can be unambiguously extracted. Although Hoppe had written his 1969 series of papers mainly about solving crystal structures, he devoted the third part to applying the same principles to nonperiodic objects.
Ptychography has since evolved into a lensless microscopy technique in which image-forming optics are replaced by computational reconstructions. The resolutions of x-ray and electron microscopy techniques are limited by the need for well-corrected high-NA optics. Ptychography removes that limit; its resolution is, in principle, restricted by the maximum diffraction angle at which intensities can be measured with sufficient statistics. Additionally, the technique has loose requirements for the quality and size of the illuminating beam because the resolution is not limited by the illumination spot size or by wavefront aberrations in the focusing optics (see, for example, box
A structured-illumination technique
The encoding of information in a ptychogram relies on the spatial structure of the illuminating probe. Without some degree of such structure, transverse shifts of the sample do not create a difference in the measured intensities, and both the ptychogram’s dependence on the spatial coordinate and the encoded information disappear.

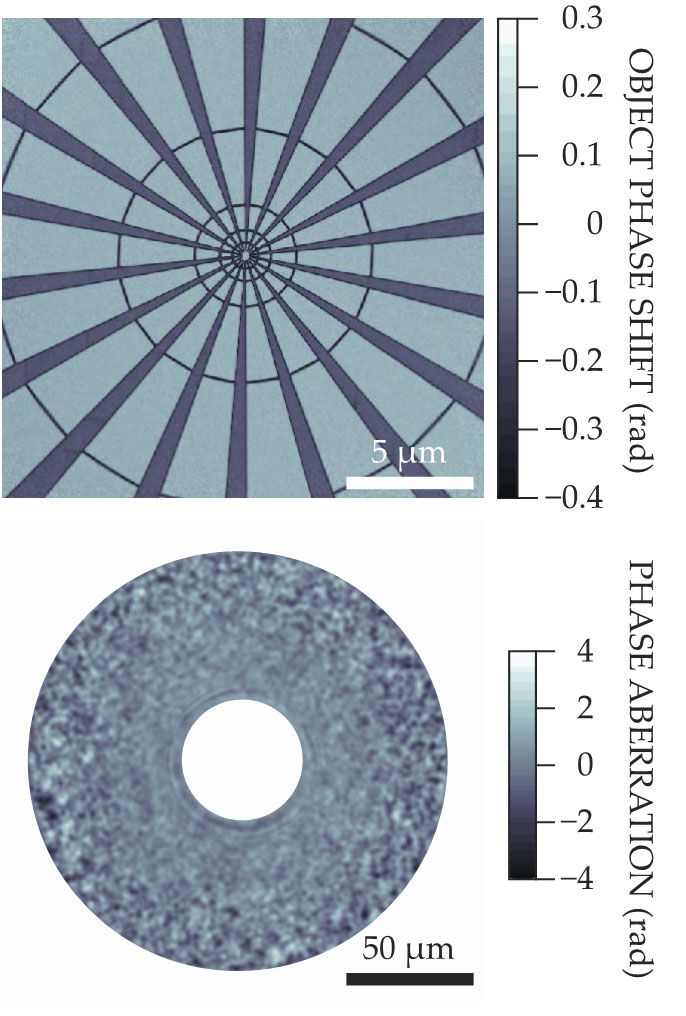
Several studies in the past few years have found that increasing spatial structure to the illumination is beneficial for ptychographic reconstructions. To that end, methods have been proposed to introduce structure and wavefront aberrations into illuminating beams. The top image here shows a ptychographic reconstruction of a test object. The probe used to make the measurements was created with an x-ray lens that imparted finely controlled wavefront perturbations, which are shown in the bottom image. (For more details, see M. Odstrčil et al., Opt. Express 27, 14981, 2019, doi:10.1364/OE.27.014981 .)
Such studies were good news for x-ray microscopy because obtaining focused x-ray beams with negligible aberrations is challenging. With ptychography, we can embrace and welcome the ugliness of our beams as long as the illumination is coherent and stable.
Ptychogram as a spectrogram
The input data for a ptychography reconstruction is a collection of intensity measurements referred to as a ptychogram (see figure
Figure 1.

Ptychography can be implemented in one or two dimensions. In the technique, an unknown sample (the object) is imaged by an illuminating optical, UV, x-ray, or electron beam. The illuminating probe is translated across the object, and the far-field intensity is measured for each probe position. (The intensities for three positions are sketched here.) A ptychogram is the collection of intensity profiles for all probe positions. The far-field intensity is the square modulus of the Fourier transform of the product of the object and probe. The ptychogram is then used to reconstruct both the probe and the object—the goal of ptychography. For 1D ptychography, the ptychogram is a 2D spectrogram (bottom row), whereas for 2D ptychography, it is a difficult-to-depict 4D entity.
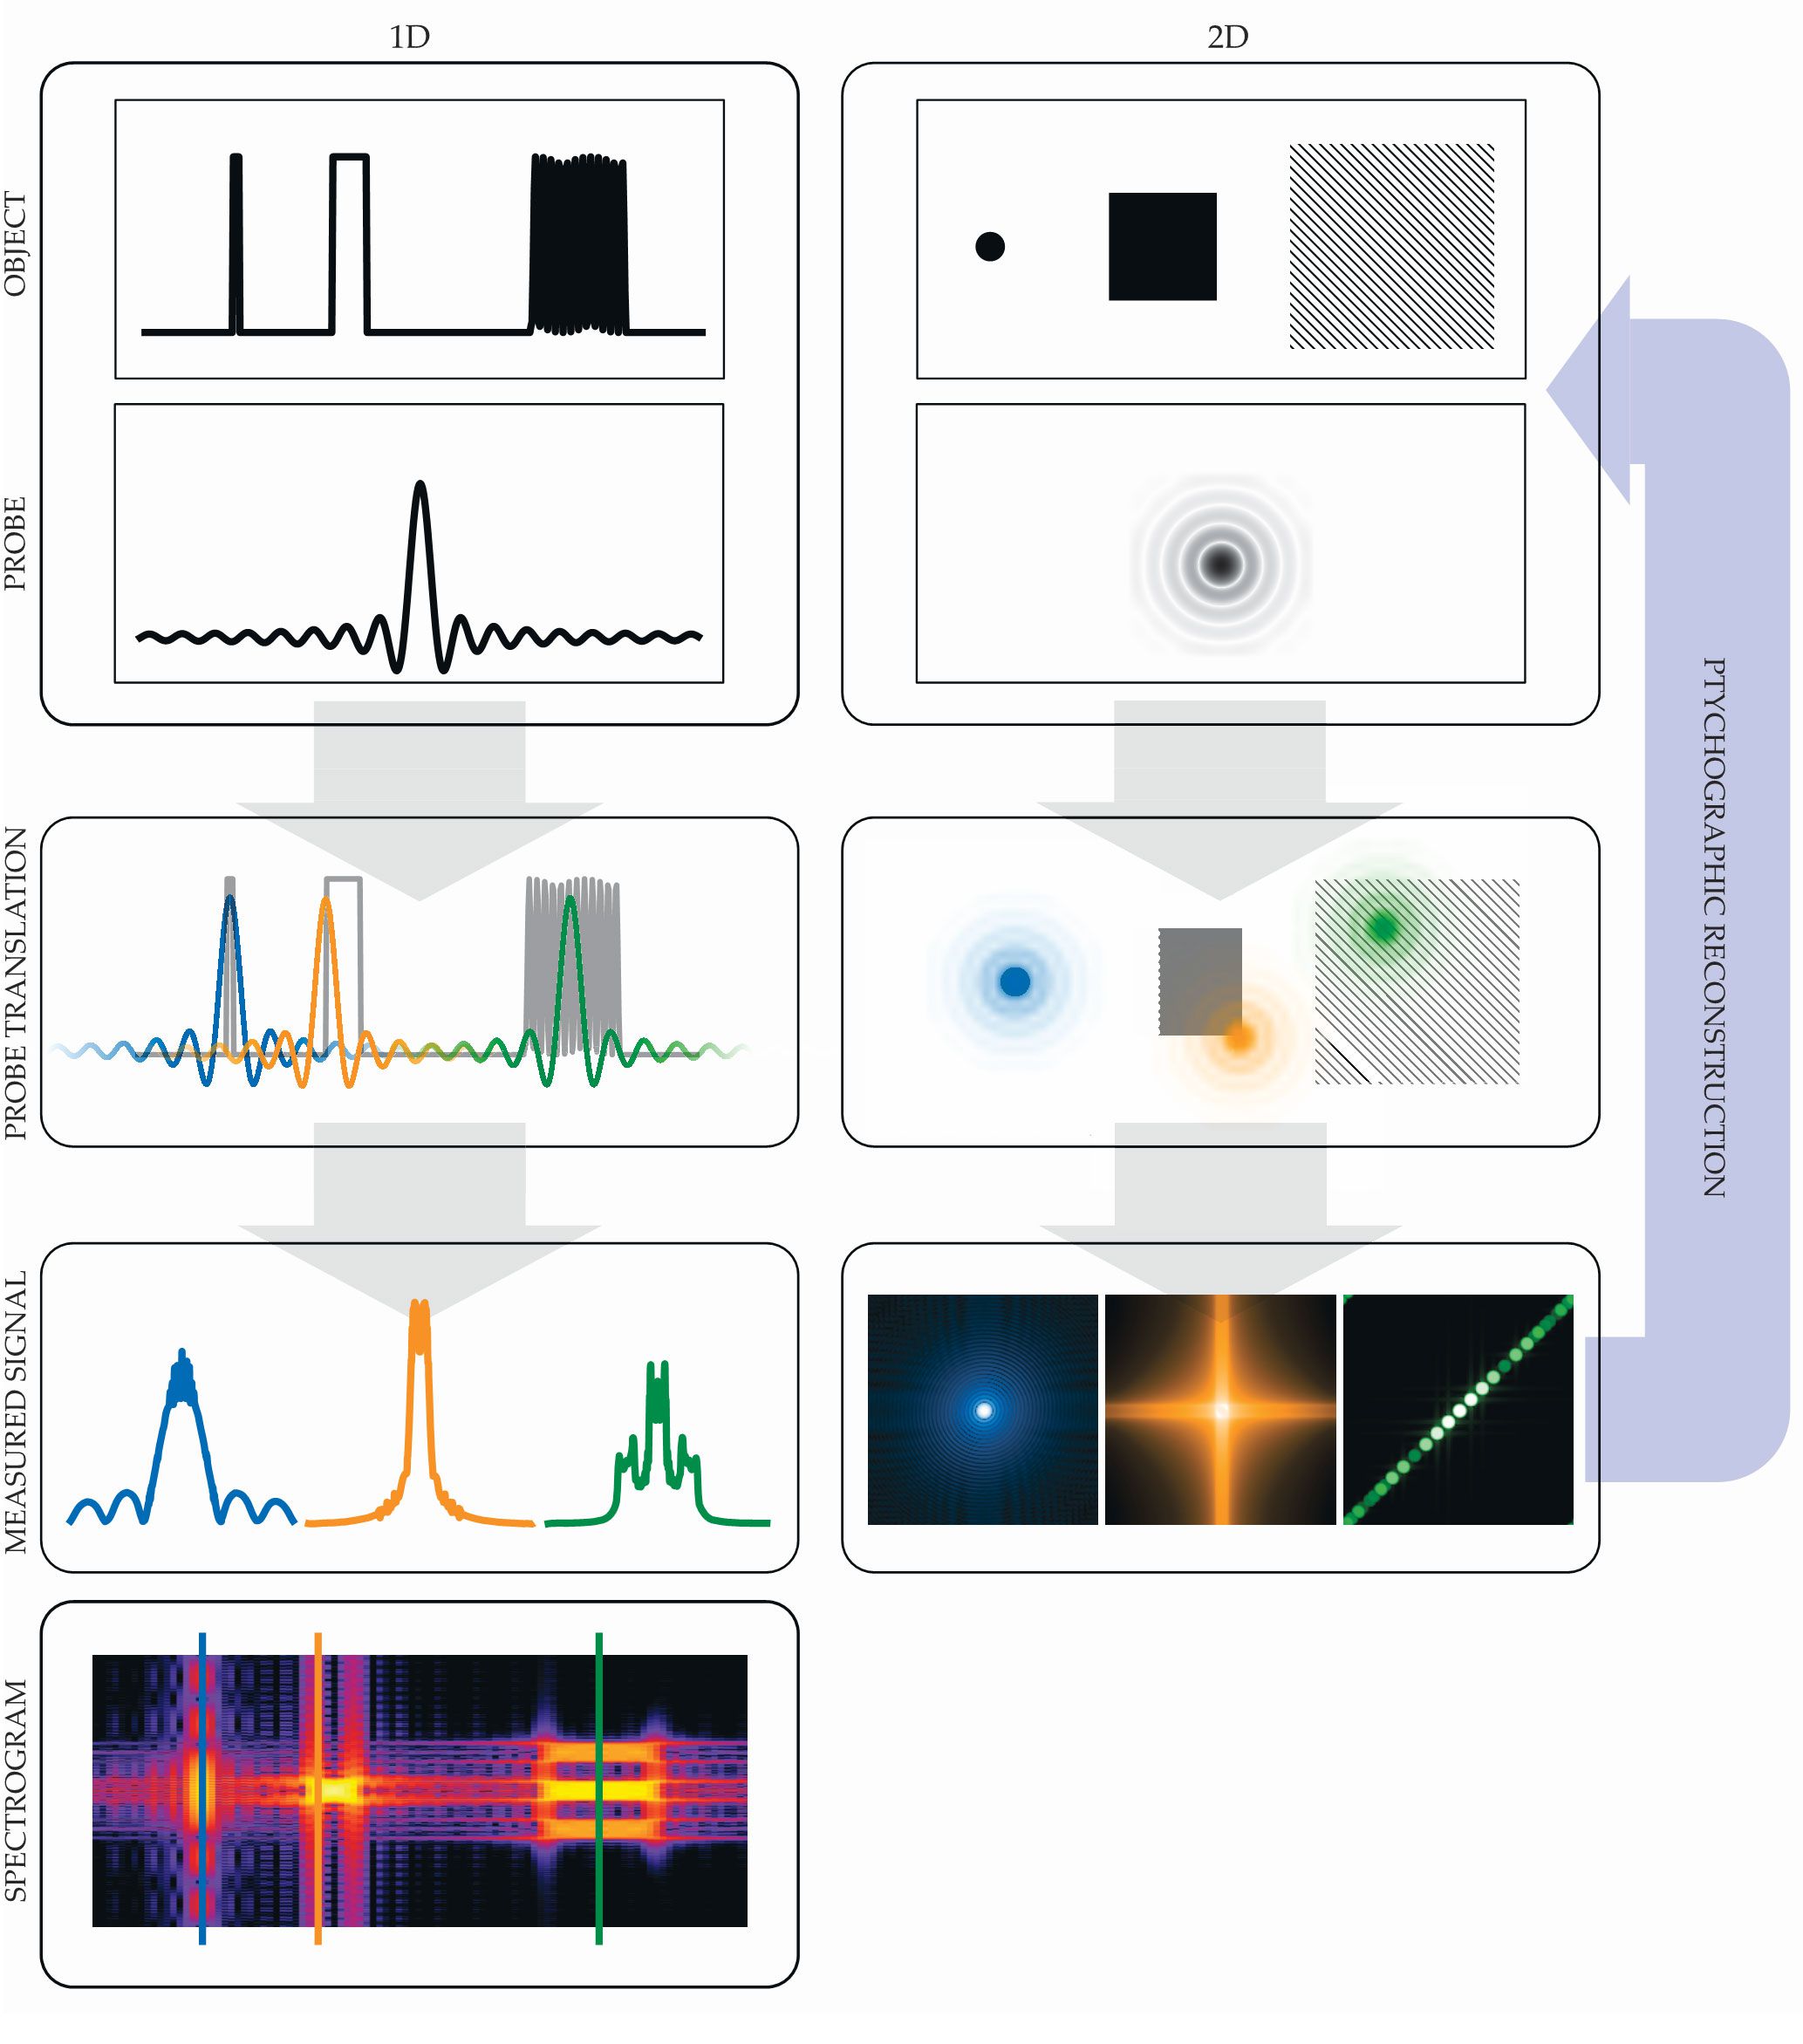
A reader versed in audio signal processing will notice the connection to the short-time Fourier transform (STFT), which is typically used to create audio spectrograms. For an STFT, an audio signal is multiplied by a sliding temporal window to extract a portion of the signal locally in time. The spectrogram is constructed by computing a Fourier transform for each position of the sliding window.
In a ptychogram, the illumination probe serves as a spatial, rather than temporal, sliding window. The measured far-field signal represents the spatial frequencies that are locally present in the object, albeit convolved with the Fourier transform of the probe. The ptychography reconstruction problem is then mathematically closely related to that of recovering a signal from the magnitude of its STFT.
In 1992 John Rodenburg and Richard Bates formalized the mathematics that connect the ptychography reconstruction in real space to its spatial-frequency description. 3 They showed that a ptychogram is a convolution of the Wigner distributions—space–frequency representations devised to describe quantum states—of the probe and object. They outlined a unique and direct reconstruction method for an arbitrary object, via the well-known procedure of deconvolution. The linear procedure also provided an avenue for further analysis, such as statistical noise propagation.
For a 2D object the ptychogram is a 4D data set. With added dimensions, data processing increases quickly in all aspects: data volume, computational time, and memory. Although the task is manageable today, the barriers were significant when Rodenburg and Bates published their paper. Thus aside from a few impressive proof-of-principle demonstrations, ptychography remained of limited practical application. There was also a sense that generating two 2D images from a large 4D data set was a somewhat wasteful enterprise and that the ptychogram must surely be a highly redundant entity.
Ptychography meets iterative phase retrieval
In his 1982 paper, Hoppe suggested that “tackling of the data in different ways … might provide an attractive field for lovers of computers” (reference , page 193). Indeed, as early as 1972, electron microscopists Ralph Gerchberg and Owen Saxton had already started exploring iterative phase-retrieval methods that exploited the newly invented fast-Fourier-transform algorithm. 4 Such algorithms start with an estimated initial wave field and use functions to propagate the field back and forth between the object and measurement planes. Constraints can be applied at each step, and the process repeats until it converges on a solution.
James Fienup introduced the hybrid input–output algorithm, an iterative algorithm that could reconstruct an object from the magnitude of its Fourier transform, 5 in 1978. His solution to the phase-retrieval problem used limited a priori information about the object to impose constraints in real and reciprocal spaces. It was mainly used with optical telescopes to overcome limits posed by atmospheric turbulence.
Then, in 1999, Fienup’s algorithm was applied in the first demonstration of coherent diffractive imaging (CDI) that used x rays to visualize nonperiodic objects. 6 CDI has inherent limitations: The sample must be well isolated and of limited size to satisfy requirements for sampling the diffraction patterns, and the illumination must be uniform across the sample to avoid influencing the object’s Fourier spectrum. Yet the method has remained important for imaging with, for instance, x-ray free-electron lasers.
In 2004 Helen Faulkner and Rodenburg showed for the first time that ptychographic reconstructions could be obtained within an iterative phase-retrieval framework, thereby bringing the technique to its modern form. 7 They retained the technique’s original experimental procedure: Coherent far-field diffraction patterns are acquired by directing a spatially bound probe at different transverse positions relative to the object. But the researchers analyzed the data in a way similar to that used for CDI, iteratively applying constraints in real and reciprocal spaces until they converged on a solution. The modern version of ptychography can, in fact, be viewed as a scanning version of CDI, but without the requirement that samples be isolated, which means it can be used to image and zoom in on spatially extended samples.
Unlike CDI, which needs uniform illumination, ptychography requires a probe that has both significant spatial structure and a broad spatial spectrum. Ptychography’s phase-retrieval procedure also decouples the contributions of the object and the probe, thereby enabling each to be separately reconstructed. A crucial consequence of introducing iterative phase-retrieval algorithms to ptychography was that the data sets no longer needed the Wigner method’s small scanning steps, which had to be at least as small as the resolution sought. Ptychogram sampling in real space can be done with step sizes much larger than the resolution as long as the illuminated regions have sufficient overlap.
The convergence of ptychographic reconstructions benefits from the simultaneous constraints of several diffraction patterns. That improvement, together with the technique’s robustness against noise, removes some pesky ambiguities inherent to CDI reconstructions. Enforcing consistency among overlapping illuminated areas during reconstruction provides additional information needed to resolve ambiguities in the solution and aid the phase-retrieval process.
Undoubtedly aware of the value of their ideas, Faulkner and Rodenburg filed a patent in 2004 that claimed wide coverage of iterative methods applied to ptychography. We have observed that the proactive protection of the broad patent by its current owner has influenced the free exchange of algorithmic tools. We deem it likely that the sharing of open-source reconstruction software will continue to remain difficult until existing patent coverage expires, which is expected to happen in 2026.
Demonstrations of the new ptychography approach at third-generation x-ray synchrotron sources, which provide sufficient coherence, quickly followed Faulkner and Rodenburg’s demonstration, and the technique rapidly attracted interest from the x-ray imaging community. Researchers developed reconstruction algorithms to tackle a larger number of experimental scenarios, as detailed below. For more comprehensive discussions of x-ray ptychography advances, methods, algorithms, and applications, see references .
Experimental setups
Variations in the configurations of ptychography experiments emerged in parallel with the algorithmic developments. The new geometries, illustrated in figure
Figure 2.

Different experimental configurations enable multiple kinds of ptychography. Arrows indicate scanning motion. The intensity measured at the detector (black) corresponds to a Fourier transform of the exit wave field after the sample (blue). (a) In the simplest configuration, an aperture shapes the illuminating beam. (b) With a focused beam, the sample can be located at the focus or slightly upstream or downstream. Moving it tunes the size of the illuminating beam. For near-field ptychography, the sample is located significantly downstream of the beam focus (dashed box). (c) Reflection ptychography can use either specular or Bragg reflection. (d) In Fourier ptychography, a lens forms an image of the sample on the detector. Changing the illumination angle (dashed lines) changes the scattering angles accepted by the lens pupil. Capturing larger angles allows higher-resolution information to pass through the lens.
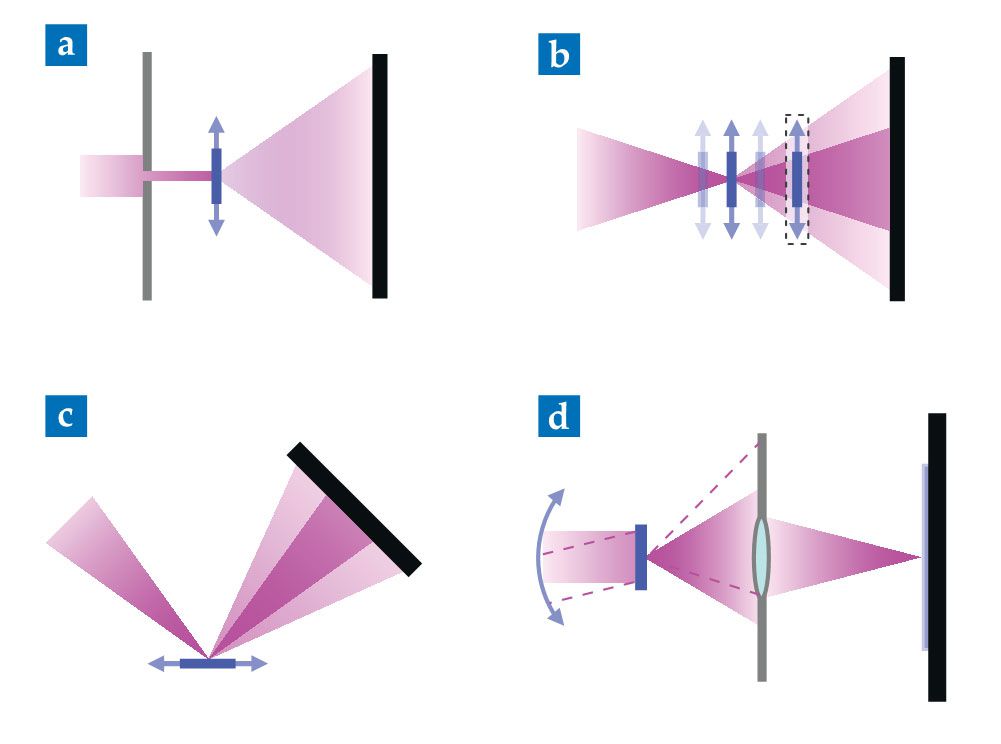
Ptychography also has important applications in reflection mode. For x-ray Bragg reflection, a crystalline object is oriented such that the incident probe satisfies the Bragg-reflection condition—that scattered light from the crystal layers interferes constructively. As the object is scanned, minute variations in the crystalline structure can be observed and used to map dislocations and other lattice defects. 11 Specular-reflection ptychography has also been demonstrated in the extreme-UV regime. 12
Fourier ptychography is, perhaps, the odd member of the family. The basic setup uses a conventional imaging lens between the object and the detector. Normally the NA of the lens limits the imaging resolution. But in Fourier ptychography, changing the direction of the beam incident on the same object region effectively translates the object spectrum in the lens-pupil plane. 13 (With x rays, it is more practical to move the actual lens. 14 ) A different part of the spectrum then makes it through the pupil at each angle, and the measured images are treated with ptychography reconstruction algorithms.
For both optical and x-ray wavelengths, Fourier ptychography has the significant advantage in that a high-resolution image can be obtained with low-NA optics, which are easier to manufacture and can have larger fields of view and working distances than the high-NA optics required by other techniques. The technique’s underlying process—scanning an optical aperture to synthesize an image with better resolution—is quite similar to synthetic aperture imaging, which has been used for many years with radar and telescopes.
Beyond imaging, ptychography has found applications in the time domain for characterizing ultrashort optical pulses with very high temporal resolution. 15 It has also been used for optical wavefront characterization of free-form optics, 16 an approach showing promise for on-board alignment of space telescope components.
With all those flavors, it is fair to ask, What is ptychography, and what is not? In our view, ptychography is defined by two factors. First, it relies on the encoding of information through the propagation and self-interference of a wave field that originates after the probe interacts with the object. Second, it uses a probe that undergoes a transverse translation to acquire multiple data sets in a way that aids the phase-retrieval process. 17 In other words, ptychography involves some level of stitching. That definition differentiates ptychography from other approaches that rely solely on propagation and interference.
Sampling and information content
The 4D nature of a ptychogram means that sampling constraints apply both in reciprocal space, where the far-field intensity is measured, and in real space through the scanning step size. In the original reconstruction approach using Wigner deconvolution, full sampling in both domains was necessary for a reconstruction: The scanning step size needed to be as small as the sought resolution, and the far-field intensities needed to be Nyquist sampled, meaning the detector’s pixel size should be small enough to sample the narrowest oscillations present in the measured intensity pattern. That massive sampling of the phase space led to data sets that were unnecessarily redundant, not to mention difficult to measure and process.
The incorporation of iterative transform algorithms significantly relaxed the step-size requirement. As long as the different illuminated regions had some significant overlap, the scanning step could be much larger than the sought real-space resolution. The exact boundaries of what constitutes sufficient sampling of the ptychogram are a subject of current research.
For conventional far-field ptychography, a trade-off exists between sampling in real and reciprocal spaces. For Nyquist-sampled intensities, practitioners have adopted the rule of thumb that all regions of the imaged sample should be illuminated at least twice. An example of the aforementioned trade-off is that a finer step size should be used when the far-field intensities are not Nyquist sampled—when they are measured with a pixel grid too coarse to capture all the oscillations present in the intensity pattern. There appears to be a strong mixing of information in the ptychogram that allows for some freedom in its sparse sampling.
From its origins, ptychography was meant to reconstruct an unknown object illuminated by a known beam. It was of immense practical benefit, then, to discover that it can also recover information about the illumination. In fact, the illuminating beam can be reconstructed with limited prior knowledge, such as its approximate diameter and phase curvature, the latter being determined primarily by the distance between the beam focus and the object.
Without the need for an a priori estimate of the probe, the quality of the reconstructions improved tremendously. Ptychography quickly became a valuable beam- and wavefront-characterization technique. Moreover, under certain conditions, errors in the scanning positions can also be recovered and corrected. The self-consistency embedded in the ptychogram can compensate to an impressive extent for experimental unknowns and uncertainties. 17 , 18
All the refinements to experimental unknowns have practical capture ranges. For instance, the reconstruction algorithms robustly converge only if the phase curvature and diameter of the illumination are approximately known or, alternatively, if the intensity data are collected in fine steps and with a high signal-to-noise ratio. In practice, it is often beneficial to first characterize the illumination with a fine scanning step; constraints on subsequent measurements can then be relaxed by using that characterization as an initial guess for the probe.
Still more information can be extracted from a ptychogram. For example, one can solve for coherent-mode representations of the object and illumination, which allow for characterization not only of the illuminating wavefront but also of its partially coherent properties. The probe’s temporal variations over the course of data collection can also be retrieved, as can multiple-wavelength reconstructions. Other complex interactions between the illumination and the object can be modeled, thereby enabling the retrieval of additional properties, such as the object’s polarization and magnetization effects. Even depth-of-field limitations can be surpassed by representing the reconstructed object in multiple slices.
Applications and state of the art
This article would not be complete without mention of current applications. In the interest of brevity—and with the express warning that this is by no means an extensive list—we present three examples that provide a glimpse into optical, x-ray, and electron imaging implementations.
Fourier ptychography is well suited to visible-light applications. With the technique, low-magnification objectives with large working ranges and fields of view can generate high-resolution images. The measurements can be made extremely quickly using LED arrays. Fourier ptychography also recovers images with quantitative phase, which is useful in, for example, estimating cellular masses in biological samples.
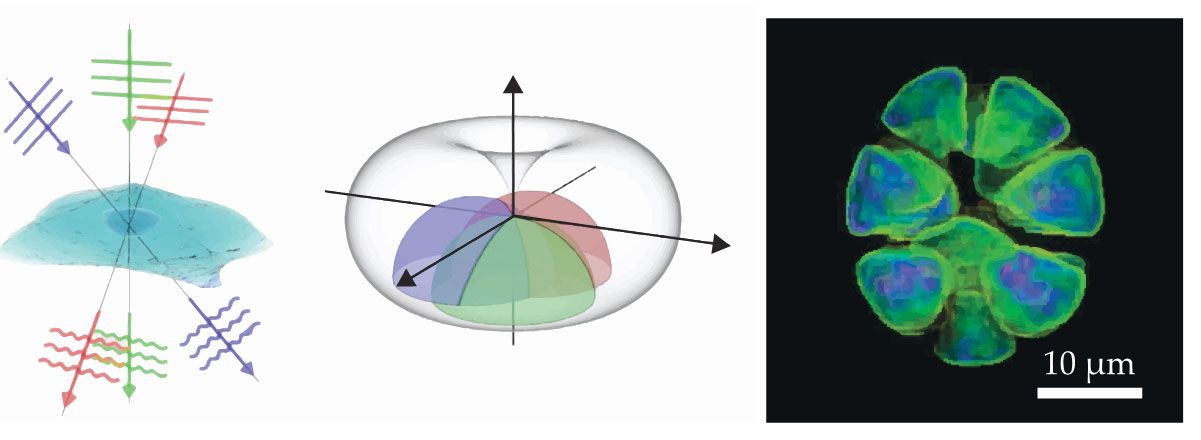
Three-dimensional imaging using Fourier ptychography principles was first demonstrated by Lei Tian and Laura Waller at the University of California, Berkeley, in 2015. Then, in 2020, Chao Zuo and colleagues at the Nanjing University of Science and Technology pushed the technique beyond proof-of-principle demonstration, obtaining 3D images using wide-field optical micrographs of 1.77 mm2 at better than 400 nm resolution with 507 nm wavelength illumination.
The basic principle and some of their results are reproduced in figure
Figure 3.

Optical 3D imaging can be achieved by combining Fourier ptychography with principles of diffraction tomography. Each illumination direction (left) contains information on a hemispherical shell in reciprocal space (center). After an iterative phase-retrieval process, the reconstructed reciprocal-space information can be used to obtain a 3D image (right). (Adapted from C. Zuo et al., Opt. Lasers Eng. 128, 106003, 2020, doi:10.1016/j.optlaseng.2020.106003 .)
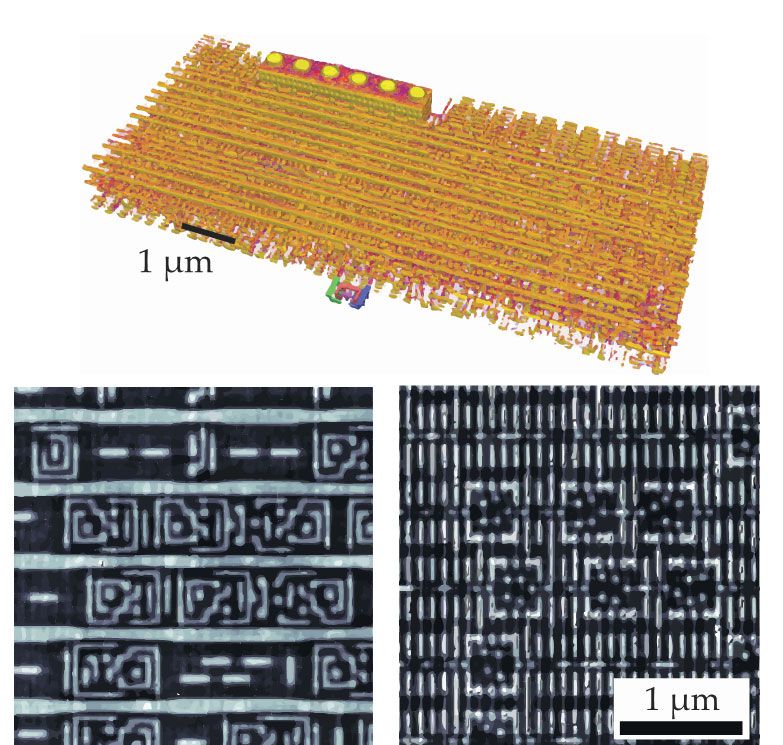
In the x-ray regime, far-field ptychography excels at recovering high-resolution images with quantitative contrast. The combination with x-ray spectroscopy and x-ray fluorescence shows great potential for providing structural, chemical, and compositional characterizations. To date, the most widespread application of x-ray ptychography is probably 3D imaging. Figure
Figure 4.

X-ray ptychography views with different angular orientations can be combined into a 3D image with nanometer resolution. These images show the metal layers of an integrated circuit. The top image is a 3D rendering with 20 nm resolution. The bottom two images show tomographic virtual cuts in a zoomed-in region of interest. (Adapted from M. Holler et al., Nat. Electron. 2, 464, 2019, doi:10.1038/s41928-019-0309-z .)
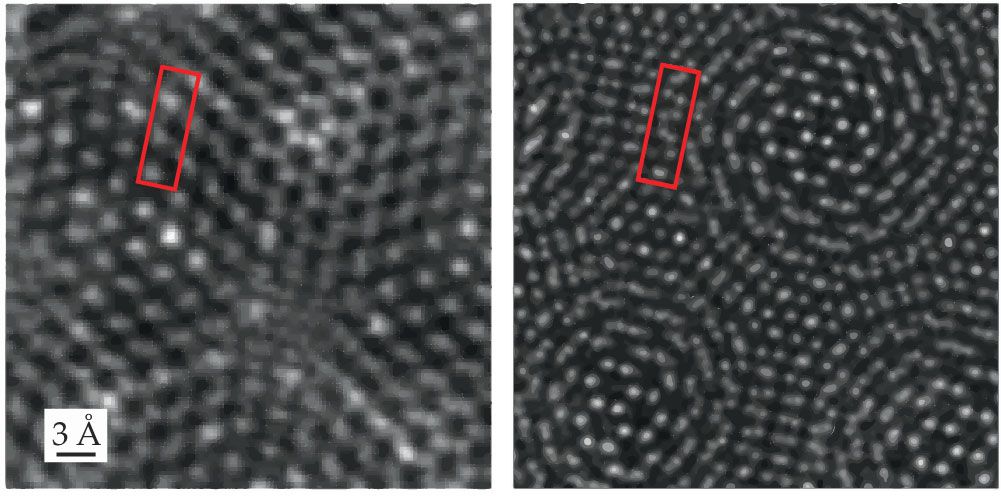
Hoppe’s original dream of using ptychography for electron microscopy took decades to become reality, but electron ptychography now boasts resolutions that surpass electron-lens aberrations and numerical-aperture limitations. It also has the added benefit of providing quantitative phase contrast. In 2018 David Muller’s group at Cornell University carried out electron ptychography using a novel pixel-array detector with a high dynamic range and single-electron sensitivity. Shown in figure
Figure 5.

Electron micrographs of a twisted molybdenum disulfide bilayer show that ptychography (right) produces higher resolution than high-angle annular dark-field microscopy (left), a conventional method for high-resolution imaging. Red boxes highlight the same area in each image. (Courtesy of David Muller.)
Capabilities for ptychography continue to be developed, and in the past 10 years the technique has become increasingly available. Electron ptychography is already carried out, or soon will be, in several institutions around the world. X-ray ptychography is slightly ahead of the curve, with many third-generation synchrotron sources enabling ptychography measurements in some form and offering the capability to users across scientific fields. With planned upgrades, fourth-generation synchrotron sources, such as MAX IV in Sweden, Sirius in Brazil, and the upgraded European Synchrotron Radiation Facility in France, will advance ptychography and other coherent imaging techniques. Researchers will be able to exploit their high coherent fluxes to gain improved resolution, throughput, and characterization dimensionality.
Ptychography’s applications are expected to grow and broaden, and new ones continue to emerge. Established techniques are already widely used for imaging with light, x rays, and electrons, and ptychography’s different geometries and contrast mechanisms are being applied in an increasing number of scientific applications. As sources, scanning technology, and detectors improve, the capabilities and applications of ptychography will continue to expand and diversify.
Manuel Guizar-Sicairos’s research is currently supported by the Swiss National Science Foundation. Pierre Thibault’s research is currently supported by the European Research Council under the European Union’s Horizon 2020 research and innovation program (grant agreement no. 866026).
References
1. W. Hoppe, Acta Cryst. 25, 495 (1969). https://doi.org/10.1107/S0567739469001045
2. W. Hoppe, Ultramicroscopy 10, 187 (1982). https://doi.org/10.1016/0304-3991(82)90038-9
3. J. M. Rodenburg, R. H. T. Bates, Philos. Trans. R. Soc. London Ser. A 339, 521 (1992). https://doi.org/10.1098/rsta.1992.0050
4. R. W. Gerchberg, W. O. Saxton, Optik 35, 237 (1972).
5. J. R. Fienup, Opt. Lett. 3, 27 (1978). https://doi.org/10.1364/OL.3.000027
6. J. Miao et al., Nature 400, 342 (1999). https://doi.org/10.1038/22498
7. H. M. L. Faulkner, J. M. Rodenburg, Phys. Rev. Lett. 93, 023903 (2004). https://doi.org/10.1103/PhysRevLett.93.023903
8. F. Pfeiffer, Nat. Photonics 12, 9 (2018). https://doi.org/10.1038/s41566-017-0072-5
9. J. Rodenburg, A. Maiden, in Springer Handbook of Microscopy, P. W. Hawkes, J. C. H. Spence, eds., Springer (2019), p. 819.
10. C. Jacobsen, X-Ray Microscopy, Cambridge U. Press (2020).
11. P. Godard et al., Nat. Commun. 2, 568 (2011). https://doi.org/10.1038/ncomms1569
12. M. D. Seaberg et al., Optica 1, 39 (2014). https://doi.org/10.1364/OPTICA.1.000039
13. G. Zheng, R. Horstmeyer, C. Yang, Nat. Photonics 7, 739 (2013). https://doi.org/10.1038/nphoton.2013.187
14. K. Wakonig et al., Sci. Adv. 5, eaav0282 (2019). https://doi.org/10.1126/sciadv.aav0282
15. D. Spangenberg et al., Phys. Rev. A 91, 021803(R) (2015). https://doi.org/10.1103/PhysRevA.91.021803
16. A. M. Michalko, J. R. Fienup, Opt. Eng. 59, 1 (2020). https://doi.org/10.1117/1.OE.59.6.064101
17. M. Guizar-Sicairos, J. R. Fienup, Opt. Express 16, 7264 (2008). https://doi.org/10.1364/OE.16.007264
18. P. Thibault et al., Science 321, 379 (2008). https://doi.org/10.1126/science.1158573
More about the authors
Manuel Guizar-Sicairos works as a beamline scientist for the coherent small-angle x-ray scattering beamline at the Swiss Light Source, part of the Paul Scherrer Institute, in Villigen, Switzerland. He has developed algorithms and applications for x-ray ptychography and nanotomography since 2008. Pierre Thibault is a full professor at Italy’s University of Trieste, where he works on the development of x-ray ptychography and other high-resolution, coherence-based imaging and tomography techniques.


