Probing the accelerating universe
DOI: 10.1063/PT.3.2346

Two teams of astronomers studying distant supernovae stunned the physics world in 1998 when they announced evidence that the expansion of the universe is speeding up. 1 That remarkable discovery, since confirmed by other observations, was awarded the 2011 Nobel Prize in Physics (see Physics Today, December 2011, page 14 ). In the 15 years since the discovery, astronomers have taken a number of approaches to more precisely measure the parameters that define that acceleration and other aspects of the now-standard concordance model of cosmology.
Yet the question of why the expansion of the universe is accelerating remains a mystery. According to general relativity (GR), gravity’s attraction should slow the expansion over time, just as it slows the upward motion of a ball thrown from the surface of Earth. To explain cosmic acceleration, physicists are faced with two possibilities: Either 70% of the universe exists in an exotic form—now called dark energy—that exhibits a gravitationally repulsive force, or GR must be replaced by a new theory of gravity on cosmic scales. If dark energy is the culprit, it could be the constant energy density of the vacuum—equivalent to Einstein’s cosmological constant. But dark energy could also be a new, dynamical component of the universe, one whose properties evolve over cosmic history. 2
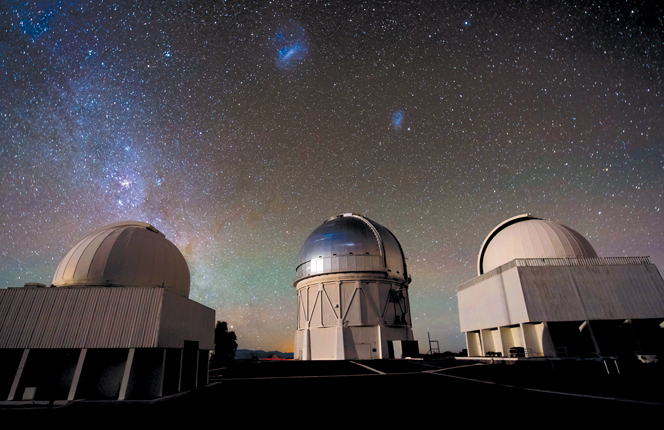
The Dark Energy Survey (DES) is designed to address the fundamental question of the accelerating expansion of the universe and to help uncover the nature of dark energy. It will do so by measuring with unprecedented precision the 14-billion-year history of cosmic expansion and the growth of large-scale structure. Nearly 300 physicists and astronomers from 25 institutions in the US, Brazil, Germany, Spain, Switzerland, and the UK make up the DES collaboration. 3 During the past several years, the team built an extremely sensitive, 570-megapixel digital camera—the Dark Energy Camera (DECam)—to carry out the survey. In 2012 the DECam was mounted on the 4-meter Victor M. Blanco Telescope at the National Optical Astronomy Observatory’s Cerro Tololo Inter-American Observatory, high in the Chilean Andes (see figure 1). Incidentally, the Blanco Telescope obtained much of the supernova data that led to the discovery of cosmic acceleration.

Figure 1. The Victor M. Blanco Telescope (in the building with the silver dome) sits between two other telescopes at Cerro Tololo Inter-American Observatory in the Chilean Andes. The Large and Small Magellanic Clouds, satellites of the Milky Way, are visible above the Blanco; the Milky Way is to the left. (Courtesy of Fermilab Visual Media Services.)
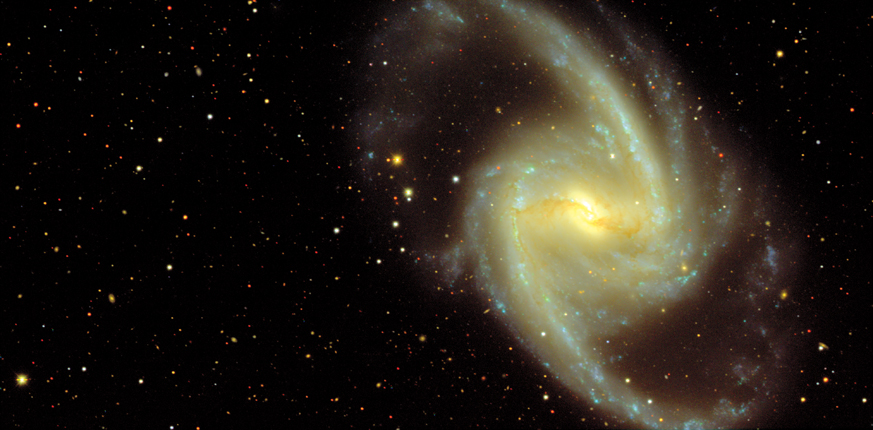
The DECam took its first snapshots of the night sky on 12 September 2012; figure 2 shows a small part of one of the first images it obtained. On 31 August 2013, DES officially began to survey a large swath of the southern sky out to vast distances. The survey will run from September to February for each of five Chilean summers—525 nights in total—and should yield a map of about 200 million galaxies, covering one-eighth of the sky. In addition, roughly every six nights, the camera will be trained on the same 10 patches of the sky to discover and measure light curves for an estimated 3500 supernovae, a sample roughly 100 times as large as that used in the cosmic acceleration discovery.

Figure 2. The galaxy NGC 1365 in the Fornax galaxy cluster is one of the first objects imaged with the new Dark Energy Camera. This photograph was obtained from just 1 of the 62 primary 8-megapixel CCDs in the camera’s focal plane.
In many ways, DES will serve as a successor to the extraordinarily productive Sloan Digital Sky Survey, which used a 2.5-meter telescope in New Mexico, and as a precursor to the Large Synoptic Survey Telescope, which will use an 8.4-meter telescope on neighboring Cerro Pachón and is expected to start survey operations in 2023. Unlike both of those dedicated facilities, however, the DECam is also available for astronomers around the world who want to carry out their own observations.
Dark energy and cosmic acceleration
The distribution of galaxies and the near isotropy (lack of directional dependence) of the cosmic microwave background indicate that the universe is nearly homogeneous and isotropic on large scales. In that case, the cosmic expansion is completely described by a single function, the scale factor a(t). Moreover, the physical separation between any pair of galaxies is, on average, proportional to a. Due to the cosmic expansion, light emitted by a galaxy has its wavelength shifted to the red. The relative change, or redshift, z ≡ Δλ/λ is also completely determined by the scale factor: z = 1/a(t) − 1, where t is the time at which the light was emitted and a is normalized to unity today.
For a homogeneous and isotropic universe, the Einstein equations of GR reduce to a dynamical equation for the scale factor, 4

The sum is over all particle or energy species in the universe—baryons, photons, neutrinos, dark matter, dark energy, and so forth. The energy density of species i is ρi and its pressure is pi = wiρi; G represents Newton’s gravitational constant. If all species have positive pressure, the second time derivative of the scale factor is negative: Gravity causes the expansion to decelerate. If we could monitor the recession speed of a galaxy, we would see it gradually decrease over time.
In the GR framework, an accelerating cosmic expansion requires a component that dominates the other species and that has a sufficiently negative pressure that w < −1⁄3. Indeed, that condition on the so-called equation-of-state parameter w is the defining and peculiar characteristic of dark energy. Alternatively, dark energy need not exist at all. Instead, GR—and along with it, equation
Local conservation of energy implies that the cosmic evolution of the dark-energy density ρDE is determined by the equation-of-state parameter wDE via dρDE/dt + 3HρDE(1 + wDE) = 0; here H is the Hubble expansion rate (da/dt)/a. If dark energy is just the energy of the vacuum or, equivalently, Einstein’s cosmological constant Λ, then wDE = −1 and the energy density doesn’t change. More generally, both wDE and ρDE vary in time.
It is clear from equation
In addition to their impact on cosmic expansion history, the properties of dark energy also influence the growth of large-scale structure in the universe. For the first half of cosmic history, when dark matter was the dominant component, the expansion was slow enough that structures formed and evolved via gravitational instability. Small density fluctuations were amplified as overdense regions gravitationally attracted surrounding matter. Those regions eventually collapsed to form dark-matter halos, within which luminous galaxies formed (see the article by Tom Abel in Physics Today, April 2011, page 51 ). However, once dark energy became dominant, about 7 billion years ago, it began to drive the expansion fast enough that the gravity of dark matter could not pull matter together. New structure formation effectively ceased. Thus, as with the expansion history, measurements of the growth of large-scale structure—the evolution of the clumpiness of the large-scale matter distribution with cosmic time—can help illuminate the nature of dark energy.
In the context of GR, including dark energy, the expansion history of the universe uniquely determines the growth of large-scale structure; in modified gravity scenarios, the relation between expansion and growth can differ. Thus measuring both expansion history and structure growth offers a consistency test for GR and a possible smoking gun for a modified theory of gravity.
Windows onto dark energy
Recent studies of supernovae, 6 the cosmic microwave background, 7 and galaxy clustering 8 have determined the value of the dark energy equation of state parameter to be wDE = −1.027 ± 0.055, assuming wDE is constant. If wDE evolves with time, then its current value is constrained to be w0 = −0.957 ± 0.124 and its recent time evolution to be dwDE/da ≡ −wa = 0.336 ± 0.552. So far, the data are consistent with a cosmological constant, for which w0 = −1 and wa = 0.
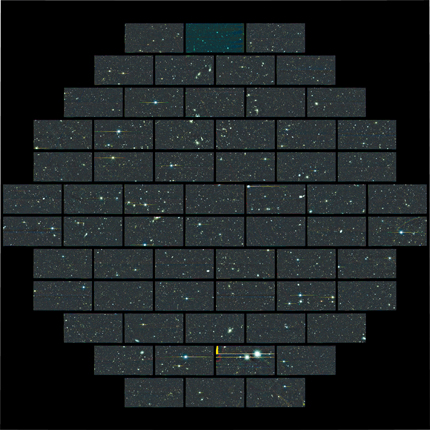
To test the current cosmological paradigm we want to determine the properties of dark energy with better statistical precision and improved accuracy—that is, better control of systematic errors. DES was designed to implement four complementary observational methods that probe different aspects and combinations of expansion history and structure growth. 9 Those methods involve measurements of supernovae, weak gravitational lensing, the abundance of galaxy clusters, and the large-scale galaxy distribution. A 30-square-degree survey that visits 10 different 3-square-degree fields every six nights will discover and provide light curves for supernovae; figure 3 shows one of those fields. The 5000-square-degree main survey will provide data for the other three approaches.

Figure 3. While viewing cosmic fields, such as the one shown here, the Dark Energy Camera (DECam) will spot thousands of supernovae during the course of the five-year Dark Energy Survey (DES). This composite image taken with the DECam during DES science-verification tests in late 2012 shows 1 of the 10 supernova fields that are being imaged every few nights. Evident in it is the geometry of the DECam’s 62 primary rectangular 8-megapixel CCDs. The DECam field of view is 3 square degrees on the sky, roughly 14 times the angular area of the full moon. This image was processed through the DES Data Management system at the National Center for Supercomputing Applications.
Cosmic candles
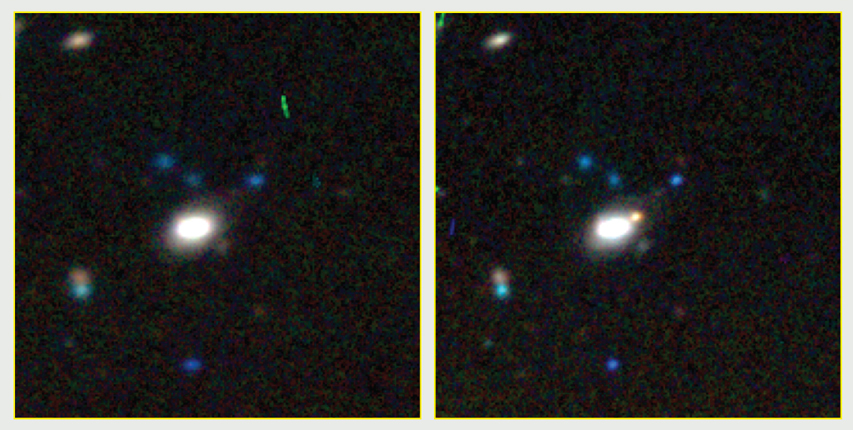
A type Ia supernova, such as that shown in figure 4, results from an explosion of a white dwarf star at or near its maximum possible mass—the Chandrasekhar limit—precipitated by either accretion of mass from a companion star or a merger with another white dwarf in a binary star system. The supernova reaches maximum brightness—comparable to the luminosity of a typical galaxy—about two and a half weeks after the explosion and gradually fades over the next couple of months. The light accompanying a type Ia supernova is powered by the radioactive decays of nickel-56 and cobalt-56; its peak brightness is set roughly by the total mass of 56Ni produced in the explosion.

Figure 4. Supernova explosions stand out against an otherwise unchanging background. These two images, taken by the Dark Energy Camera during the Dark Energy Survey’s late 2012 science-verification tests, bracket the explosion of a supernova—the orange spot seen at the right of the central galaxy in the right-hand photo. A spectrum taken by the OzDES collaboration on 17 December with the Anglo–Australian Telescope confirmed the event to be a type Ia supernova at a redshift of about 0.2.
Type Ia supernovae are standardizable candles. Less luminous type Ia supernovae fade more quickly and are redder than brighter events; after one corrects for those trends, the dispersion in peak brightness is a modest 14%. That means each individual supernova yields a distance estimate with about 7% precision. In principle, a large sample of supernovae spread over a range of distances should enable percent-level or better determination of cosmic distances. In practice, the accuracy of supernova distance estimates is limited by a number of systematic uncertainties. 6 To mitigate those systematic effects, DES will measure high-quality (high signal-to-noise, with frequent time sampling) multiband light curves for several thousand supernovae. Its large sample can be subdivided by different properties for the study and control of systematic effects.
Traditionally, supernovae are classified spectroscopically, and type Ia supernovae are identified primarily by a silicon feature in their spectra. The supernovae that DES will observe will shine relatively brightly for only a couple of weeks and will be very faint even at peak brightness; given their large number, it will be impractical to obtain spectroscopic observations for the majority of them. Thus DES will supplant spectroscopic classification with photometric classification based on the supernovae’s colors and light curves. Simulations and experience with other surveys indicate that the resulting supernova Ia sample will nonetheless be pure enough for us to robustly constrain cosmological parameters. 10 Spectroscopic redshifts for many of the galaxies that host the observed supernovae will be obtained by the OzDES collaboration, which has been awarded 100 nights of observing time on the 3.9-meter Anglo–Australian Telescope over the next several years.
Subtle imprints on the cosmos
Light rays from distant galaxies are bent by the gravitational field of the foreground clumpy distribution of dark matter. That bending leads to a small, correlated distortion, or shear, in the images of those galaxies—an effect known as weak gravitational lensing. (See reference and the article by Leon Koopmans and Roger Blandford, Physics Today, June 2004, page 45 .)
The cosmic shear due to weak lensing by large-scale structure was first reported by several groups in 2000, and it has since been measured in a number of surveys. The cosmic shear signals for source galaxies at different redshifts depend on the relative distances of the source galaxies and the lensing matter and on the clumpiness of the lensing matter distribution; weak lensing therefore probes both the expansion history and the growth of structure. Once DES is completed, it will have measured the correlated distortions of its 200 million galaxies observed at various redshifts. To precisely measure galaxy shapes for weak lensing, the DECam was designed to produce very sharp images of stars and galaxies.
Clusters of galaxies are the largest gravitationally bound objects in the universe. With a mass that can exceed 1015 times the mass of the Sun, a cluster typically contains tens to hundreds of bright galaxies embedded in a massive halo of dark matter. Once the dark-matter and dark-energy contents of the universe are specified, the formation of those massive halos can be accurately predicted with simulations that track the growth of cosmic structure beginning from small-amplitude density perturbations laid down early in the history of the universe. A census of dark-matter halos at different cosmic epochs should therefore help reveal the nature of dark energy.
Since we cannot see dark matter directly, DES will use luminous galaxy clusters as proxies for the dark-matter halos in which they reside. The survey will discover tens of thousands of clusters out to redshifts beyond 1. But for clusters to serve as an effective probe of dark energy, scientists need to associate a cluster’s underlying dark-matter mass with observable quantities such as the number of luminous red galaxies it contains, the luminosity or temperature of its x-ray-emitting gas, or the amount of Compton scattering of cosmic microwave background photons by its hot electrons. 12 (That scattering is called the Sunyaev–Zeldovich effect.) We will correlate optical DES data with multiwavelength data from other surveys—for example, the South Pole Telescope Sunyaev–Zeldovich effect survey. 13 We will also use weak gravitational lensing to calibrate the relations between cluster observables and the masses of the dark-matter halos.
In the early universe, photons and baryons form an ionized plasma and are tightly coupled by Compton scattering. Gravitational attraction of the baryons drives overdense regions to become denser, but the radiation pressure of the photons resists clumping. The competition between the two effects sets off so-called baryon acoustic oscillations (BAOs) in the photon–baryon fluid (see the article by Daniel Eisenstein and Charles Bennett, Physics Today, April 2008, page 44 ). In time, the protons in the plasma combine with the electrons to form neutral hydrogen; baryons and photons are no longer coupled and the BAOs become frozen in place. The characteristic length scale of those frozen oscillations, about 150 megaparsecs, is set by the sound horizon—that is, the distance that acoustic waves had traveled by the time of decoupling. That scale is manifest in the spatial distribution of galaxies as a slight preference for pairs of galaxies to be separated by that characteristic distance rather than by other comparable distances.
The BAO scale provides a standard ruler for measuring cosmic distances and the expansion history. Over the past decade, the BAO imprint has been detected in several galaxy redshift surveys. 8 , 14 It and more general features of large-scale structure will be observed by DES in the angular clustering of galaxies at various redshifts. As the equation-of-state parameter of dark energy is varied, the apparent angular scale of the BAO feature also changes.
All four probes of dark energy reviewed above will come together under the DES umbrella. They are complementary in their sensitivities to expansion history, structure growth, and systematic errors. The DES collaboration will employ a unified analysis framework to combine the probes, since they provide correlated information. In addition to addressing the nature of dark energy, the DES supernova survey and the data DES collects on hundreds of millions of galaxies, stars, and quasars will enable a broad array of other astrophysical studies. For example, within the DES project, scientists are exploring galaxy evolution, strong gravitational lensing, high-redshift quasars, and, to help illuminate the nature of dark matter, the structure and neighborhood of the Milky Way galaxy. The DES data will be released to the public in stages, and a permanent archive will facilitate scientific exploration.
Enter the DECam
For 50 years the Cerro Tololo Inter-American Observatory (CTIO) has operated telescopes in the Andes mountains of northern Chile. Cerro Tololo is an excellent astronomical site, with dark skies, a high fraction of clear nights, and generally smooth atmospheric conditions. With a primary mirror 4 meters in diameter, the Blanco Telescope, completed in 1976, is the largest telescope at the site.
In late 2003 the newly formed DES collaboration proposed to build the DECam and to deploy it on the Blanco to carry out a deep, wide-area survey probing dark energy and cosmic acceleration. The US Department of Energy and NSF, augmented with substantial support from the participating institutions and foreign agencies, funded construction of the camera, its data management system, and a number of telescope upgrades.
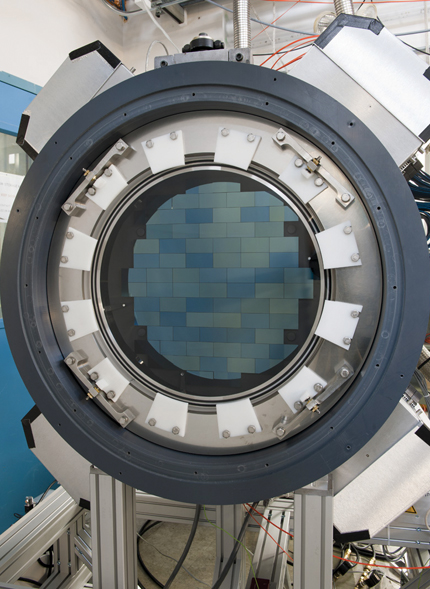
The heart of the DECam, 15 shown in figure 5, is a 570-megapixel imager comprising 74 CCDs. The science array includes 62 of those CCDs, each with 2048 × 4096 pixels. The remaining 12 CCDs, each with 2048 × 2048 pixels, lie at the edges of the focal plane and are used for guiding, focus, and alignment. The silicon CCD devices are 250 µm thick and have much better quantum efficiency for red and near-IR light than do conventional, thin CCDs. That efficiency boost enables DES to measure properties of galaxies and supernovae at redshifts near 1 at a much faster rate than previously possible.

Figure 5. Individual rectangular CCDs appear as various shades of blue and green in this image of the Dark Energy Camera’s focal plane. Also evident in the corners of the photograph are four thermally controlled crates housing the electronics for CCD readout and control. The entire focal plane, roughly a half-meter across, sits in a vacuum vessel cooled by liquid nitrogen. (Courtesy of Fermilab Visual Media Services.)
Nothing quite like the DECam, with its large focal plane of novel CCDs, had ever been made before. So the collaboration constructed a full-scale prototype of the imager and used it to test various aspects of the design. At Fermilab, we also built a two-story-high telescope simulator, which comprised two large, concentric steel rings mounted on a large frame via pivot points. The rings, to which the DECam was attached, were built to the same dimensions as the rings at the top end of the Blanco Telescope and could be rotated to different orientations. With that setup, we could extensively test the installation and operation of the DECam before we shipped the apparatus to Chile.
To obtain the sharpest possible images, the DECam must be kept in focus and its focal plane precisely aligned with the primary mirror. To that end, eight of the CCDs on the edges of the field of view are mounted slightly above or below the focal plane. On those CCDs, stars appear as out-of-focus “donuts,” which are analyzed in real time to determine the best focus and alignment. Before the next image is taken, the system is mechanically positioned into alignment and focus.
Other key components of the DECam include a five-lens optical corrector, a high-precision mechanical shutter that provides a uniform exposure time over the focal plane, and a filter changer capable of holding eight filters. DES uses five different filters that cover wavelengths from 300 nm to 1000 nm; their transmission as a function of wavelength is nearly constant across the focal plane. Remarkably, the filters were produced in Japan only months after the devastating tsunami of 2011. DES observations are coordinated by an automatic controller that takes into account current conditions and recalls which parts of the survey region have already been observed. It then decides where the DECam should look next and which filters should be used.
Galaxy redshift estimates rely on precise determinations of galaxy colors, which are obtained via measurements of the relative fluxes of galaxies in the different wavelength bands. Precision photometry is also critical to estimating the brightness and distance of supernovae. On very cloudy nights, when the telescope dome remains closed, a state-of-the-art photometric system calibrates how much of the light impinging on the telescope gets recorded by the CCDs as a function of wavelength and position in the focal plane. In addition, before each nightly observing session, broadband light sources are employed to monitor changes in pixel response across the CCD array.
Another important ingredient in calibrating DES data is a knowledge of cloud cover on viewing nights. To that end, DES collaborators built a new robotic IR camera, RASICAM, which is now installed and operating at the CTIO mountaintop.
While the DECam was being built, the observatory staff at CTIO worked to improve the telescope and its support systems. They replaced the radial supports for the primary mirror and modernized the telescope control system to facilitate guiding and tracking on the sky. In addition, they improved control of the thermal environment of the telescope, and further enhancements are under way.
Finishing touches
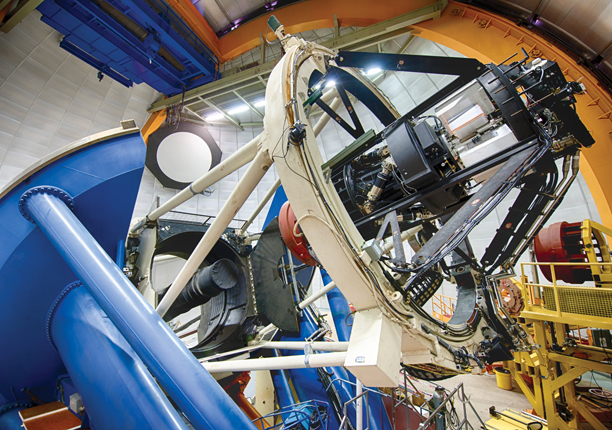
The installation of the DECam was a careful, lengthy process. In February 2012 the primary mirror of the Blanco Telescope was removed, and scaffolding was erected on the telescope for those carrying out the installation. The old prime focus cage was removed, and a new one, which houses the DECam, was put in place in early May. During the northern summer, workers dressed the telescope with electrical cables and cooling lines that must move smoothly as the telescope searches the sky. In September the imager was fitted on the Blanco and cooled down. Figure 6 shows the DECam fully installed.

Figure 6. Mounted at the prime focus of the Victor M. Blanco Telescope is the Dark Energy Camera (DECam), the long cylindrical object extending up and to the right from the red end cap at the center of the image. In this fish-eye view, the 4-meter-diameter primary mirror, surrounding a cylindrical black chimney-like structure, is to the lower left of the DECam. Light from the sky reflects off the mirror and passes through the DECam’s optical-corrector lenses (inside the black barrel partially hidden by the white top-end rings) before arriving at the camera’s CCD focal plane. Three arms of the supporting hexapod outside the barrel are also visible just to the right of the top-end rings. The imager electronics crates are at the upper right, just below the DECam’s black end cap. The blue tubes and backing are part of the telescope support structure. (Courtesy of Fermilab Visual Media Services.)
The DECam took its first images of the sky on 12 September 2012. Then the DES team, working closely with CTIO, carried out several months of science-verification observations to assess whether the system met the science requirements for the survey. In the course of those observations, DES imaged several hundred square degrees of sky out to depths about as far as it will map in the full five-year survey; verification runs also exercised the supernova survey. During the science verification period and shortly after, DES and CTIO scientists improved the telescope and camera system with numerous tweaks and some more substantial improvements. At present, the collaboration is analyzing the science-verification data, which will form the basis for the first DES science publications this year.
The five-year survey officially began on the night of 31 August 2013, and the first 105-night season ended on 9 February 2014. In its first season, DES covered a roughly 2000-square-degree patch of sky. It observed that patch four times in each of the five filters and thus obtained multiband images for tens of millions of galaxies. The supernova survey visited its 10 supernova fields about once a week and discovered hundreds of type Ia supernovae. The next major step in the hunt for dark energy and the origin of the accelerating universe is well under way.
References
1. A. Riess et al., Astronom. J. 116, 1009 (1998); https://doi.org/10.1086/300499
S. Perlmutter et al., Astrophys. J. 517, 565 (1999). https://doi.org/10.1086/3072212. For a review, see J. Frieman, M. S. Turner, D. Huterer, Annu. Rev. Astron. Astrophys. 46, 385 (2008). https://doi.org/10.1146/annurev.astro.46.060407.145243
3. A complete list of the DES institutions is available at http://www.darkenergysurvey.org .
4. An excellent text is S. Dodelson, Modern Cosmology, Academic Press/Elsevier, San Diego, CA (2003).
5. L. Amendola, S. Tsujikawa, Dark Energy: Theory and Observations, Cambridge U. Press, New York (2010);
R. Caldwell, M. Kamionkowski, Annu. Rev. Nucl. Part. Sci. 59, 397 (2009). https://doi.org/10.1146/annurev-nucl-010709-1513306. M. Betoule et al., arXiv:1401.4064 .
7. P. A. R. Ade et al. (Planck collaboration), arXiv:1303.5076 .
8. L. Anderson et al., Mon. Not. R. Astron. Soc. 427, 3435 (2012); https://doi.org/10.1111/j.1365-2966.2012.22066.x
L. Anderson et al., arXiv:1312.4877 ;
F. Beutler et al., Mon. Not. R. Astron. Soc. 416, 3017 (2011); https://doi.org/10.1111/j.1365-2966.2011.19250.x
N. Padmanabhan et al., Mon. Not. R. Astron. Soc. 427, 2132 (2012). https://doi.org/10.1111/j.1365-2966.2012.21888.x9. D. H. Weinberg et al., Phys. Rep. 530, 87 (2013). https://doi.org/10.1016/j.physrep.2013.05.001
10. J. P. Bernstein et al., Astrophys. J. 753, 152 (2012). https://doi.org/10.1088/0004-637X/753/2/152
11. H. Hoekstra, B. Jain, Annu. Rev. Nucl. Part. Sci. 58, 99 (2008). https://doi.org/10.1146/annurev.nucl.58.110707.171151
12. S. W. Allen, A. E. Evrard, A. B. Mantz, Annu. Rev. Astron. Astrophys. 49, 409 (2011). https://doi.org/10.1146/annurev-astro-081710-102514
13. South Pole Telescope, http://pole.uchicago.edu/spt .
14. B. Bassett, R. Hlozek, in Dark Energy: Observational and Theoretical Approaches, P. Ruiz-Lapuente, ed.,Cambridge U. Press, New York (2010), chap. 9.
15. B. Flaugher et al., in Ground-based and Airborne Instrumentation for Astronomy IV, I. S. McLean, S. K. Ramsay, H. Takami, eds., SPIE, Bellingham, WA (2012), no. 844611.
More about the authors
Josh Frieman is a scientist at the Fermi National Accelerator Laboratory in Batavia, Illinois; a professor of astronomy and astrophysics in the Kavli Institute for Cosmological Physics at the University of Chicago; and the director of the Dark Energy Survey.


