Phase-transition dynamics in the lab and the universe
DOI: 10.1063/1.2784684
This is a story of a remarkable cross-fertilization of fields. Ideas that originated in speculations about phase transitions in the early universe have led to some very exciting and innovative laboratory experiments on a wide variety of small-scale systems. And although significant puzzles remain, a consistent picture of the dynamics of phase transitions seems to be emerging. The ideas from cosmology stimulated an interest in rapid phase transitions, in contrast to previous work that emphasized ideal near-equilibrium behavior.
Our story starts with the search for grand unification. One of the great triumphs of particle physics was the successful unification 40 years ago of weak and electromagnetic interactions, for which Sheldon Glashow, Abdus Salam, and Steven Weinberg received the 1979 Nobel Prize. Their electroweak theory involves what’s known as a spontaneously broken gauge symmetry. At high energy, an underlying symmetry relates the photon, the carrier of the electromagnetic interaction, to the W and Z bosons that mediate the weak interaction. But that symmetry is hidden at low energy because spontaneous symmetry breaking gives a large mass to the W and Z particles, leaving the photon massless. Low energy here means below about 100 GeV, the rest energy of the W or Z bosons—about 100 times the rest energy of a proton.
The natural next step was to try to extend the electroweak theory to include the strong interactions. In the 1970s researchers suggested that an even larger underlying symmetry exists between the carriers of the three interactions, but that it is again hidden at moderate energies by spontaneous symmetry breaking. Good evidence points in that direction: The strengths of the interactions vary slowly—that is, logarithmically—with energy, and if extrapolated to very high energies, all three appear to approach a common value at a gargantuan energy scale of roughly 1016 GeV. The trend strongly suggests that something interesting happens there. We might expect that as the universe expanded and cooled after the Big Bang, it underwent a sequence of very early phase transitions, with critical temperatures corresponding to that energy scale and others.
More recently, physicists have been trying to bring gravity into the unified scheme as well, perhaps via superstring theory or its modern version, M-theory. Superstrings have intriguing connections to the ideas discussed here—but that is another story.
Looking for defects
Symmetry-breaking phase transitions are ubiquitous in physics. For example, when water freezes, the rotational symmetry is broken by the choice of an orientation in the ice crystals. And the atomic ordering of the crystals is often flawed—for instance, at regions where different crystals meet. In the early universe too, symmetry breaking may have led to the formation of topological defects such as pointlike monopoles, linear cosmic strings, or planar domain walls. (See the
Monopoles used to be a serious problem for theorists. They appear in almost all grand unified theories and should have survived in numbers far larger than allowed by observational bounds. But in 1981 MIT’s Alan Guth and others solved the problem by postulating the idea of inflation—a rapid, accelerating expansion of the universe that effectively diluted the number of monopoles that could be seen. Inflation, which solves several other problems as well, is now a widely accepted part of the standard cosmological model. Domain walls can also be ruled out observationally.
Cosmic strings have some attractive features. They cannot break, although when two strings touch they can reconnect and sometimes form closed loops that gradually shrink and disappear. If they were formed after any period of inflation, as many models suggest, strings could have survived in sufficient numbers to display interesting effects. In the 1980s researchers were particularly excited about the suggestion that cosmic strings might explain the small primordial density perturbations from which galaxies and galaxy clusters eventually grew. Unfortunately, that nice idea didn’t work. Observations by COBE and more recently by WMAP of the small anisotropy in the cosmic microwave background reveal a preferential distance scale that cosmic strings cannot explain. It is now generally believed that the origin of the density perturbations can be traced to quantum fluctuations during inflation; cosmic strings or other defects cannot contribute more than 10% to the total density perturbations. Nevertheless, they may still exist and have other interesting effects; in particular, they may emit observable and very characteristic gravitational-wave signals.
Fortunately, analogues of cosmic strings exist in many condensed-matter systems, including vortices in superfluids, magnetic flux tubes in superconductors, and certain defects in liquid crystals. The simplest kind of theory in which the string analogues appear is one that contains a complex “order-parameter” field ϕ (see the
A string, or any of its analogue defects, is a thin tube around which the phase of ϕ changes by 2π. In He, the superfluid velocity is proportional to the gradient of the phase, so a quantized circulation exists around the vortex. In a superconductor, it is the magnetic flux along the tube that is quantized.
If a similar order-parameter field existed in the early universe, as postulated in many models, then we could expect that as the universe cooled through the transition, ϕ would have become nonzero. It then had to choose a direction for the symmetry to break—a random choice of phase. But in a large system like the universe, that choice must have been made independently in widely separated regions for reasons of causality. The random choices would sometimes result in the phase varying around a loop by 2π or some multiple of it. In either case there must be a string or strings, along which ϕ vanishes, that thread the loop. So, as I pointed out in 1976, after the phase transition we can expect to find a random tangle of cosmic strings. 1
One problem that arose in trying to make predictions about cosmic strings was to estimate how many there would be. A random choice of phases should lead to a random tangle of strings, characterized by some typical length scale ξ—roughly speaking, the typical separation between strings—that can grow as the system evolves in time. But how is that initial scale determined? And how, in particular, is it related to the rate at which the system goes through the transition? Causality again seems to be the key. Information about the choice of phase certainly cannot propagate faster than the speed of light. At a temperature just below the transition, the newly created strings are very fat and effectively overlap. They become thinner as the temperature falls. So the important time is when the distance over which phase information can propagate reaches the typical thickness of a string at that temperature. Then the strings have an individual identity and can be counted.
Spontaneous symmetry breaking
A simple example of spontaneous symmetry breaking can be found in a theory described by a single complex scalar field ϕ, with a potential energy function of the form V = λ(|ϕ|2 − η 2)2, where λ and η are constants. This “sombrero” potential (a) is symmetric under phase rotations, ϕ → ϕ eiα , which are rotations about the vertical axis in the figure. But the symmetric point ϕ = 0 is a maximum. The minima occur around the circle |ϕ| = η. Each point on the circle represents a different ground state, but because of the symmetry, they all have the same energy.
In such a model, there is a phase transition at a critical temperature T c that depends on the parameters of the potential. At high temperature, in which thermal fluctuations are large enough to push ϕ over the central hump of the potential, the average value of ϕ in equilibrium will be zero. But when the temperature falls below T c and fluctuations over the hump are rare, the field settles into the valley of the potential and must choose a phase α—that is, a direction—in which to break the symmetry. In a large system, the choice must be made independently in widely separated regions. It can happen that the phase changes by 2n π with some nonzero value of n around some large loop traced in space. In that case, continuity arguments tell us that the loop must be threaded by at least one tube (b) along whose core ϕ vanishes. That tube is a vortex or cosmic string. The string width, the distance over which |ϕ| varies from 0 at the core to the value η that minimizes the potential energy, is determined by an energy balance between the energy costs of climbing over the central hump of the potential and of spatially varying the field ϕ.

From cosmos to lab
In 1985 Wojciech Zurek at Los Alamos suggested that ideas about how to calculate ξ could be tested by applying them to the problem of defect formation in a low-temperature phase transition—in particular the normal-to-superfluid transition in liquid helium. 2 The relevant speed is not the speed of light but some characteristic speed of the system; in the case of He, it is the speed of “second sound,” a thermal wave in which the normal and superfluid components oscillate 180° out of phase. Zurek showed that in a continuous (that is, second-order) transition, a power-law relation could be obtained between ξ and the “quench time” τ q. In other words, ξ ∝ τ q σ , where τ q is defined so that the rate of temperature change at the critical point is dT/dt = −T c/τ q and the index σ can be calculated in terms of known critical indices of the phase transition. Essentially, τ q is the time taken for the system to pass through a phase transition.
In the simplest case, where the effect of interactions on any particular atom can be described by a mean field representing the effects of all the others, the index σ is
That way of estimating ξ (or equivalently the length of string per unit volume, which is proportional to 1/ξ 2 or τ q −2σ ) has now been tested in various systems.
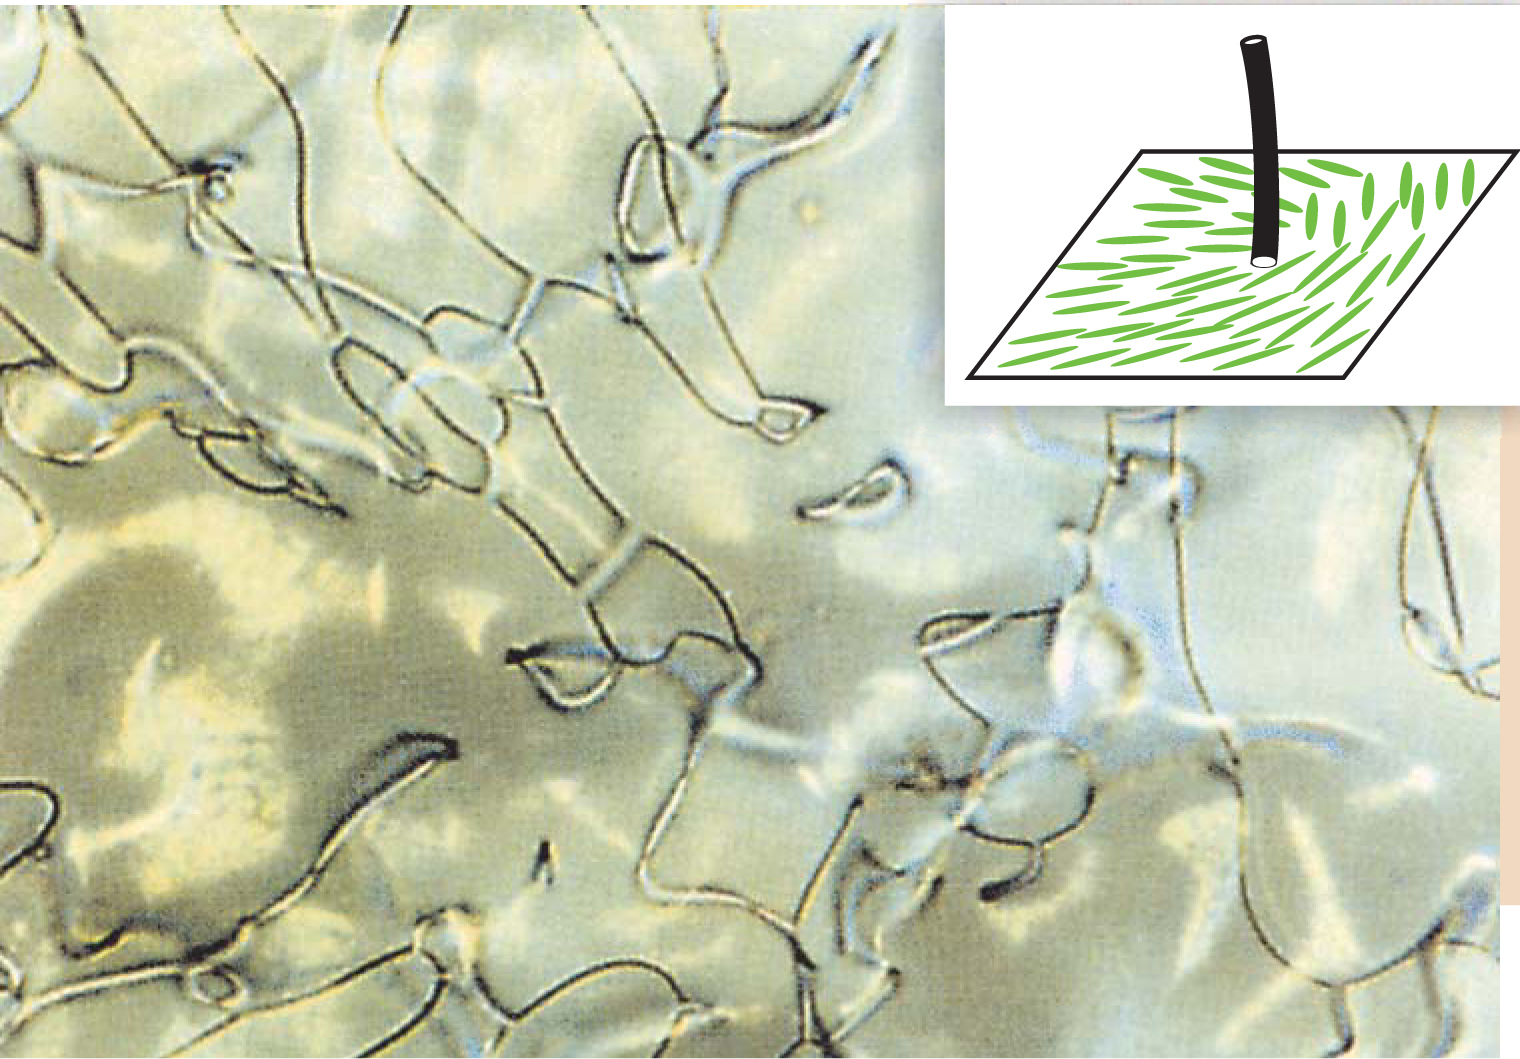
The first experiments to demonstrate that a rapid transition would lead to the formation of a random tangle of linear defects were actually performed on nematic liquid crystals formed of rod-shaped molecules that like to line up parallel with each other. Their defects are known as disclinations, around which the preferred orientation of the molecules rotates by 180°. One of the virtues of experiments on nematic crystals is that one can see the defects directly, 3 as pictured in figure 1. The transition through which the defects form, however, is actually a first-order transition. For that kind of transition, the theory is somewhat different, and the researchers did not attempt to test the dependence of the defect number density on τ q.

Figure 1. This tangle of defects was produced in a nematic liquid crystal—essentially a fluid of rodlike molecules—by rapidly lowering the temperature through a critical point. The dark lines are disclinations, defects around which the rods rotate (see inset). Various types of surface defects are also shown. The width of the frame is 790 μm.
(Adapted from ref. 3.)
Strings and helium
Ironically, one type of system for which the test has not succeeded is the superfluid transition in 4He. Physicists at the University of Lancaster in the UK used a sample of liquid He just above its critical temperature in a chamber that could be rapidly expanded. The expansion lowered the pressure enough to push the sample into the superfluid state. To find the density of vortices, they measured the attenuation of second sound, which is strongly absorbed by vortices. The first results, in 1994, seemed to show evidence of vortex formation but were inconclusive because the vorticity might have been formed by other mechanisms, in particular turbulence generated by the injection of fluid during the expansion process. The experimental design was improved to avoid those problems, but the improved experiment, reported in 1998, showed no sign of vortex formation. It is now generally believed that the vortices simply disappear too quickly to be seen.
The story is very different, however, for experiments with the lighter isotope, 3He. This is an absolutely fascinating material, which becomes superfluid at a much lower temperature, around 2 mK. It exhibits three distinct superfluid phases (3He-A, 3He-B, and a third in the presence of a magnetic field) with different symmetry properties and a rich family of defects. Among the vortices found in the B phase are ones similar to those in 4He, but much fatter. Although it requires working at ultralow temperatures, 3He has several advantages. One is that a 3He atom readily absorbs a slow neutron via the reaction n + 3He → p + 3H, releasing 764 keV of energy. Here, n represents a neutron and p a proton. Two experiments (published in the same issue of Nature in 1996) both used this reaction. 4,5 The absorption of a neutron in a sample of superfluid 3He heats a small region of the fluid to above the critical temperature. The fluid then cools back through the transition, generating a tangle of vortices as it does so.
In other respects the two experiments were quite different. One, performed at the CNRS Center for Research on Ultra-Low Temperatures in Grenoble, France, by Yuriy Bunkov, Henri Godfrin, Shaun Fisher, and others, was essentially a calorimetry experiment. 4 The group used a sample at ultralow temperature, about 0.1 T c, and an innovative oscillating-wire technique to measure the total thermal energy liberated after neutron absorption. The energy was found to be in the 600- to 650-keV range, with another 50 keV lost in UV radiation. But that still leaves an energy deficit, and vortices seem to be the only possible form in which that energy can reside. The energy retained in the liquid is in good agreement with Zurek’s prediction.
The other experiment, performed at the Helsinki University of Technology by Matti Krusius, his student Ville Ruutu, and others, featured a rotating cryostat. 5 Because the superfluid velocity is proportional to the gradient of the phase of ϕ, the flow of superfluid is irrotational. The only way the superfluid can support rotation is to form vortices, within which the superfluid density falls to zero. If the cryostat is spun rapidly, vortices form at the wall and line up in a cluster parallel to the rotation axis. However, if it is rotated more slowly, below a critical angular velocity, then no vortices form and the system exhibits a remarkable behavior: The normal fluid rotates with the container, but the superfluid component remains completely stationary.
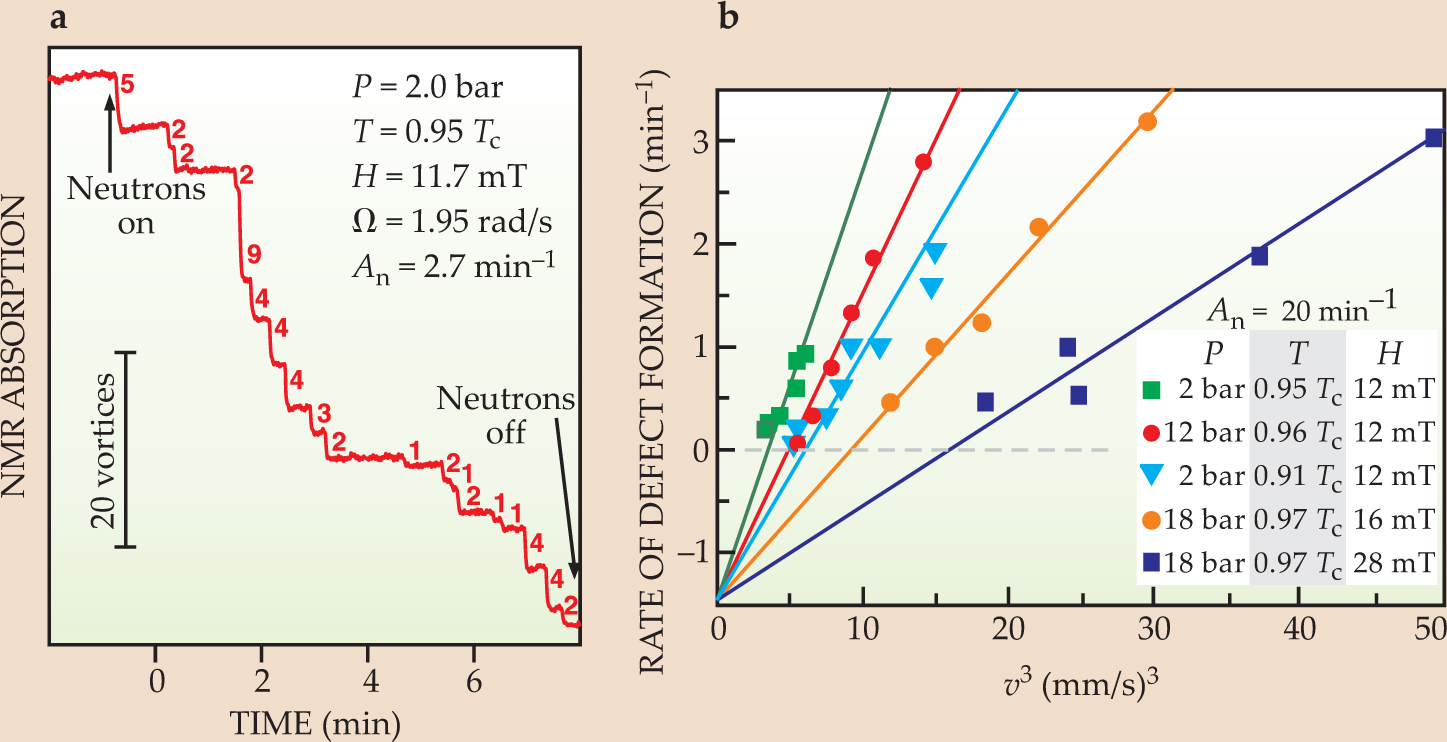
When vortices are formed following a subsequent neutron absorption event, the differential velocity between the two components subjects the vortices to a transverse “Magnus force.” Without rotation, the vortices would quickly disappear, but the Magnus force can make them expand and move into a central cluster where they can actually be counted. Because the 3He nucleus has a nonzero spin, the vortices produce a distinctive nuclear magnetic resonance signature sufficiently pronounced to allow one to clearly see even individual vortices join the cluster (see figure 2).

Figure 2. The nucleation of vortices during neutron absorption in superfluid helium-3. (a) Each downward step in this nuclear magnetic resonance trace marks a neutron absorption event, which heats a small region to above the critical temperature T c. The height of each step is a measure of the number of vortices formed as the fluid cools back through T c. In the experiment, the cylinder is held at a pressure P, temperature T, and magnetic field H and rotated at an angular velocity Ω; A n is the neutron absorption rate. (b) The rate of vortex formation is plotted against the cube of the cylinder’s rotation velocity v for various values of the bulk temperature, pressure, and magnetic field. Theory predicts a linear dependence on v 3, with a common intercept at approximately -1.4 min−1.
(Courtesy of Volodya Eltsov and Matti Krusius.)
Both of those experiments clearly showed that vortices are formed. But they could provide only indirect evidence about the dependence of the vortex density on the quench rate because only small changes in the rate could be achieved by varying external parameters such as background temperature and pressure.
Twisted light and liquid
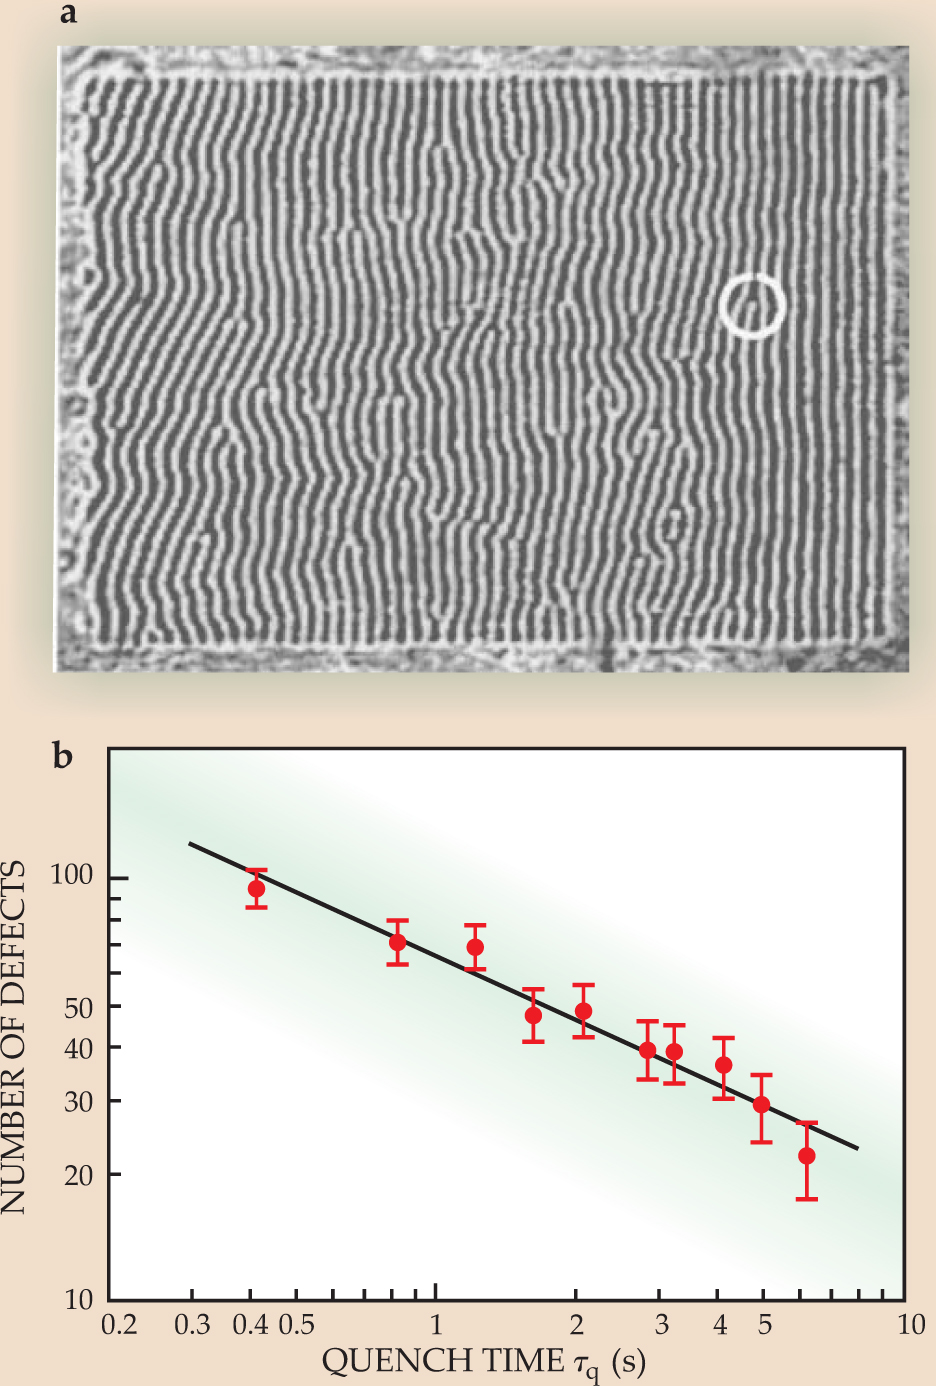
In other systems, more direct control of the quench rate can be achieved. An example is a nonlinear optical system made up of a liquid-crystal light valve that is inserted in a feedback loop and illuminated by a laser beam. The light valve acts as an optical Kerr medium. This means that the beam reflected from the front face of the valve undergoes a phase retardation proportional to the beam’s intensity on the rear face. Once the intensity exceeds a critical level, a self-sustaining diffraction pattern forms in the shape of stripes. Occasional defects become evident as points in the 2D pattern where wave peaks merge or separate, as pictured in figure 3. In such a system, it is easy to control the rate at which the laser intensity is ramped up. In 1999 a nice experiment by Tito Arecchi, his student Sara Ducci (both at the National Institute of Applied Optics in Florence, Italy), and others showed that the number density of defects formed was, to good accuracy, proportional to τ q −1/2, in line with Zurek’s prediction. 6

Figure 3. This light intensity pattern (a) in a nonlinear optical system reveals defects such as the one circled in the frame. (b) The plot shows the trend in defect number as a function of various values of the quench time τ q — roughly, the time taken for the system to pass through a phase transition. The counting is done for a series of phase transitions at the moment when the intensity reaches a final value. The straight line is a best fit to the predicted power-law behavior for the number of defects produced, N = N 0 τ q −a, with a = 0.5 ± 0.04.
(Adapted from ref. 6.)
Another intriguingly different example is a fluid undergoing the conduction–convection transition. As the rate of heating is increased above a certain point, conduction is replaced by convective cells, in which rising plumes form a hexagonal pattern. In the case of rapid heating, many “penta–hepta” defects form in the pattern; those are points where neighboring plumes have five and seven nearest neighbors rather than the standard six. Here again, τ q is easy to control by varying the rate of heating. An experiment at the University of Navarra in Spain showed a power-law dependence of the defect density on the heating rate,
7
with an exponent of −0.27 ± 0.05. The researchers point out that that does not agree with the Zurek mean-field prediction of −
Defects in superconductors
Several experiments have now been performed on superconductors, although theoretically the situation is more complicated and more ambiguous than for superfluids. The first experiments were on thin films of high-temperature superconductors, performed at the Technion–Israel Institute of Technology. The film was heated above the critical temperature by shining a light on it, and it was then allowed to cool back through the phase transition. The resulting defects are called fluxons and antifluxons, tubes of quantized magnetic flux that pass through the film in one direction or the other. There is no easy way to measure directly the total number of defects, N = N + + N −, where N + and N − are the numbers of fluxons and antifluxons, respectively. So researchers instead measured the total magnetic flux–that is, the net defect number ΔN = N + − N −. With a cooling rate of around 20 K/s, the first experiments, reported in 1999, gave no evidence of defect formation. But later, in 2003, Emil Polturak, his student Ariel Maniv, and Gad Koren published the results of another experiment with the much faster cooling rate of order 108 K/s, in which fluxons did appear. 8
One disadvantage of measuring ΔN rather than N is that the expected dependence of ΔN on τ q is much weaker. For a sample of area L 2, we expect N to be of order L 2/ξ 2 or proportional to τ q −1/2. But ΔN is equal to the winding number of the phase around the periphery, the total phase change divided by 2π. And if, as we might expect, the phase makes something like a random walk around that circuit, then ΔN should be of order
The interpretation of those experiments is complicated by the fact that the symmetry is a gauge symmetry, which involves not only a scalar order-parameter field ϕ but also the electromagnetic field. In 2001 Mark Hindmarsh of the University of Sussex and Arttu Rajantie, then at the University of Cambridge, showed that two different mechanisms of defect formation operate in a gauge theory—one based on fluctuations of ϕ and another involving fluctuations of the magnetic field, whose relative importance varies according to circumstances. 10 From magnetic fluctuations, one may expect to find sizable clumps containing only fluxons or only antifluxons.
IBM’s John Kirtley and others have confirmed this second mechanism by an experiment on thin-film superconducting rings. 11 The number of fluxons trapped was small, usually no more than one; indeed, the researchers were measuring the probability of trapping a single fluxon. They were able to vary τ q over about five orders of magnitude and found that the defect density depended only very weakly on τ q. That result agrees with a model based on thermal fluctuations in the magnetic flux, as fluxons tunnel into or out of the rings. Kirtley and colleagues argue that under the circumstances of their experiment, any trapped fluxons generated by scalar-field fluctuations would be eliminated by the tunneling.
Interesting experiments have also been performed with Josephson junctions, narrow nonsuperconducting gaps between superconductors that provide a weak linkage between them. One such experiment was performed by the Technion group using an ingenious apparatus with a superconducting loop that contained 214 Josephson junctions in series. When the system is cooled, each of the 214 sections between junctions chooses its own phase, and the phase makes a random walk around the loop. The researchers detected the trapping of flux, but they were not attempting to test the dependence on quench rate; the distance between junctions controlled the density of defects.
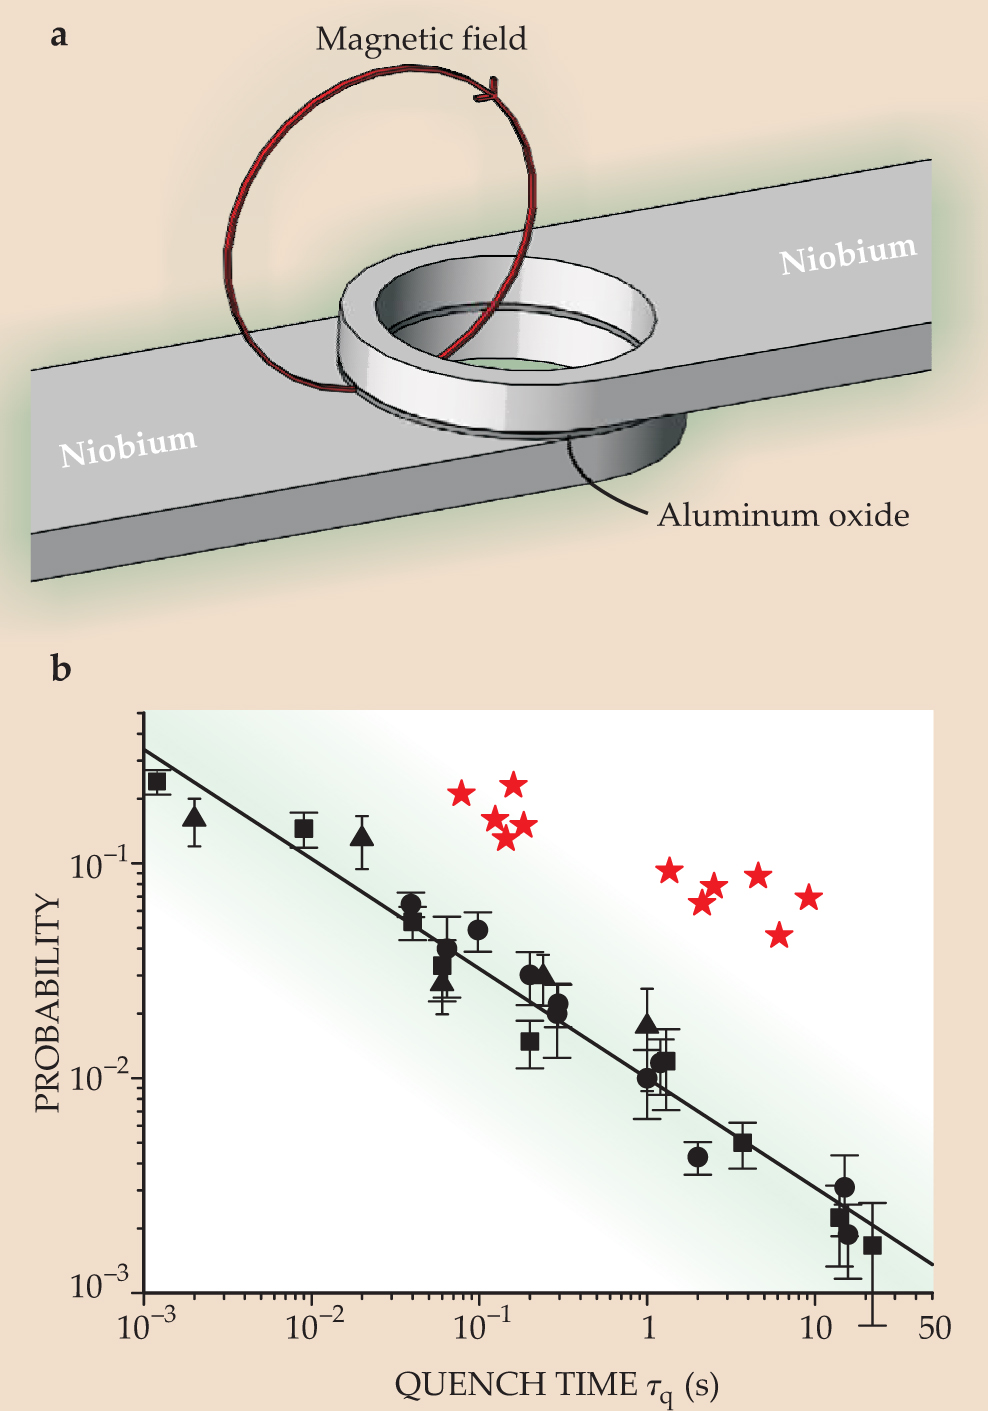
Another series of experiments with Josephson junctions explicitly tested the dependence of defect number on quench rate. Those were done at the Technical University of Denmark by the University of Salerno’s Roberto Monaco and collaborators from Denmark, Imperial College London, and the Institute of Radio Engineering and Electronics in Moscow, where the samples were made. Using annular Josephson junctions, the experiment recorded the flux emerging from the insulating gap between superconductors after the phase transition occurred. As in Kirtley’s experiment, Monaco and collaborators effectively measured the probability of trapping a single fluxon. They, too, were able to vary the cooling rate over a range of more than four orders of magnitude. However, they argued that the Josephson-junction experiment should not be affected by the second flux-trapping mechanism because it measures the flux through a narrow gap. They completed a series of experiments from 2001 to 2006. Initially, the group found a power law τ q −σ , with σ approximately equal to

Figure 4. An annular Josephson junction (a) consists of two superconductors separated by a narrow insulating gap. For these junctions, the topological defect is the fluxon, a superconductor vortex that carries a quantum of magnetic flux in the plane of the gap. The experiment measures the probability of trapping a defect in the gap. (b) That probability is plotted as a function of the quench time, with each point in the data corresponding to many thermal cycles through a superconducting transition. Circles, squares, and triangles represent different samples and are fit to the τ q −1/2 power law. The stars, by comparison, represent data from a previous experiment and yield an exponent value of −0.25; the statistics in that early experiment were poor, however, and insufficient shielding of Earth’s magnetic field may account for the upward shift.
(Adapted from ref. 12.)
BECs and beyond
Another type of system that supports vortices is an atomic gas undergoing a Bose–Einstein condensation. Because those cold gases are very clean and theoretically simple systems, they should provide an excellent test. One problem is the difficulty of cooling them sufficiently rapidly and uniformly. Ludwig Mathey and others from Harvard and Boston universities recently suggested an interesting way around the problem. Although it is hard to vary T rapidly enough, Mathey and company point out that it can be relatively easy to vary T c—and thus the ratio T/T c—in coupled 2D systems by simply varying the strength of the coupling. 13 An IR light source, for instance, can do the job. Alternative approaches would be to use an external magnetic field 14 or to vary the coupling between initially independent condensates. 15
The defect-formation model, developed originally with cosmology in mind, has found remarkably fruitful applications in condensed matter and become an important addition to the general theory of systems far from equilibrium. It is too early to say that we fully understand how the rate at which a system passes through a phase transition affects the number of defects formed. What we can say is that there is good evidence from a wide range of different systems that a rapid phase transition leads to the formation of a random tangle of defects. Where it has been possible to check the dependence of the defect density on the quench rate of the transition, the results have been consistent in most cases with the expected power-law behavior. For systems with gauge symmetries, like superconductors and most models of the early universe, further theoretical work is needed to clarify the role of the different formation mechanisms.
References
1. T. W. B. Kibble, J. Phys. A 9, 1387 (1976). https://doi.org/10.1088/0305-4470/9/8/029
2. W. H. Zurek, Nature 317, 505 (1985). https://doi.org/10.1038/317505a0
3. I. Chuang et al., Science 251, 1336 (1991). https://doi.org/10.1126/science.251.4999.1336
4. C. Bäuerle et al., Nature 382, 332 (1996). https://doi.org/10.1038/382332a0
5. V. M. H. Ruutu et al., Nature 382, 334 (1996). https://doi.org/10.1038/382334a0
6. S. Ducci et al., Phys. Rev. Lett. 83, 05210 (1999). https://doi.org/10.1103/PhysRevLett.83.5210
7. S. Casado et al., Phys. Rev. E 63, 057301 (2001). https://doi.org/10.1103/PhysRevE.63.057301
8. A. Maniv, E. Polturak, G. Koren, Phys. Rev. Lett. 91, 197001 (2003). https://doi.org/10.1103/PhysRevLett.91.197001
9. S. Digal, R. Ray, A. M. Srivastava, Phys. Rev. Lett. 83, 5030 (1999). https://doi.org/10.1103/PhysRevLett.83.5030
10. M. Hindmarsh, A. Rajantie, Phys. Rev. D 64, 065016 (2001). https://doi.org/10.1103/PhysRevD.64.065016
11. J. R. Kirtley, C. C. Tsuei, F. Tafuri, Phys. Rev. Lett. 90, 257001 (2003). https://doi.org/10.1103/PhysRevLett.90.257001
12. R. Monaco et al., Phys. Rev. B 74, 144513 (2006). https://doi.org/10.1103/PhysRevB.74.144513
13. L. Mathey, A. Polkovnikov, A. H. Castro Neto, http://arxiv.org/abs/cond-mat/0612174 .
14. L. E. Sadler et al., Nature 443, 312 (2006). https://doi.org/10.1038/nature05094
15. D. R. Scherer et al., Phys. Rev. Lett. 98, 110402 (2007). https://doi.org/10.1103/PhysRevLett.98.110402
More about the authors
Tom Kibble is a senior research fellow and an emeritus professor of theoretical physics at Imperial College London.
Tom Kibble, Imperial College, London, UK .


