Optical multidimensional coherent spectroscopy
DOI: 10.1063/PT.3.2047
Optical spectroscopists strive to further our understanding of matter by studying how it absorbs and emits light. Starting from Isaac Newton’s use of a prism to observe the spectrum of sunlight, spectroscopic techniques remained fundamentally unchanged for centuries. Light was dispersed—for example, by a prism or diffraction grating—and the intensity measured as a function of wavelength. Variation in the spectral intensity is either inherent in the source or due to the light passing through a medium that absorbed at specific wavelengths. The frequency of an optical absorption or emission was eventually understood as the energy difference between electronic or vibrational quantum states.
At first, spectroscopic measurements were all done in the linear regime, in which the measured signals are proportional to the intensity of the incident light. A new era of optical spectroscopy emerged with the advent of the laser, which can produce light that is no longer weak compared to the internal fields of an atom or molecule. 1 In that nonlinear regime, signals are proportional to a higher power of the laser intensity, and moreover, two laser beams can interact. For example, one strong “pump” beam can saturate an absorption in a sample and thus increase the transmission of a weaker “probe” beam. Alternatively, wavemixing in the sample can generate a “signal” beam with an entirely new direction and frequency.
It is also possible to make measurements as a function not of frequency but of time. Time-domain spectroscopy may be likened to the use of a stroboscope, in that short flashes of light can create stop-action images of a dynamical process such as a chemical reaction or carriers relaxing in a solid. Measurements made in the time domain using laser pulses can be Fourier transformed into frequency-domain spectra. Often, the spectra are functions of multiple time delays and thus are multidimensional. (This article focuses on two-dimensional spectroscopy, but higher-dimensional measurements are also possible.) Multidimensional Fourier-transform methods were developed for nuclear magnetic resonance (NMR) spectroscopy 2 in the 1970s, and they are now transforming the field of ultrafast laser spectroscopy.
Two-dimensional spectroscopy
Any spectroscopic measurement that is plotted as a function of two variables is, in a sense, a 2D spectrum. But the term “2D spectroscopy” is typically reserved for the specific situation described in the
The appeal of 2D spectroscopy lies largely in its ability to dissect ensembles. In the course of time, each member of an ensemble—an atom, molecule, nanostructure, or other absorber—undergoes stochastic evolution, and its properties fluctuate in uncontrollable ways due to coupling with its environment. One-dimensional measurements yield the ensemble average over those stochastic trajectories. But many possible microscopic models, with different types of trajectories, could yield the same ensemble average. Multidimensional spectroscopy probes the members of the ensemble at multiple time points, so it provides more information about their individual trajectories than a 1D spectrum can. A similar goal can be achieved by measuring single particles and isolating their trajectories one at a time, but that approach typically requires much greater effort.
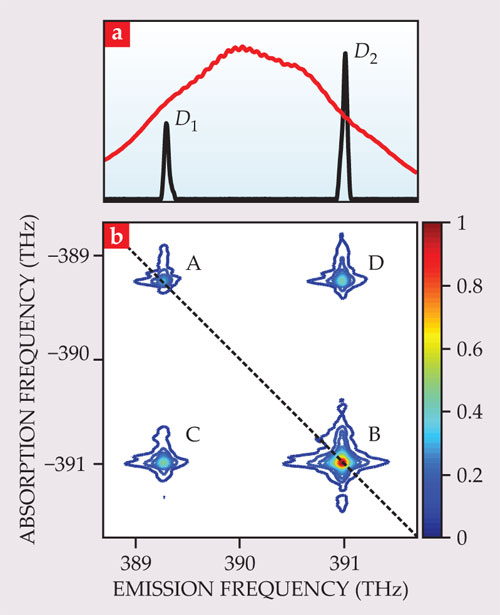
A 2D spectrum can be used to determine if two resonances are coupled or uncoupled. Coupled resonances might occur if some species in the sample has two transitions that share a common state: Excitation of one resonance can directly influence excitation of the other. In contrast, uncoupled resonances might indicate that the sample is a mixture of two species. A 1D spectrum cannot distinguish between coupled and uncoupled resonances. But in a 2D spectrum such as the one in figure 1 (discussed in more detail below), coupled resonances produce off-diagonal cross peaks, with the absorption frequency of one resonance and the emission frequency of the other, whereas uncoupled resonances do not.

Figure 1. Potassium vapor is a simple three-level system for demonstrating two-dimensional spectroscopy. The 1D absorption spectrum (a) shows two peaks, D1 and D2, which result from electronic excitation from the ground state into two different excited states. (The red curve is the laser-pulse spectrum, which is broad enough to excite both transitions.) In the 2D spectrum (b), off-diagonal cross peaks C and D indicate that the resonances are coupled. (The absorption frequency here is negative by convention.)
Another important capability of 2D spectroscopy is its ability to overcome inhomogeneous broadening. In any spectrum, resonances appear not as perfectly thin lines but as peaks of nonzero width. Part of that width is due to homogeneous broadening, which results from fundamental processes that affect every member of the ensemble: spontaneous reradiation of light, collisions between atoms, interactions with lattice vibrations in a solid, and so forth. But part may be due to inhomogeneous broadening, which results from differences among members of the ensemble, such as Doppler shifting in a gas or structural disorder in a nanostructure. In 2D spectroscopy, homogeneous broadening is akin to coupling of resonances: The same member of the ensemble can be responsible for slightly different absorption and emission frequencies, so signal appears off the spectrum’s diagonal. Inhomogeneous broadening, like uncoupled resonances, produces no off-diagonal signal. In the limit of strong inhomogeneous broadening, a peak’s inhomogeneous width is given by the width measured along the diagonal, and the homogeneous width may be measured perpendicular to the diagonal.
In principle, 2D optical spectroscopy is much like the established technique of 2D NMR. But implementing it poses many additional challenges, because the frequencies are much higher and the time scales much shorter. The first challenge is measuring the electric field of the signal. That is easily done at the radio frequencies used in NMR, but optical detectors measure only the intensity. To measure an optical signal’s electric field, the signal must be interfered with a well-characterized reference pulse. The second challenge is precisely timing the pulses, with delays accurate to a fraction of an optical cycle. The delays must be stable while a measurement is being made, and the delay steps must be highly uniform.
The idea of implementing 2D coherent spectroscopy in the optical regime was first proposed in 1993 by Yoshitaka Tanimura and one of us (Mukamel). 3 That proposal described using five-pulse sequences to excite molecular vibrations through the Raman effect. Attempts to implement it experimentally were initially complicated by cascading effects (a sequence of lower-order signals that has the same power dependence and direction as the desired signal, making it hard to distinguish between the two). In 2002, after almost a decade, the complications were independently overcome by the groups of Dwayne Miller and Graham Fleming. In the meantime, 2D spectroscopy in the IR, which accesses molecular vibrations directly, was demonstrated independently by the groups of Robin Hochstrasser in 2000 and Andrei Tokmakoff in 2001. Working in the IR poses challenges in terms of sources and detectors, but it has the advantage that a well-designed apparatus usually has sufficient passive stability because of the longer wavelength. Using light in the near-IR or visible parts of the optical spectrum makes it possible to access electronic transitions in atoms, molecules, or semiconductors. At those wavelengths, more elaborate approaches are needed to fulfill the requirements of 2D spectroscopy. 4 , 5
Atomic vapors
The spectroscopy of isolated atoms is well understood, so an atomic vapor provides an ideal illustrative example of the capabilities of 2D spectroscopy. Figure 1 shows the 1D and 2D spectra of the D1 and D2 transitions of potassium vapor. 6 The lines correspond to transitions of the single outer electron of the potassium atom from the ground state to two different excited states; the resonances are therefore coupled. As a result, the 2D spectrum shows four peaks. Two peaks, labeled A and B, lie on the diagonal and correspond to the D1 and D2 transitions being driven independently. Peaks C and D are off-diagonal cross peaks, with the absorption frequency of one transition and the emission frequency of the other, as expected for coupled resonances. Two physical processes contribute to the cross peaks. First, driving one transition reduces the absorption in the other because it reduces the number of atoms available to be excited. Second, atoms can be put in a coherent superposition of the two excited states. In other systems, but not potassium vapor, cross peaks can occur due to decay from one excited state to another.
As described in the

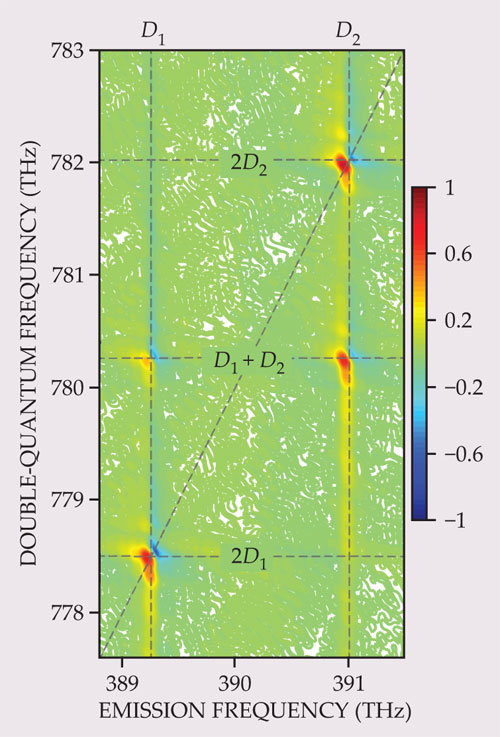
Figure 2. A double-quantum spectrum. The same potassium vapor used in figure
Molecules
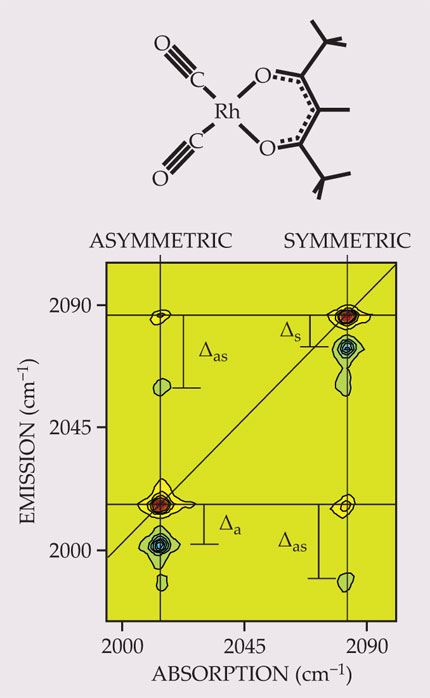
Molecules present much richer spectra than atoms, in part because of nuclear motion. Like a system of interconnected balls and springs, a polyatomic molecule can be excited into a range of vibrational motions. Figure 3 shows a 2D spectrum of dicarbonylacetylacetonato rhodium, one of the first molecules to be studied with 2D vibrational spectroscopy. 8 The diagonal peaks at 2015 and 2084 cm−1 correspond to the asymmetric and symmetric stretching modes of the molecule’s two carbonyl, or CO, groups. Those modes are coupled, so the spectrum contains cross peaks at the same frequencies. If the vibrational modes were perfect harmonic oscillators, with equally spaced quantum states, those would be the only four peaks in the spectrum. But molecular vibrations are anharmonic: The energy of a second vibrational quantum is less than the energy of the first. Those energy differences are reflected in the offsets of the peaks shown in shades of blue. The anharmonicity cannot be determined from the 1D linear absorption spectrum, because peaks at the relevant energies are so closely spaced that they would be impossible to distinguish.

Figure 3. A 2-dimensional IR spectrum of dicarbonylacetylacetonato rhodium (top) showing the symmetric and asymmetric stretching modes of the carbonyl (CO) groups. The four peaks shown in shades of red represent single excitations of the molecule from its vibrational ground state. The emission energies of the peaks shown in shades of blue represent the energy required to excite a molecule that already has one quantum of vibrational energy. The energy shifts Δa, Δs, and Δas quantify the modes’ anharmonicity—that is, how much they deviate from ideal harmonic oscillators. (Adapted from ref.
An important advantage of using short pulses is the ability to probe reaction dynamics. Consider a chemically reactive system in which molecular species A and B can interconvert. If the system is at equilibrium and the reaction rates are slow compared with the spectroscopic frequencies (corresponding to times t and τ as defined in the

Figure 4. Phenol dissolved in benzene forms hydrogen-bonded complexes (a) with a lifetime τd of 10 ps, as measured by two-dimensional spectroscopy. Carbon atoms are shown in gray, hydrogen in white, and oxygen in red. (b) When the delay time T (as defined in the
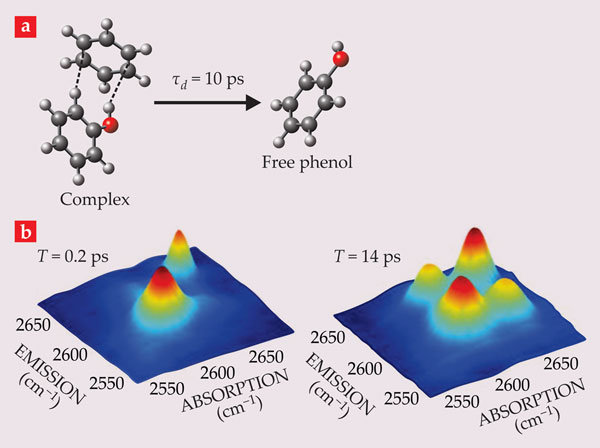
Hydrogen bonds are weak chemical bonds (with a binding energy on the order of the thermal energy at room temperature) involving hydrogen and an accepting atom with high electronegativity—usually oxygen, nitrogen, or fluorine. They are responsible for the tetrahedral structure of water ice and many of water’s important and anomalous properties. They are crucial to the structure of proteins and the double-helix structure of DNA. Their relative ease of forming and breaking makes them important in many biological processes such as enzymatic catalysis. At the same time, because they are so weak, they tend to form a variety of interconverting structures, which yield broad IR spectral peaks that are hard to interpret.
Multidimensional spectroscopy can help to dissect those complex spectra. Several research groups have used 2D spectra of liquid water to probe the time scales on which hydrogen bonds form and break and to explore the connectivity of different hydrogen-bonded clusters. Some researchers, such as Tokmakoff and Fayer, simplified the spectra by using isotopically labeled samples—for example, HDO in H2O. Others, including Miller and Thomas Elsässer, used pure H2O. The groups of Hochstrasser, Peter Hamm, and Martin Zanni have used the same technique to study hydrogen bonding in proteins.
Multidimensional coherent spectroscopy of electronic transitions has been used extensively in the past few years by the groups of Fleming and Gregory Scholes to study charge and energy transport in photosynthetic light-harvesting complexes. The dependence of the cross-peak pattern on the waiting time T provides detailed snapshots of the entire relaxation pathway among the various chlorophyll molecules. (See Physics Today, July 2005, page 23 .)
Semiconductors
The nonlinear optical response of semiconductors reflects the dynamics of electron–hole pairs created by the excitation of an electron to the conduction band from the valence band. The excited electron can bind to the hole to form an exciton, which has a hydrogenic wavefunction in the relative coordinate. Because the excitonic binding energy is so weak—approximately three orders of magnitude weaker than for a hydrogen atom—excitons exist only at temperatures around 10 K. Despite being neutral particles that do not exhibit direct Coulomb interactions, excitons display strong many-body effects. 10 As a result, excitons in semiconductors are an ideal system for studying fundamental many-body physics, which in turn is critical for developing a first-principles understanding of optoelectronic devices such as laser diodes.
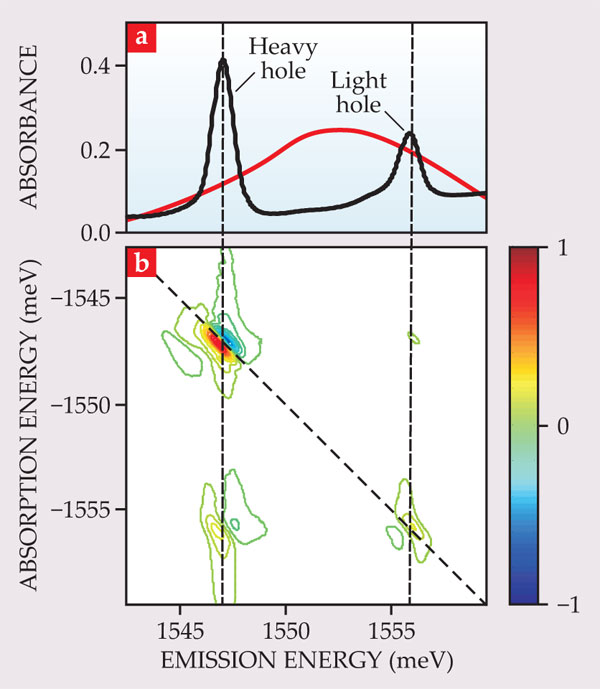
Direct-bandgap materials, such as gallium arsenide and related compounds, are typically used in optoelectronic applications because of their strong absorption and emission of light. Often, the optically active layers are made thin enough that the motion of the charge carriers is quantized in the direction perpendicular to the plane of the layer, thus forming a quantum well. In bulk GaAs, different hole spin states are known as heavy holes and light holes due to their different effective masses. In a quantum well, their energies are split by quantum confinement.
Excitons in quantum wells have been studied extensively using traditional 1D ultrafast spectroscopies. But 1D techniques are limited in their ability to probe the nonlinear optical response that arises from many-body effects. Because 2D spectra, such as the one shown in figure 5, measure not just the magnitude of the coherent signal but also its real and imaginary parts (the phase of the signal with respect to the phases of the excitation pulses), they make it possible to determine the microscopic many-body phenomena that underlie the nonlinear optical response. 11 Specifically, the diagonal heavy-hole peak shows a dispersive lineshape—that is, in the cross-diagonal direction it goes positive and negative with a node on the diagonal—that can only be reproduced theoretically if many-body effects are considered.

Figure 5. In a gallium arsenide quantum well, the exciton resonance is split into two peaks (a) that correspond to holes with different effective masses. (The laser-pulse spectrum is shown in red.) In the two-dimensional spectrum (b), the intricate peak shapes arise from the many-body physics of exciton–exciton interactions. (Adapted from ref.
A detailed comparison of 2D spectra to theoretical results definitively showed that a simple mean-field theory does not suffice to describe the exciton system. 12 In a mean-field approximation, each exciton is assumed to interact with an average of all other excitons. Higher-order correlations describe interactions between two excitons, including explicit bound states, or biexcitons, as well as pairwise interactions that do not form bound states. Although the importance of the higher-order terms was evident from theoretical considerations, it was difficult to show that they were required based on 1D measurements, which could often be accurately reproduced by simpler theories.
Semiconductor quantum dots grown using epitaxial methods have attracted significant attention for their possible applications in quantum information science. (See the article by Dan Gammon and Duncan Steel, Physics Today, October 2002, page 36 .) Because their charge-carrier wavefunctions are confined in all three dimensions, quantum dots, like atoms, have discrete energy levels. The energy levels can be engineered to some extent by adjusting the size of the dot, but it is difficult to make an ensemble of quantum dots that are all exactly the same size. Most studies, therefore, have been performed on single dots; those experiments are very challenging and make it difficult to accumulate enough measurements to accurately determine trends. However, 2D spectroscopy can make size-resolved measurements on an inhomogeneous distribution of dots. In addition, because 2D spectroscopy excels in detecting and characterizing coupling between resonances, Wolfgang Langbein and coworkers were able to show that natural quantum dots, which form due to thickness fluctuations in thin quantum wells, can couple to one another. 13 Measuring the coupling strength between quantum dots is critical to quantum information applications that require controllable coupling.
Outlook
The field of multidimensional coherent spectroscopy is still evolving, and new developments are occurring frequently. One interesting future direction is to measure incoherent observables rather than a coherently generated optical signal. Coherence information is nevertheless obtained through the parametric dependence of the incoherent signals on time delays. For example, a fluorescence signal was used in the early work of Warren Warren’s group and has also been exploited by Andrew Marcus. In much more challenging experiments, the groups of Tobias Brixner and Martin Aeschlimann combined multidimensional coherent methods with a photoemission electron microscope to construct a 2D spectrum of a corrugated silver surface as a function of spatial position, with subwavelength resolution. Their measurements showed that plasmonic phase coherence of localized modes can persist for a surprisingly long 100 fs.
Another direction is to extend 2D spectroscopic methods to higher frequencies. Two-dimensional coherent spectroscopy in the UV was recently demonstrated by the groups of Thomas Weinacht and Andrew Moran. New x-ray sources, including free-electron lasers and tabletop high-harmonic sources, may enable resonant attosecond nonlinear ultrafast x-ray spectroscopies of core excitons in molecules. X-ray pulses have the unique capacity to detect nuclear and electronic motions with both attosecond and nanometer resolution. New methods for looking at electron–electron correlations and the flow of charge are possible. X-ray pulses can also directly probe structural fluctuations, relaxation processes, and the dynamics of elementary excitations such as excitons, polaritons, and polarons in real time and space.
Pulse and excitation sequence
Optical two-dimensional spectroscopy uses a sequence of laser pulses that are incident on the sample from different directions. A typical geometry is shown in the top panel of the figure. The incident pulses, A, B, and C, generate a signal S that emerges in a different direction, determined by conservation of momentum, and thus is easily isolated.

As shown in the bottom panel, the pulses are separated by time delays τ and T, and the signal is emitted over time t. The first pulse, with wavevector kA, puts the system in the coherent superposition between the ground state ∣0〉 and the excited state ∣1〉. The superposition oscillates as a function of time, as indicated by the decaying sinusoid. The second pulse, kB, converts the superposition to a population in the excited state. The excited-state population does not oscillate, but it does store the phase of the superposition state. The third pulse, kC, converts the population back to a coherent superposition state that radiates the signal field with wavevector kS = −kA + kB + kC. Pulse A contributes a minus sign and is marked with an asterisk in the figure because its contribution to the phase of the signal is conjugated, or shifted by 180° with respect to the contributions of the other two pulses. A 2D spectrum is then generated by scanning τ, recording the signal as a function of t, and taking Fourier transforms with respect to τ and t.
That pulse sequence, with the phase-conjugated pulse arriving first, produces a so-called rephasing spectrum, which is only one of several possible 2D spectra. If the conjugated pulse arrives second, the resulting spectrum is known as a “nonrephasing” spectrum because the dephasing due to inhomogeneous broadening is not canceled, or “rephased.” As shown by Andrei Tokmakoff, if rephasing and nonrephasing spectra are added together, the resulting “correlation” spectrum has narrower peaks. Correlation spectra can disentangle congested spectra because they have narrower features.
If the conjugated pulse arrives last, the resulting spectrum can show double-quantum coherences, or coherent superpositions of the ground state and a doubly excited state. Such coherences cannot be directly created by a single light pulse because the transition between these states is not dipole allowed. However, two nonconjugated pulses together can create a double-quantum coherence, which oscillates at the frequency corresponding to the energy difference between the ground state and the doubly excited state, typically around twice that of the single quantum transition.
References
1. S. Mukamel, Principles of Nonlinear Optical Spectroscopy, Oxford U. Press, New York (1995).
2. R. R. Ernst, G. Bodenhausen, A. Wokaun, Principles of Nuclear Magnetic Resonance in One and Two Dimensions, Oxford U. Press, New York (1987).
3. Y. Tanimura, S. Mukamel, J. Chem. Phys. 99, 9496 (1993). https://doi.org/10.1063/1.465484
4. S. Mukamel, Annu. Rev. Phys. Chem. 51, 691 (2000); https://doi.org/10.1146/annurev.physchem.51.1.691
D. Jonas, Annu. Rev. Phys. Chem. 54, 425 (2003); https://doi.org/10.1146/annurev.physchem.54.011002.103907
M. Cho, Chem. Rev. 108, 1331 (2008); https://doi.org/10.1021/cr078377b
D. Abramavicius et al., Chem. Rev. 109, 2350 (2009). https://doi.org/10.1021/cr800268n5. P. Hamm, M. Zanni, Concepts and Methods of 2D Infrared Spectroscopy, Cambridge U. Press, New York (2011).
6. X. Dai et al., Phys. Rev. A 82, 052503 (2010). https://doi.org/10.1103/PhysRevA.82.052503
7. X. Dai et al., Phys. Rev. Lett. 108, 193201 (2012). https://doi.org/10.1103/PhysRevLett.108.193201
8. M. Khalil, N. Demirdöven, A. Tokmakoff, Phys. Rev. Lett. 90, 047401 (2003); https://doi.org/10.1103/PhysRevLett.90.047401
J. Chem. Phys. 121, 362 (2004). https://doi.org/10.1063/1.17568709. J. Zheng et al., Science 309, 1338 (2005). https://doi.org/10.1126/science.1116213
10. D. S. Chemla, J. Shah, Nature 411, 549 (2001). https://doi.org/10.1038/35079000
11. S. T. Cundiff et al., Acc. Chem. Res. 42, 1423 (2009). https://doi.org/10.1021/ar9000636
12. T. Zhang et al., Proc. Natl. Acad. Sci. USA 104, 14227 (2007). https://doi.org/10.1073/pnas.0701273104
13. J. Kasprzak et al., Nat. Photonics 5, 57 (2011). https://doi.org/10.1038/nphoton.2010.284
More about the authors
Steven Cundiff is a fellow of JILA and an adjoint professor of physics and electrical and computer engineering at the University of Colorado Boulder. Shaul Mukamel is a professor of chemistry at the University of California, Irvine.


