Optical analogues to NMR spectroscopy
DOI: 10.1063/PT.3.5255


Every element and molecule absorbs or emits light in a unique pattern or spectrum. That makes spectroscopy one of the most widely used and effective methods for studying matter. Raman and IR absorption spectroscopies, for example, are used to identify specific molecules and reveal their structural information. Visible, UV, and fluorescence spectroscopies work similarly and can sometimes even measure single molecules.

JESSE FRANKS/SHUTTERSTOCK.COM

NMR spectroscopy measures the absorption of electromagnetic radiation at radio frequencies. It’s increasingly being used in the biological and medical sciences because of its extraordinary ability to determine the structure and behavior of proteins and other exceptionally complex molecules. NMR spectroscopy uses a very different approach that’s based on forming coherences. 1 A coherence is a quantum mechanical superposition state that consists simultaneously of two states, just like Erwin Schrödinger’s famous cat. Although it may seem strange, such a situation is possible in quantum mechanics, where things are described by waves and those waves can oscillate coherently at multiple frequencies with well-defined phases.
For proteins and other complex molecules containing carbon-13 and hydrogen-1 atoms, it has become common to use multiple-quantum-coherence (MQC) NMR spectroscopy to determine their three-dimensional molecular structure. The strong magnetic field used in NMR preferentially orients the nuclear spin states of 1H, 13C, and other atoms. Microwave pulses are then used to create quantum mechanical superposition states that are mixtures of the up and down spins of the 1H and 13C and that oscillate at the frequencies of both nuclear spins. The result is a Floquet state—a periodically driven nonequilibrium state in which the oscillations of the up–down spins have well-defined phase relationships that are maintained indefinitely by the microwave driving field. 2 When the driving field is turned off, the Floquet state still remains coherent for a long time (about 0.1–1 seconds) until interactions with the thermal environment eventually force it back to equilibrium. The loss of the coherent phase oscillations is exponential in time and is characterized by a dephasing time.
Before dephasing occurs, however, MQC NMR spectroscopy manipulates the Floquet state by introducing additional pulses, and a Fourier transform (FT) converts the time between pulses to the frequencies in a multidimensional spectrum. The pulses are designed to manipulate dipole–dipole interactions between the magnetic moments of the 1H and 13C nuclear spin states. For example, since the energy of a 1H atom depends on whether its neighboring 13C atom’s spin is up or down, it becomes possible for an additional pulse to flip the spin alignment of the 13C and change the frequency and phase of the 1H spin. As a result, MQC NMR spectroscopy is now a large family of techniques that uses different pulse orderings to engineer the Floquet state and embed the phase information of the 13C oscillations on the 1H oscillations.
Photon echoes
Ever since the invention of the laser, researchers have envisioned using a laser’s coherence to enable optical analogues of NMR and expand coherent methods to all quantum states. 2 Now that laser systems cover the entire electromagnetic spectrum, that vision is being realized. The first such effort, similar to NMR’s spin echo, was photon echo. 3 In that technique, three optical pulses sequentially created a coherence between two electronic states, a static population in the excited states, and the conjugate, oppositely evolving coherence that generated the output signal. Since its discovery, photon echo has been widely used for measuring the ultrafast dynamics of excited populations in chemical systems. It is particularly important for inhomogeneous samples in which different environments create a broadened distribution of quantum-state frequencies. Photon echo removes the frequency broadening in inhomogeneous samples because the conjugate coherence reverses the phase drift caused by different environments, which brings the signal components into phase with one another.
Since NMR spins oscillate at high frequencies, an additional microwave pulse—called the local oscillator—is used to create a measurable beat between itself and the output signal. The phase oscillations are converted to frequencies using a Fourier transform. In 1998 David Jonas and coworkers added a fourth light pulse to a photon-echo experiment to create a beat with the photon-echo signal; the beat could be used to measure the first and last coherences’ phase oscillations. 4 That optical analogue of 2D FT-NMR spectroscopy can resolve the underlying spectral features of inhomogeneous materials and is used extensively in physical chemistry to study the ultrafast dynamics of vibrational and electronic quantum states. (For more on 2D spectroscopy, see the article by Steven Cundiff and Shaul Mukamel, Physics Today, July 2013, page 44 .)
But the FT time-domain approach has its limitations. Dephasing times in optical spectroscopy are many orders of magnitude shorter than those for NMR: picoseconds for vibrational states and femtoseconds for electronic states. That’s too short to create multiple quantum coherences that can be engineered the same way as MQC NMR. Time-domain methods are, therefore, constrained to creating sequential single quantum coherences over narrow frequency ranges.
Frequency-domain spectroscopy
An alternative approach that avoids those constraints is frequency-domain spectroscopy. Indeed, NMR spectroscopy was primarily a frequency-domain technique from 1945 until the 1970s, when laboratory computers became available. Frequency-domain multidimensional spectroscopy uses excitation pulses with different frequencies to create resonances with rotational, vibrational, and electronic states. The Floquet states that result from those resonances remain coherent for the duration of the pulses.
The approach was guided by work from 1965, which formed the foundations for nonlinear and coherent Raman spectroscopies. 5 The methods were initially constrained to single Raman resonances because of the limited availability and wavelength range of tunable lasers. 6 When tunable dye lasers became more readily available in the mid 1980s, one of us (Wright) built a system with three nanosecond, tunable dye lasers to create fully coherent Floquet states containing electronic, vibrational, and vibronic (combined electronic and vibrational transitions) coherences in pentacene molecules. 7 When tunable optical parametric-amplifier systems became readily available, the method was expanded to include multiple IR and UV excitation pulses. 8
Figure
Figure 1.

Floquet states are created in molecules when three tunable excitation pulses entangle the ground state (g) with vibrational (v), electronic (e), and vibronic (e + v’) states. A Floquet state emits beams at new frequencies and directions. Selecting one of the output beams and measuring its resonant enhancements as a function of input frequencies, researchers can collect three-dimensional spectral information of the targeted molecule. (a–f) The energy level diagrams show the various ways of accessing ground-state and electronic-state resonances, and each provides unique capabilities. The time in which interactions occur relative to one another is ordered from left to right in the diagrams. Solid arrows define the paths that create the initial states of the output transition ωout, and dashed arrows, the final states.
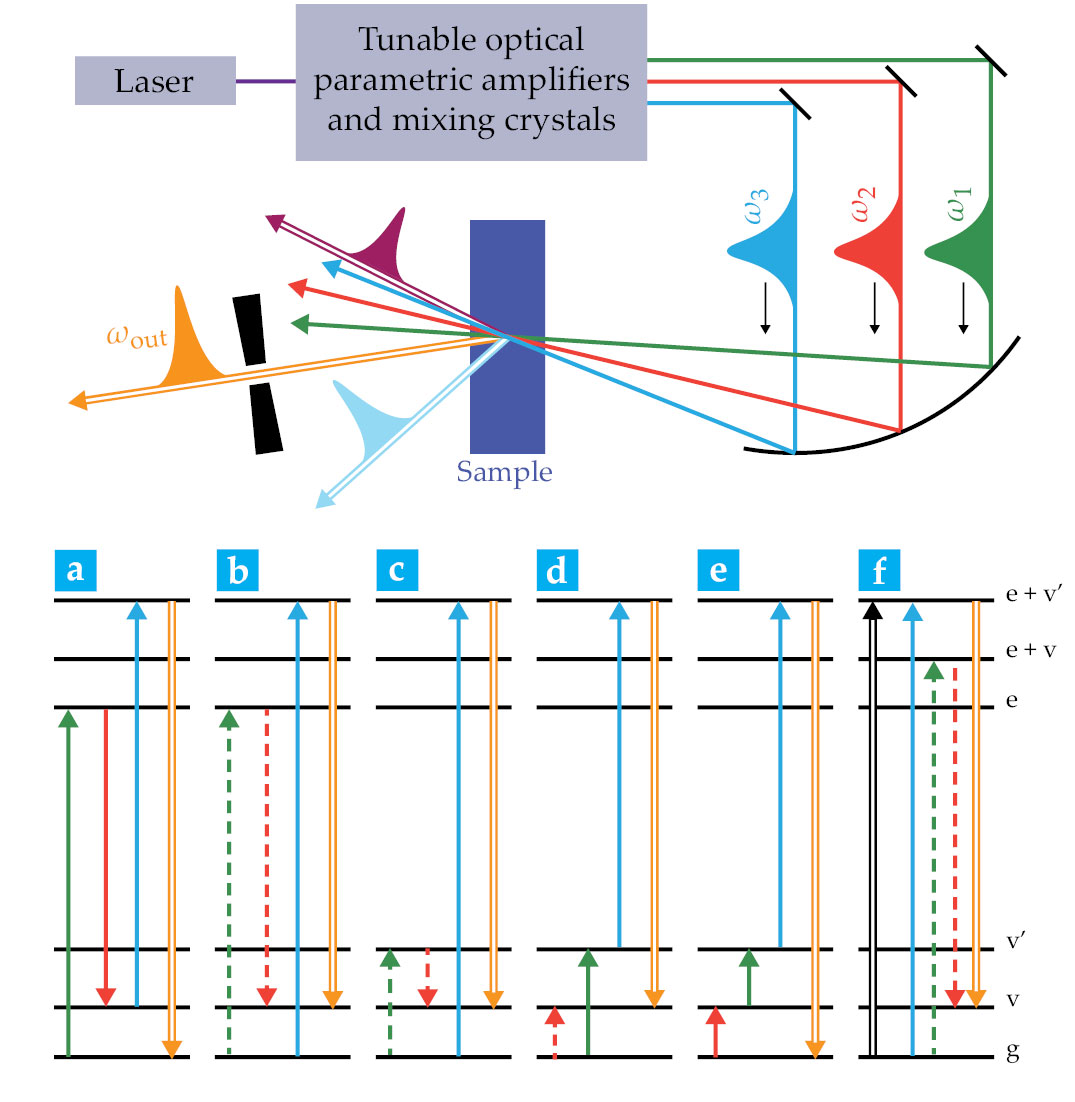
The dipole moments of the Floquet state launch multiple output beams with frequencies ωout = ∑±ωi defined by energy conservation and directions kout = ∑±ki defined by momentum conservation, where ωi and ki are the angular frequency and wavevector of pulse i, respectively. New output beams are produced because the phase oscillations of molecules emit light throughout the sample that constructively interferes in specific directions, so the beams can be more intense than incoherently emitted light. Spectra are recorded by scanning the excitation frequencies across resonances while monitoring the intensity of a particular output beam with a monochromator and detector. The resonance enhancements are multiplicative, so the intensity increases by orders of magnitude when the transitions are fully resonant.
Using the fully coherent, frequency-domain Floquet state for multidimensional spectroscopy offers many key advantages. First, having three independently controllable input pulses to generate a fourth output pulse can entangle states across the entire electromagnetic spectrum to form a Floquet state. For example, one beam can probe the mid-IR region, one can probe the near-IR region, and the other two can be used for the visible and UV regions.
9
Second, the experimental system is less rigid than FT methods because the coherent phases in a Floquet state are established entirely within each pulse set and are less susceptible to interference from competing effects. Third, a Floquet state creates an instantaneous snapshot of the coupled coherent states that avoids the complications created by changing state populations. Because dynamic effects change and collapse the Floquet state, they do not contribute to the output signal. Dynamics can, however, still be measured by a pump-probe pathway similar to that shown in figure
The fourth advantage is that the numerous ways to mix and scan the three input beam frequencies provide researchers with multiple methods that can be tailored to the needs and goals of an experiment. Fifth, the quantization of molecular states and the coupling between them creates patterns that link the features in multidimensional spectra, and that quantization clarifies the relationships between states. Sixth, the only features that appear in multidimensional spectra are those that are coupled, which allows researchers to eliminate uninteresting features in congested spectra. Finally, the technique can easily create higher-dimensional spectra, which can better characterize complex samples.
Both MQC NMR and frequency-domain Floquet-state spectroscopy consist of a family of versatile techniques. The six diagrams in figure
To resolve features existing beneath the broadened spectral bands found in inhomogeneous samples, it is important to use photon-echo methods and other similar approaches that have conjugate coherences. Although fully resonant CARS provides the high selectivity required for congested spectra, it lacks conjugate coherences. But the dashed arrows in figure
Gas phase
Gas-phase spectroscopy can probe the detailed structure and behavior of molecules and is useful for various applications such as the satellite monitoring of greenhouse gases and the search for possible life on exoplanets. Gaseous molecules have huge numbers of energy levels because of many different possible combinations of quantized rotational, vibrational, and electronic motions. The resulting spectra are congested by thousands or even millions of overlapping peaks and often lack any recognizable patterns that researchers need in order to assign those peaks. That problem can be addressed by creating Floquet states in gases in the same way that 2D MQC NMR does for large biomolecules.
One reason that Floquet-state spectroscopy is useful for exploring relationships among rotational, vibrational, and electronic states is that different kinds of motions produce distinct patterns in multidimensional frequency-domain spectra. 10 Rotational patterns, for example, have easily recognizable shapes—collections of rectangles, trapezoids, and triangles that form X’s, asterisks, and other shapes—whereas vibration patterns show how the rotational patterns align in multidimensional space to form grids composed of columns, rows, and diagonal lines. The detailed shape of the patterns depends on quantization, technique, selection rules, molecular shape, and molecular behavior.
The peaks in the rotational and vibrational patterns are automatically sorted by a molecule’s rotational and vibrational quantum numbers. Assigning peaks by quantum number is necessary for researchers to develop accurate molecular models and use spectroscopy to measure molecular temperature. Furthermore, if the sample is a mixture of molecules, the spectral peaks can also be sorted by species because all the peaks that make up a given pattern will come from the same species. Floquet-state spectroscopy can also explore the coupling between peaks in different regions of the electromagnetic spectrum, even if the 1D spectra of those regions appear heavily congested and lack patterns. The resulting multidimensional patterns can then be used with little or no prior knowledge to extract immediate information on molecular structure, molecular behavior, and the relationship between peaks in those regions.
Figure
Figure 2.

Iodine vapor has many broad spectral peaks. (a) In a one-dimensional spectrum, rotational–vibrational peaks are unresolvable. (b) In contrast, a 2D spectrum created using Floquet-state spectroscopy from two heavily congested regions (550–564 nm and 570–576 nm) shows 2D parabolic patterns of peaks. Each of the peaks is represented by a dot, and they are arranged by rotational and vibrational quantum number. The rows of parabolas resolve the v’ quantum numbers for each v” ground-state vibration. To the right of the figure, the black arrows indicate a Raman transition, and the blue and yellow arrows represent excited electronic-state transitions. (c) For peaks that are still not fully resolved, a 3D spectrum that includes at least one axis from the 2D spectrum can be generated. This 3D slice—created using an input wavelength of 561.902 nm and two other input laser wavelengths—shows triangular patterns (green) that clearly resolve all I2 peaks. The black and green arrows to the right of the figure indicate a resonance Raman transition. Colors correlate to specific spectral peaks (circles), scanned regions along the x and y axes, wavelengths (lines), and transitions (arrows) across the 1D, 2D, and 3D spectra.
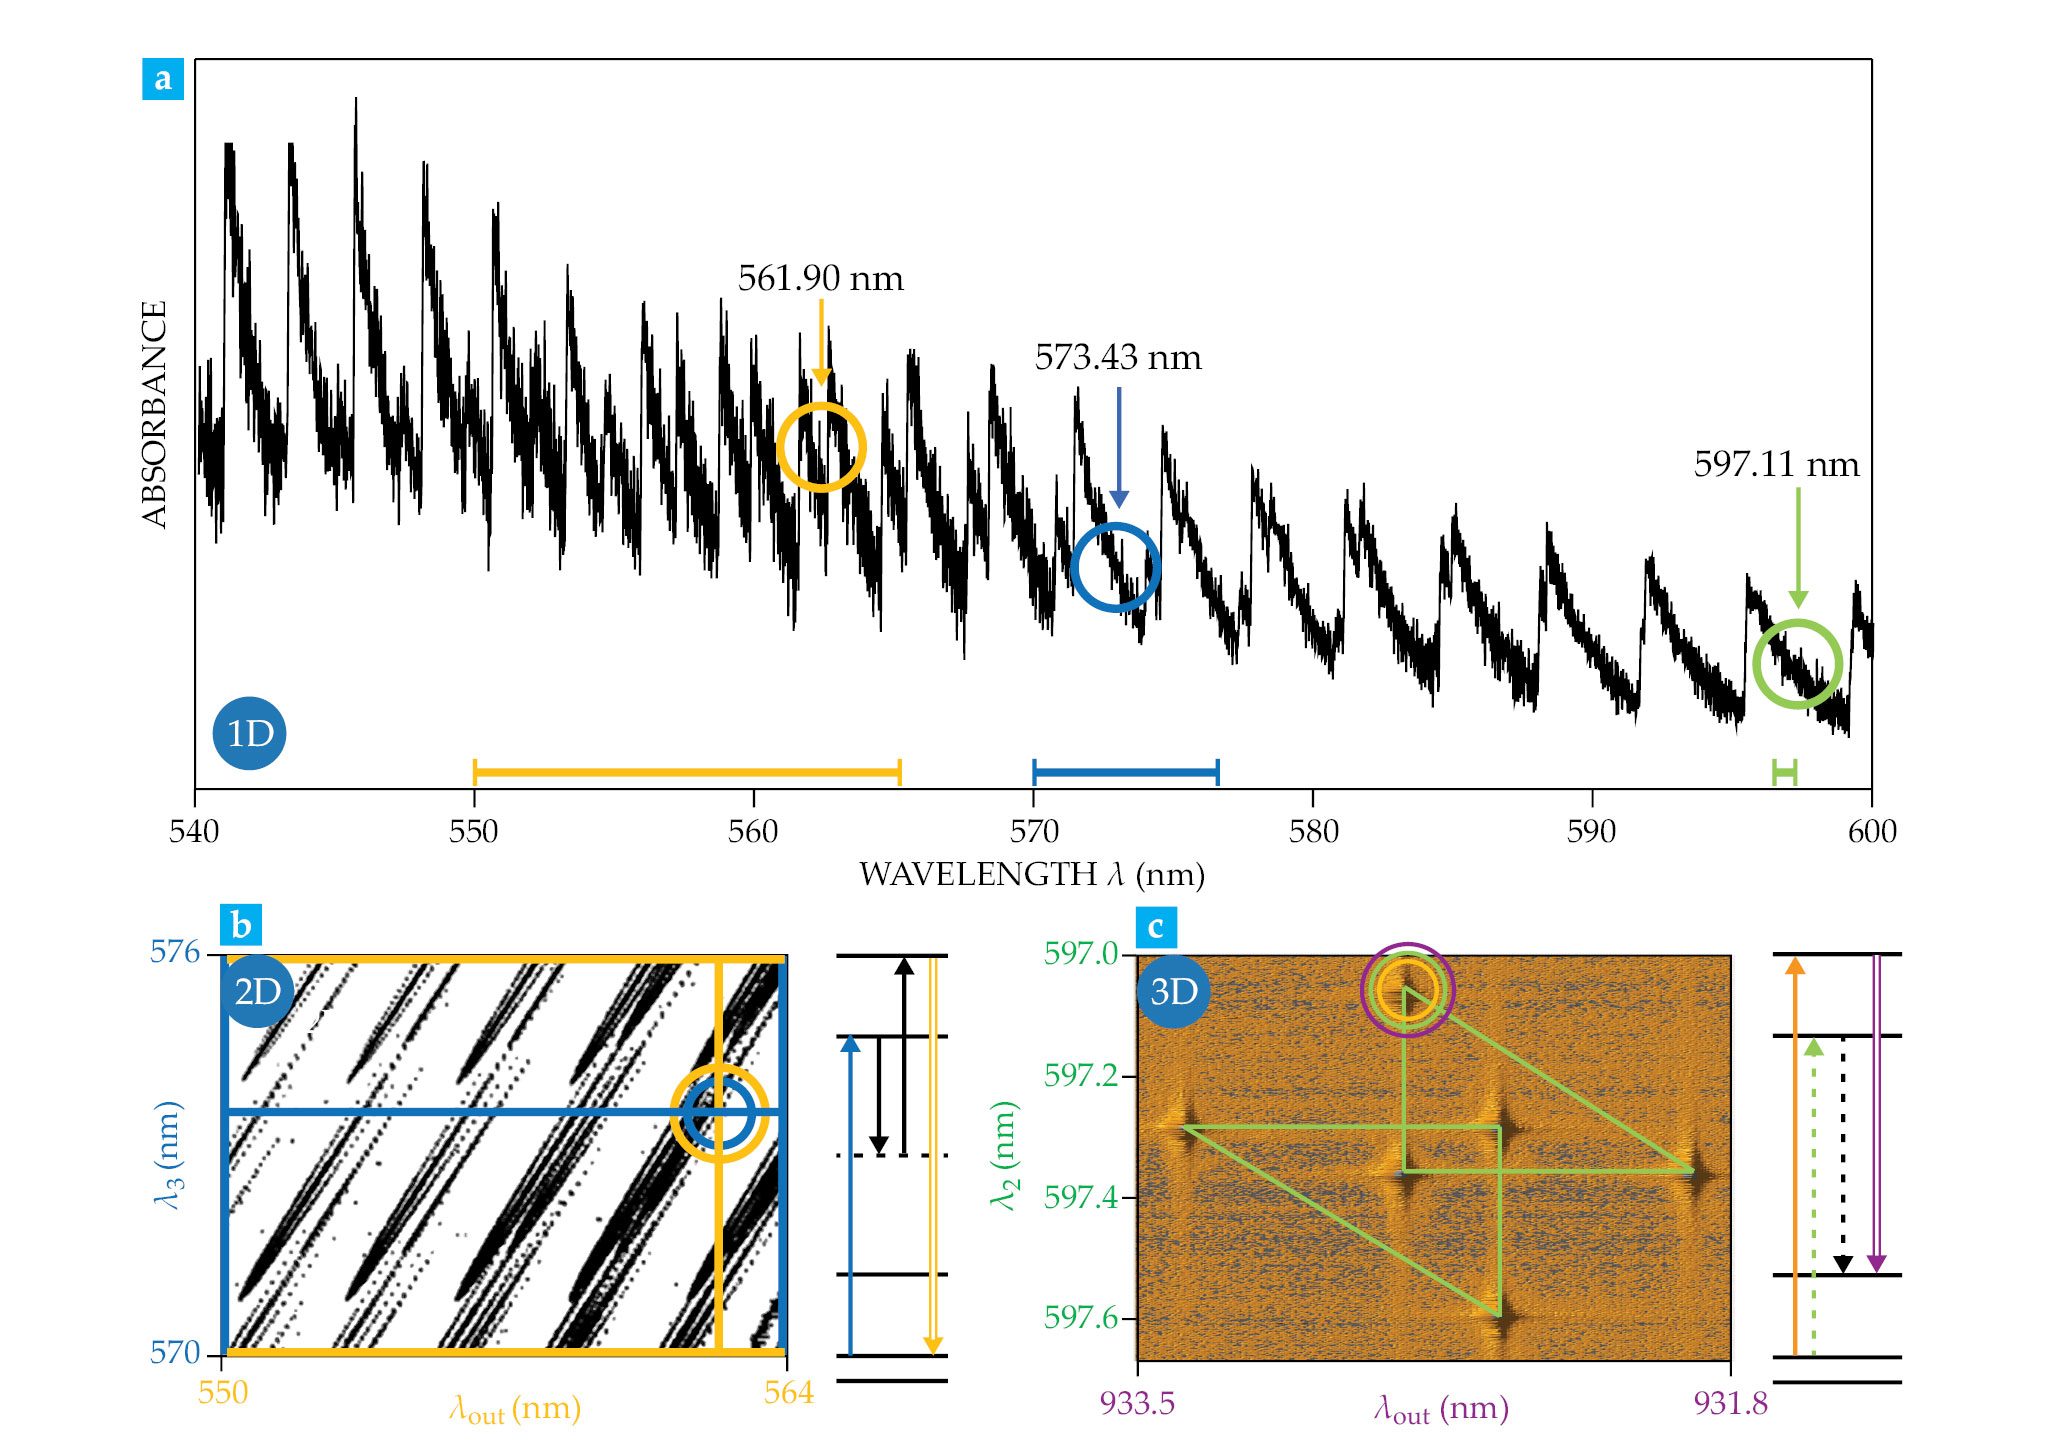
A 2D Floquet spectrum of iodine vapor was recorded by scanning one input pulse over a wavelength range of 570–576 nm and the detection wavelength over 550–594 nm. The spectrum shows rotational–vibrational peaks that are distributed into parabolic patterns, which are automatically grouped by their ground state’s rotational quantum number J”. The smallest J” values appear near the vertex of a parabola, and J” increases toward the parabola’s tail.
If needed, the resolution can be improved by several orders of magnitude by using a fully resonant process to record a 3D spectrum, which shows peaks as a function of three orthogonal wavelength or frequency axes. In fact, the density of peaks is so low in 3D space that finding them can be difficult. An easy solution is to use one of the wavelength coordinates from a peak in the molecule’s 2D spectrum as one of the three wavelengths in the 3D spectrum. Scanning the wavelengths for the two other axes creates a slice through the 3D data that includes that selected peak as well as two additional related peaks with similar quantum numbers, all of which together form triangles and other easily recognizable patterns. Once one triangle is located, additional ones on parallel planes become relatively easy to find and can be used to calculate rotational quantum numbers and molecular constants.
Molecular systems more complex than iodine vapor also benefit from the use of conventional 1D spectra to design 2D and 3D Floquet experiments. Larger molecules, and systems in which perturbations hamper the ability to apply traditional molecular models, would benefit from improved spectral resolution, easy pattern recognition, and automatic peak sorting. Using multidimensional patterns is especially robust because of the high level of redundancy.
Condensed phases
The bonding that links molecules together is at the heart of understanding the properties and mechanisms of materials in almost all areas of science and technology. Floquet-state spectroscopy has the capability to directly probe bonding interactions. Vibrational spectra serve as fingerprints of specific molecules because the many vibrational modes create sharp spectral features sensitive to their structure. If two molecules are connected by a bond, for example, the 2D spectrum will contain cross peaks that depend on the shared bond. Those cross peaks provide direct access to the bonding interactions and can guide the development of new materials and materials properties.
One example of such a capability is the binding of drugs to proteins.
11
Figure
Figure 3.

Drug–protein interactions that were previously unseen (circles) can be resolved with two-dimensional Floquet-state spectroscopy. This 2D spectrum of a protein–drug complex was recorded using the transitions in figure
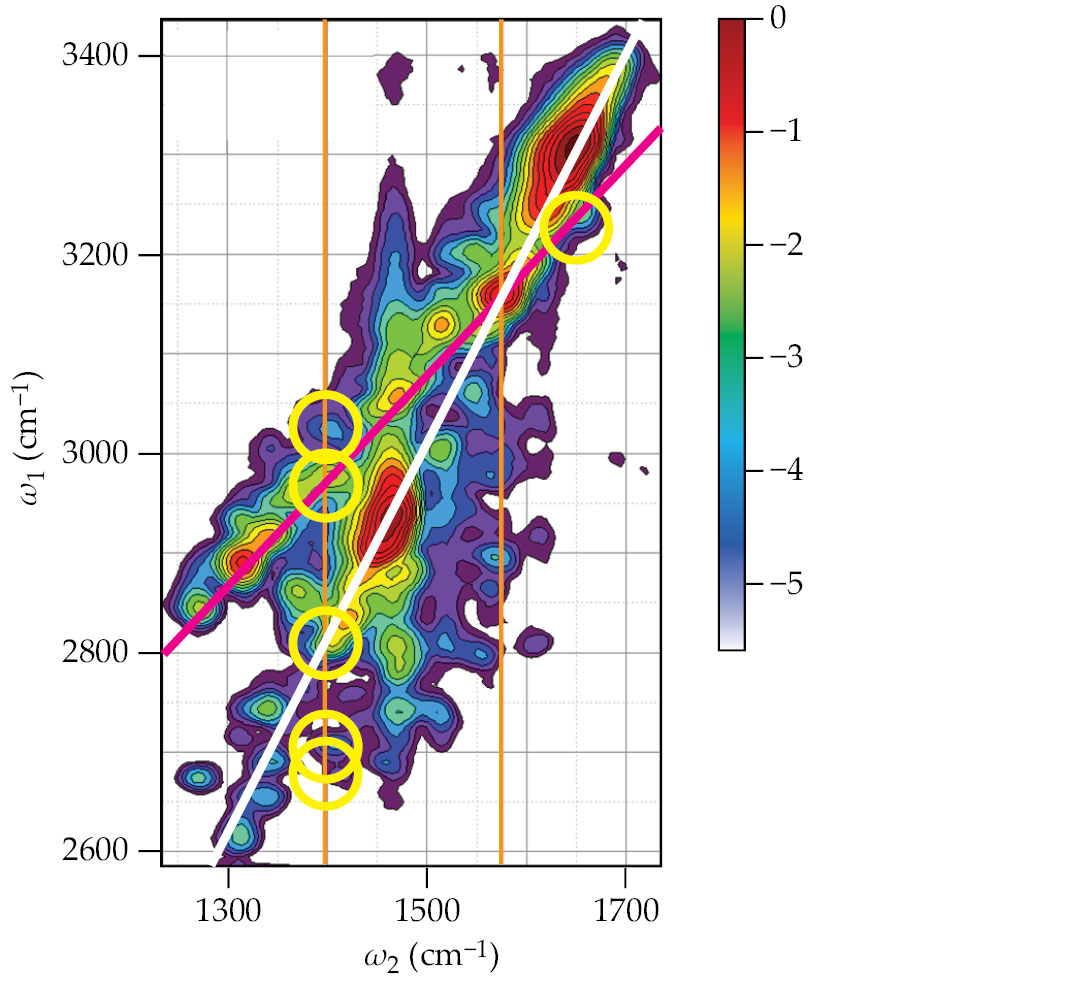
The lines in figure
Another combination cross peak, at (1400 cm−1, 2980 cm−1), corresponds to a coherence that involves the NH2 group with another mode on the drug and appears only when the drug is attached to the protein. Similar combination bands and overtones caused by other drug–protein interactions can be found along the left vertical orange line. The ability to discover protein–drug binding interactions offers researchers a new tool to gather atomic-level structural information to support more intelligent drug design. 11
Chemical reaction mechanisms
Among the many laser applications that its pioneers envisioned is the coherent control of chemical reactions. 2 The peak intensities of focused lasers are high enough to soften and even break bonds. When ultrafast lasers became popular in the 1980s, so did researchers’ interest in coherently controlling reactions. Experiments aimed to optimize reactions focused largely on shaping ultrafast laser pulses by measuring the reaction product as a function of the pulse shape and controlling the shape with genetic learning algorithms. 12
A different and more productive approach is to identify how chemical reactions occur by exciting the vibrational modes that control them. Bending, twisting, and stretching an object will eventually break it, and chemical reactions work the same way. Many vibrational motions are instigated by a chemical species’ thermal and chaotic environment, but only a few are strong enough to break molecular bonds. Floquet-state spectroscopy can discover those modes and provide the mechanistic insights to guide chemists in intelligently discovering new reactions. The many overtone transitions shown in figure
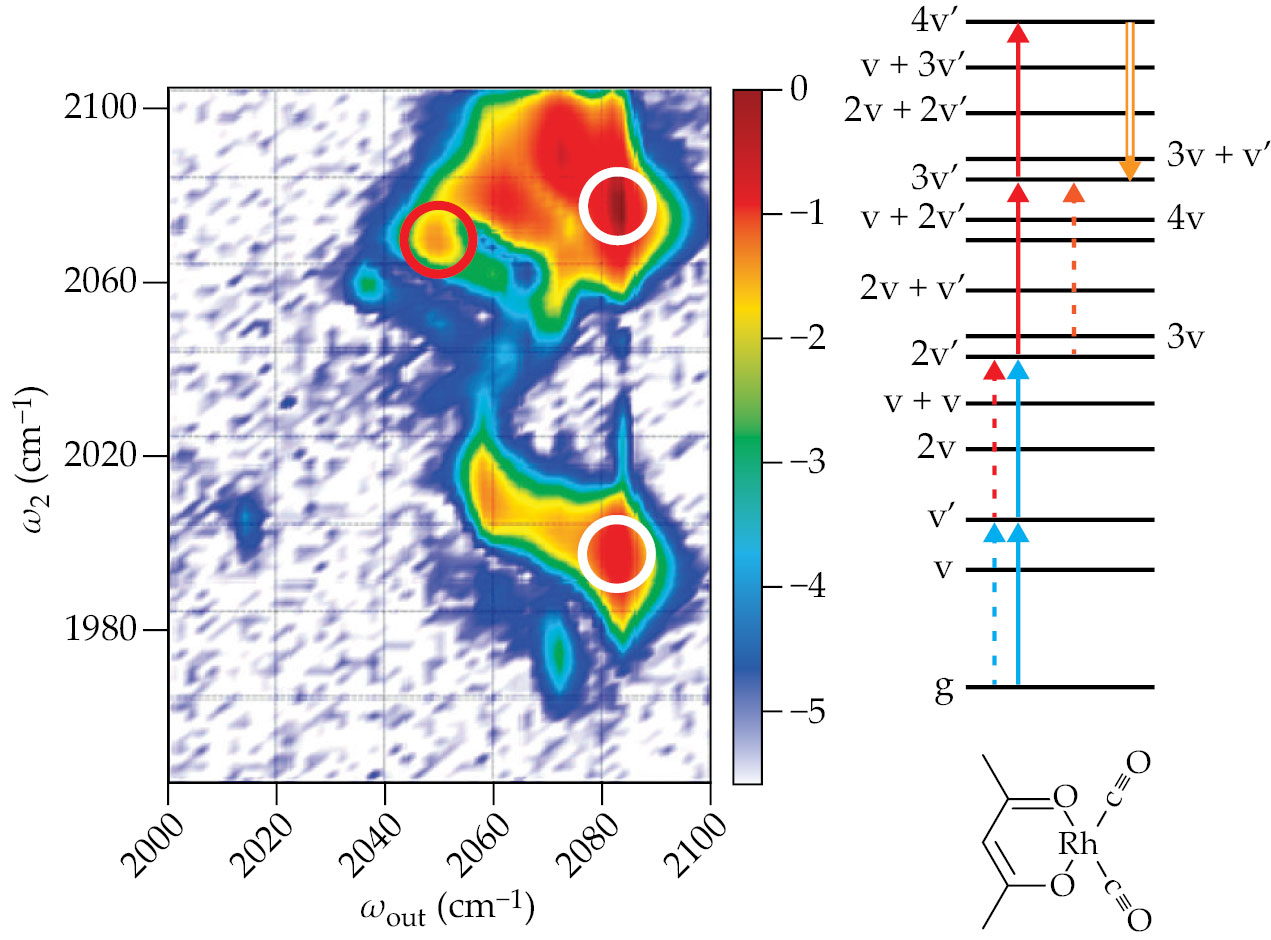
For more complicated reactions, the Floquet methods shown in figures 1c–1f can replace the thermal environment with coherent excitations, which create mixtures of the vibrational overtones, combination bands, and electronic states that are responsible for bonding. The multidimensional cross peaks identify the states that are coupled and cause reactions. One of us (Wright) used a rhodium dicarbonyl chelate to demonstrate how Floquet-state spectroscopy can identify how chemical reactions occur. 13 The rhodium dicarbonyl has symmetric and asymmetric C≡O modes at 2015 cm−1 and 2082 cm−1, respectively. The C≡O groups can disassociate and make carbon monoxide.
Figure
Figure 4.

The spectrum of rhodium dicarbonyl in two dimensions was produced with high-intensity excitation pulses that interact multiple times. The color bar is the normalized logarithm of the output intensity. Compared with other types of spectroscopy, Floquet-state methods can reveal more information about a molecule and its properties. For example, the white circles show the diagonal C≡O symmetric v’ peak (top white circle) and the symmetric–asymmetric v + v’ cross peak (bottom white circle). The red circle denotes the 4v’, 3v’ overtone coherence created by the energy-level transitions summarized on the right. (Adapted from ref.
Beyond physical chemistry
Few laboratories in the world are involved in the development of fully coherent Floquet-state methods. Progress has been constrained by the experimental sophistication required to scan the frequencies of ultrafast laser systems. Excitation pulses in nanosecond systems are long enough that changes in frequency don’t affect the temporal and spatial overlap that’s required to measure nonlinear interactions. But scans of picosecond and femtosecond systems undergo substantial changes in overlap and directionality that must be corrected for, especially for spectral scans over long ranges.
Many of the opportunities envisioned in the early development of the methodology have yet to be fully realized.
14
An MQC Floquet state could, for example, provide native, multidimensional contrast for highlighting specific molecules in a microscopic image without requiring fluorescent tags that perturb the sample. The spatial resolution can also be 3D and much higher than the IR diffraction limit because the highest-frequency excitation determines the resolution. The spectral resolution can be increased by using larger numbers of entangled vibrational states, as illustrated in figure
Another example concerns semiconductor spectra, which are highly congested because of the many degrees of freedom for charge carriers that are delocalized within a lattice. Creating a Floquet state constrains the charge-carrier states to those that share the same momentum because of conservation laws that apply when transitions occur. Normally, only angularly resolved photoelectron spectroscopy is able to resolve the complex electronic structure of semiconductors, but that type of spectroscopy requires tunable x-ray sources, such as those at national laboratories.
An exciting application would be to use coherent x rays or extreme UV excitations of a Floquet state to entangle a valence core hole with vibrational or electronic states. That methodology would provide atomic and chemical selectivity. And the coupling between the states creates a nonequilibrium Floquet state for quantum computing and quantum information science. Currently, Floquet-state engineering is based on time-domain methods in which single quantum coherences can be controlled by other nonresonant pulses. Frequency-domain control of the multiple states within a Floquet state is potentially a new frontier for quantum applications.
Coherent multidimensional spectroscopy has remained almost exclusively in the field of physical chemistry, but its expansion beyond may provide a wealth of opportunities for the physics community. The development of Floquet-state spectroscopy will also be enhanced by the availability of the ytterbium-based laser systems that have now been engineered to avoid the problems of scanning the frequencies of ultrafast lasers. That advance and other new technologies will empower future experiments with multiple quantum coherences.
The development of Floquet-state spectroscopy has been made possible by NSF grants awarded to the Wright and Chen research programs.
References
1. M. Munowitz, A. Pines, Science 233, 525 (1986). https://doi.org/10.1126/science.233.4763.525
2. S.-I. Chu, D. A. Telnov, Phys. Rep. 390, 1 (2004). https://doi.org/10.1016/j.physrep.2003.10.001
3. N. A. Kurnit, I. D. Abella, S. R. Hartmann, Phys. Rev. Lett. 13, 567 (1964). https://doi.org/10.1103/PhysRevLett.13.567
4. J. D. Hybl et al., Chem. Phys. Lett. 297, 307 (1998). https://doi.org/10.1016/S0009-2614(98)01140-3
5. P. D. Maker, R. W. Terhune, Phys. Rev. 137, A801 (1965). https://doi.org/10.1103/PhysRev.137.A801
6. W. M. Tolles et al., Appl. Spectrosc. 31, 253 (1977). https://doi.org/10.1366/000370277774463625
7. S. H. Lee et al., Appl. Spectrosc. 39, 243 (1985). https://doi.org/10.1366/0003702854248872
8. J. C. Wright et al., Appl. Spectrosc. 51, 949 (1997). https://doi.org/10.1366/0003702971941601
9. D. A. Daniels, T. A. Wells, P. C. Chen, J. Chem. Phys. 157, 184201 (2022). https://doi.org/10.1063/5.0109084
10. P. C. Chen, Acc. Chem. Res. (2023), doi:https://doi.org/10.1021/acs.accounts.2c00637 .
11. H. Sowley et al., J. Phys. Chem. B 123, 3598 (2019). https://doi.org/10.1021/acs.jpcb.9b00501
12. D. J. Tannor, S. A. Rice, Adv. Chem. Phys. 70, 441 (1988).
13. N. A. Mathew et al., J. Phys. Chem. A 114, 817 (2010). https://doi.org/10.1021/jp9088063
14. J. C. Wright, Int. Rev. Phys. Chem. 21, 185 (2002). https://doi.org/10.1080/01442350210124506
More about the authors
John Wright is the Andreas C. Albrecht professor in the chemistry department at the University of Wisconsin–Madison. Peter Chen is a professor in the department of chemistry and biochemistry at Spelman College in Atlanta, Georgia.


