Modeling the physics of storm surges
DOI: 10.1063/1.2982120
Eight of the ten largest cities in the world are located on the coast and 44% of the world’s population lives within 150 km of the ocean. 1 Unfortunately, coastal regions are often low-lying and thus susceptible to an increase in sea-surface elevation.
A storm surge is a potentially devastating rise in the sea surface caused by extratropical cyclones or by tropical cyclones such as hurricanes and typhoons. Surges can lead to large loss of human life, destruction of homes and civil infrastructure, and disruption of trade, fisheries, and industry. Since tropical cyclones have lower interior pressures and higher wind speeds than extratropical cyclones, they typically produce significantly higher surges than extratropical cyclones do. Their effects extend across the western Atlantic Ocean, the Gulf of Mexico, and the western Pacific and Indian oceans. Hurricane Katrina, the 2005 storm that struck southern Louisiana and Mississippi in the US, and Cyclone Nargis, which made landfall in Myanmar in 2008, provide ample evidence of the ruinous effects of storm surges.
As in most scientific fields, the early foundation of surge prediction relied heavily on observational data and on relationships that were suggested by those data. Surge events, however, are rare, and the associated historical data are limited. As described in the
The advent of digital computers in the 1960s led to discrete computational solutions of the governing equations, a significant advance over earlier empirical methods. But those early calculations were limited by the scope and scales of the modeled physics, the modest size of the regions over which the computations were performed, and the lack of spatial resolution of critical phenomena influencing the solutions. As a result, they required extensive case- and region-specific calibration or tuning of the boundary forcing and model parameters. Indeed, those early codes were at the crossroads of physics simulators, which rely on fundamental underlying physics, and tuned interpolators, which rely on observational data.
Unfortunately, extreme storms such as Katrina and Nargis often transcend the limits of local calibrations. Moreover, reliance on such calibrations precludes using models to answer important questions related to variations in the system itself or meteorological forcing mechanisms. An important example concerns the role of wetlands in coastal protection, which is difficult to assess if the predictive model is specifically tuned to work for the existing wetland configuration and for a select set of storms. Empirical rules of thumb based on observations alone may be of dubious value. Along the US Gulf Coast, observations have suggested that each 14.5 km of wetlands leads to a 1-m decrease in the maximum surge level. 2 If true, that is an extremely useful piece of information. The estimate could be dangerous, however, if it is false and used to estimate risk reductions in coastal areas behind wetlands.
In this article we describe some important concepts for storm-surge prediction and examine how the modeling community’s understanding of the relevant processes is evolving from one based on empirical data to one based on fundamental physics. That fundamental physics includes forcing mechanisms, all of which must be properly specified, and dissipation mechanisms that act on the flows and must be properly defined. Accurate modeling also requires an adequate specification of the system geometry to ensure appropriate hydrodynamic response to the forcing, including computational resolution of all energetic scales of motion. 3 We also explore the interrelationship between the physics and computational models and offer our perspective on future directions in forecasting and risk assessment.
Vulnerable New Orleans
It has long been recognized that hurricanes represent a particularly grave threat to New Orleans, Louisiana. In a 1929 article for the Engineering News-Record, Arthur M. Shaw noted that the recorded hurricanes of the early 20th century had approached New Orleans along southwesterly tracks. 8 In addition, he recognized the considerable vulnerability due to hurricane protection levees that were too low or poorly maintained and due to drainage canals that, as an editorial sidebar to the article pointed out, “like sword thrusts extend to the very heart of the city.” The sidebar also observed that “New Orleans is wide open to inundation should [a] storm come from another or eastern direction.”
In retrospect, the concerns expressed in the article were insightful. By and large, however, they have not been heeded in southern Louisiana, for several reasons. First, most of the emphasis on flood protection in the region has been on the much more prevalent threat from the Mississippi River. Second, at least prior to Hurricane Katrina, the infrequency of major hurricane surges made it difficult for planners to maintain a consistent focus on coastal hazards in the region. Third, analytical results obtained in previous studies were not taken at face value by many planners, perhaps justifiably so. Many of the dire warnings of impending flooding in the New Orleans area came from models predicting that the major threat was from overtopping of the Lake Pontchartrain levees on the north side of the city. As it turns out, that threat was highly overrated. On the other hand, the more serious threats to the levees in Saint Bernard and Plaquemines parishes and potential problems in the canals were not fully appreciated.
Geometry has a profound effect
More than two centuries ago, in 1775, Pierre Simon Laplace published the basic form of the equations that largely describe tides and storm-surge propagation in the coastal ocean and adjacent floodplain. The physics behind the equations involves the conservation of both water volume and momentum. The momentum balance involves various processes including acceleration, wind stress, momentum transfer from wind-generated surface waves, atmospheric pressure, Earth–Moon gravitational effects, frictional drag at the sea bottom, and lateral mixing. The online version of this article includes the shallow-water equations, a generalization of Laplace’s tidal equations, and gives physical interpretations of their individual terms.
Storm surges are strongly influenced by the geometry of the basin and continental shelf leading up to the coastal floodplain. As a first approximation, however, one can employ a simple, linear, steady-state equation to understand the influence of water depth and shelf width on wind-driven surges:
In the real world, coastal-basin geometries can be very complex both across and along the shelf. Natural scales of variability range from those of broad geomorphic features such as river deltas, barrier islands, and bays, down to detailed features—coastal rivers and streams, distributary channels in wetlands, and cuts through reefed areas, for example—that affect flows in coastal areas. Manmade features include extensive levees and raised highways that block flows, and canals, underpasses, and culverts that allow flows to pass through them. In addition, the scales of such forcing processes as are associated with wind and wave fields can range from meters in complex shallow areas to hundreds of kilometers in large deep basins. Geometric complexity thus produces a richness of interacting scales of motion that must be resolved correctly in modeling applications.
Some idea of the types and scales of features in a hurricane surge can be seen in figures 1 and 2. Figure 1 shows the simulated maximum water velocities during Hurricane Katrina. The velocity response functions and the high spatial gradients of the system, forcing functions, and surface elevation must all be sufficiently locally resolved if the physics of the water movement is to be properly simulated.

Figure 2. Propagating surges and changing wind-velocity fields are evident in these three snapshots of Hurricane Katrina simulations. In all three panels, dry areas are gray, and the color bar indicates water-surface elevation. Velocity magnitude as defined in the text scales with the size of the velocity arrow, with the size corresponding to 45 m/s given in the upper right of each panel. (a) Katrina makes its first landfall near Buras, Louisiana, at 6:00am local time, 29 August 2005. Here the surge, which has attained heights in excess of 6 m, is being driven against the levee system that runs along the Mississippi River in Plaquemines Parish. Within several hours the surge will spill into the Mississippi River and propagate upriver past New Orleans with an amplitude of 4.7 m. (b) By 9:00am local time, Katrina has moved across the river delta and over Lake Borgne. Part of the surge that was pushed against the levees has reflected into Breton Sound and is combining with the wind-driven surge to form a wave propagating across an area of relatively shallow water. This panel makes clear the effects of the coastal configuration on shaping the surge. Note the large amplitudes along the northern portion of the parish where the winds are directed toward the Saint Bernard levees and the lower surges where the winds are blowing away from the levees south of the parish. (c) Five hours after the first landfall, the surge along the Mississippi coast is at a maximum. The combination of a large expanse of very shallow water and the blocking of the flow toward the west has produced extreme surge heights of more than 8 m.
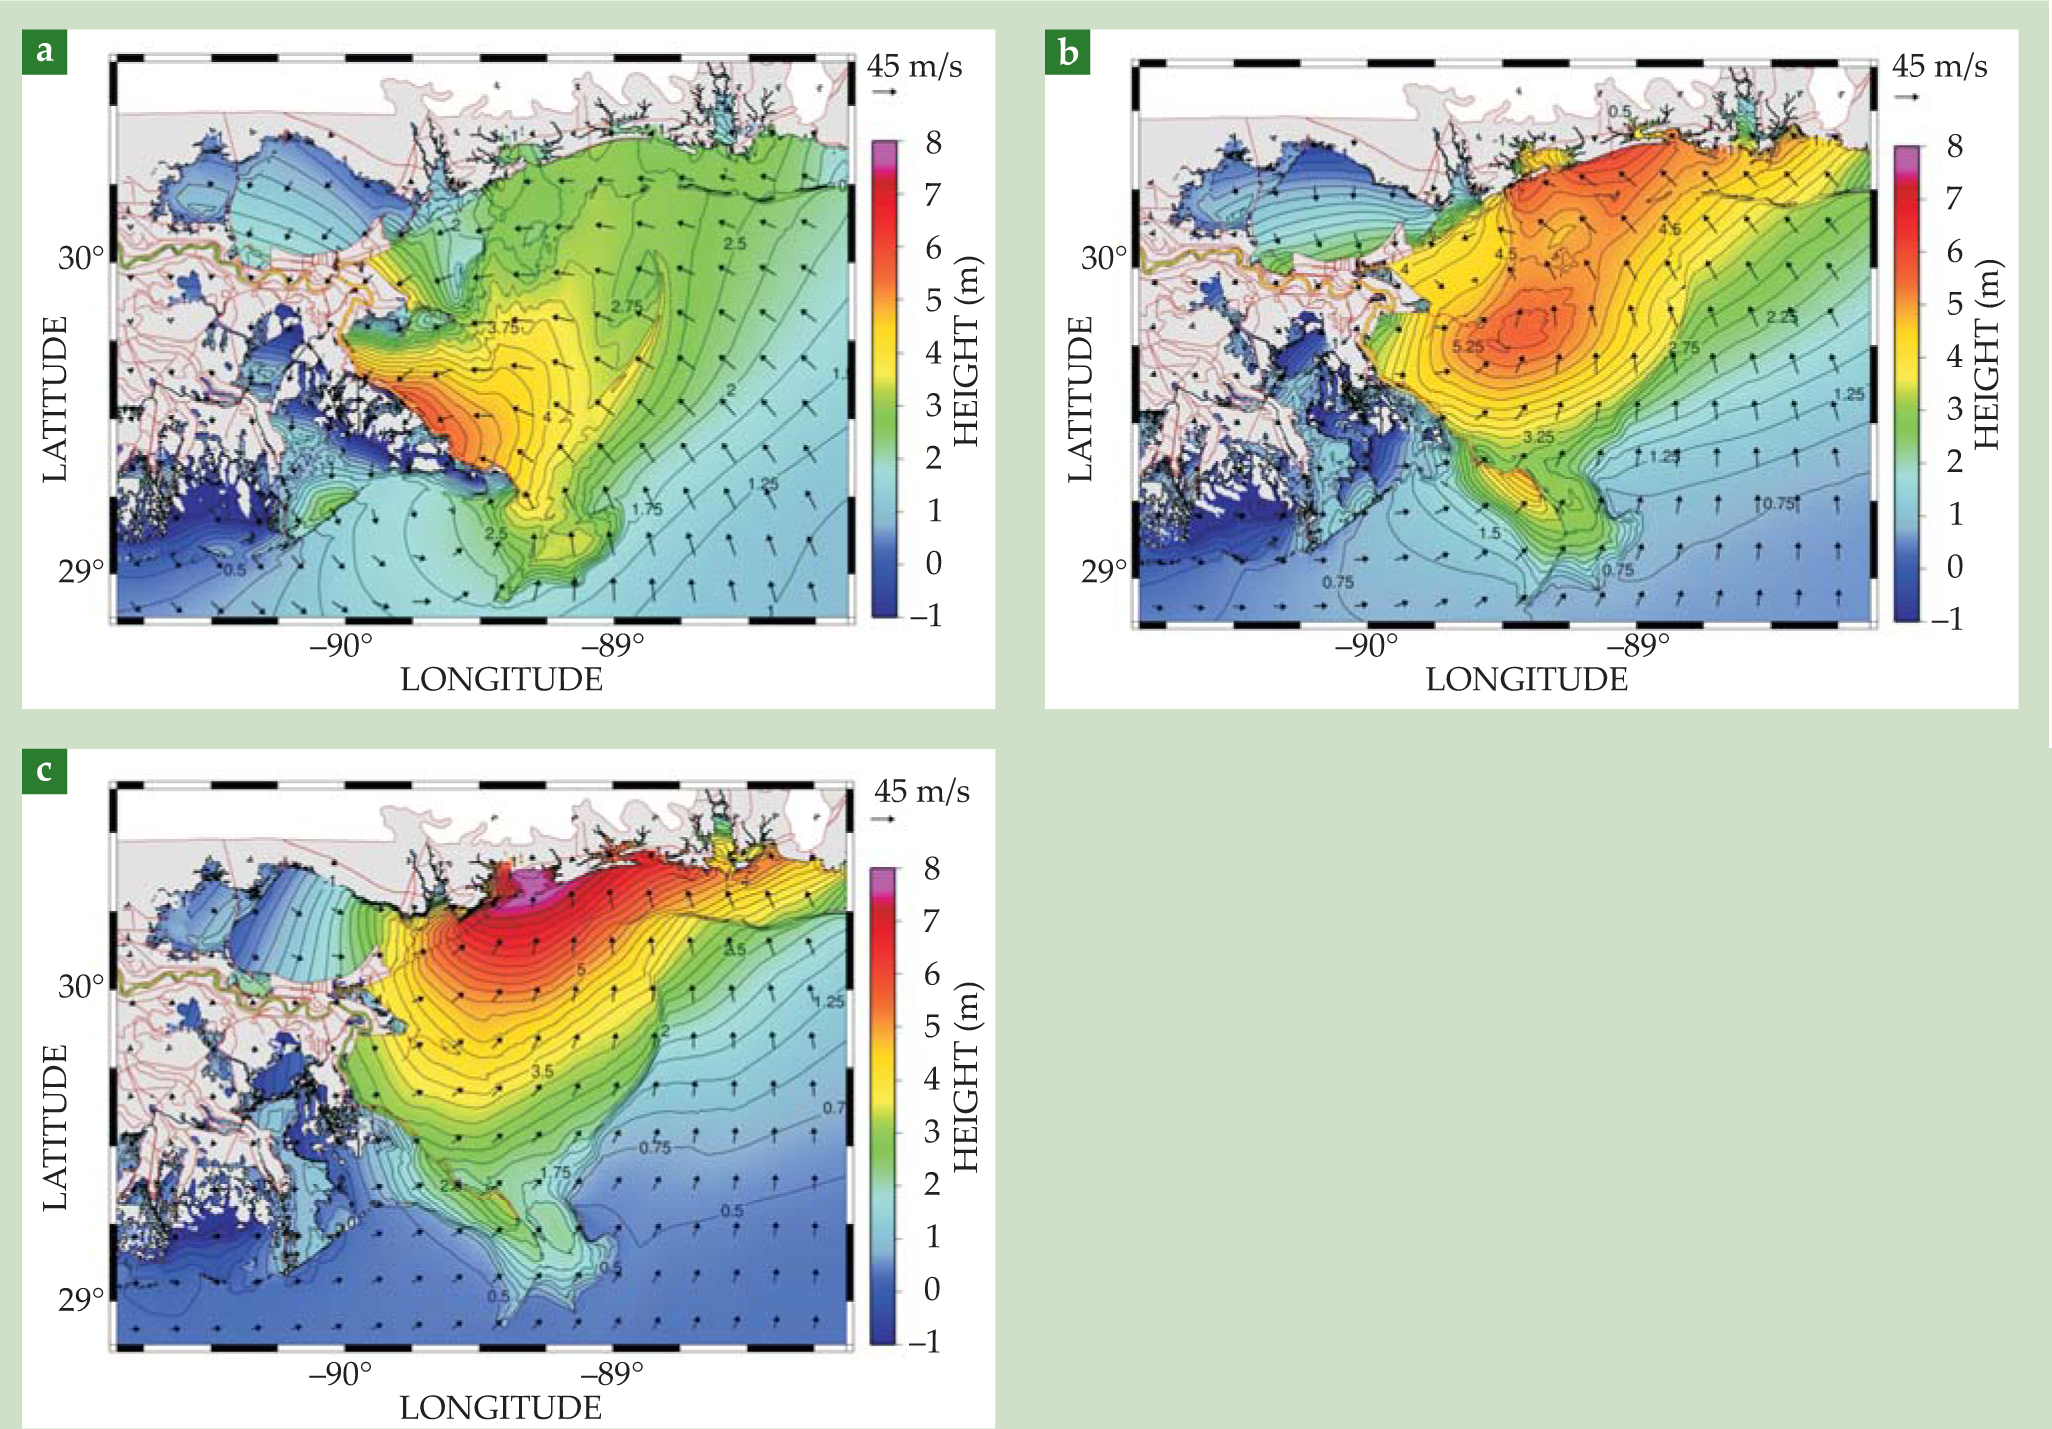

Figure 1. Water speed depends on geographic features. In this simulation, maximum speeds during Hurricane Katrina got as high as 2.5 m/s through inlets, through constrictions, and over barrier islands and approached 1–2 m/s over broad swaths of the continental shelf.
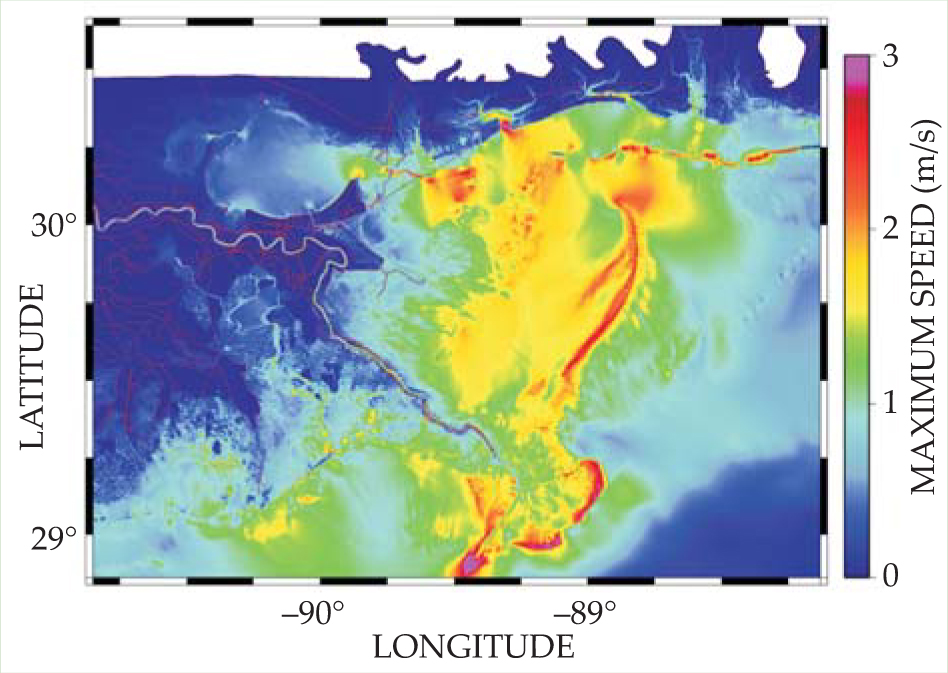
Figure 2 shows three snapshots from a model simulation of surge height and wind velocity during Katrina. Together they cover a five-hour period. Note, though, that hurricane wind speeds are not uniquely defined. Wind speeds obtained from aircraft excursions into hurricanes are often reported in newscasts as a hurricane’s “maximum wind speed.” Those measurements represent the fastest one-minute-duration wind speeds encountered by the aircraft at its flight level. Ocean-response models use winds averaged over 10–30 minutes, at a reference height of 10 m. Theoretical and observational evidence shows that the wind speeds at the reference level are only about 65-75% of speeds at flight level. Also, for a given height, wind speeds averaged over 10–30 minutes will typically be about 80% of the maximum 1-minute wind speeds. All told, the hurricane speeds used in ocean-response modeling are typically only in the range of 30-60 m/s.
Don’t neglect wave momentum
Coastal surges are driven primarily by momentum transmitted to the water column in situ by winds and by momentum that enters the water column after being transported over a distance by waves. Early surge models neglected the wave input and attempted to use local model calibration to compensate for that omission. The wind contribution to rate of gain of momentum per unit surface area in a water column can be written as
Much of the problem can be remedied by including momentum transfers from waves in addition to the direct transfer from winds. The flux of that momentum transfer, termed a radiation stress, arises from a wave-momentum flux divergence that is primarily related to wave breaking. Older models that neglected wave-momentum sources implicitly replaced c d in equation
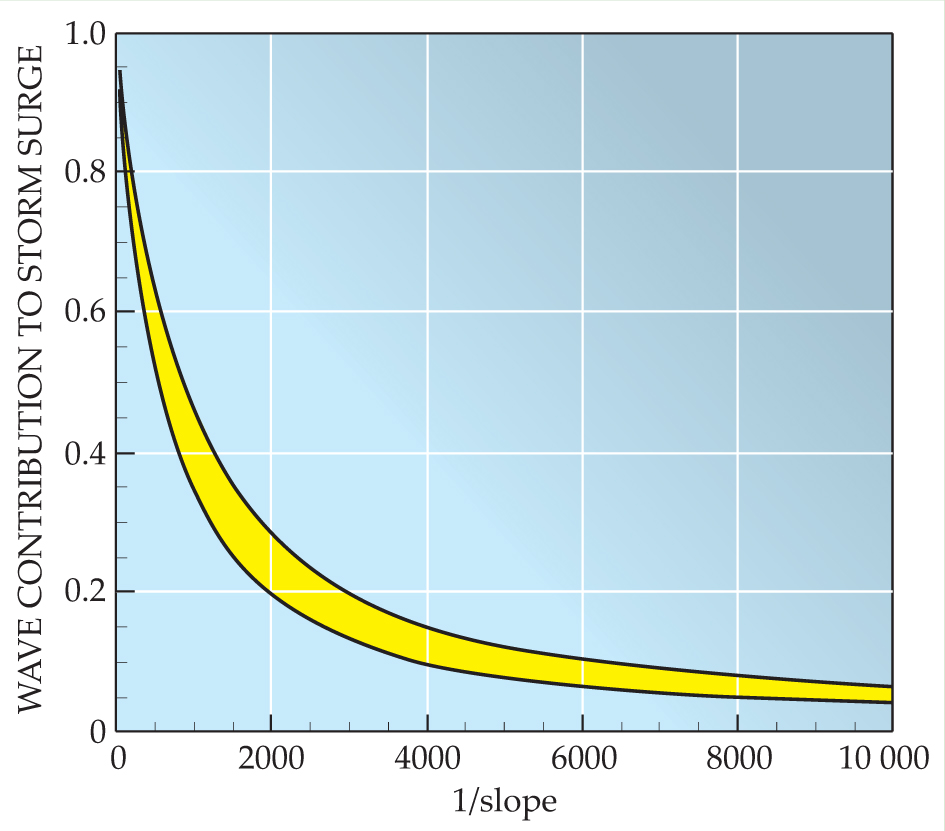
Not surprisingly, the different theoretical approaches, simulated wave-momentum transfer rates, and wave-breaking forms used in various models lead to different calculated values for R. Figure 3 shows the envelope of the resulting wave contribution to storm surge as a function of sea-bottom slope. For steep slopes, waves make the dominant contribution. Such steep slopes might be found, for example, near reefed islands or levees. In any case, figure 3 makes it clear that both the direct wind stress and the wave radiation stress need to be separately included in surge models.

Figure 3. Wind and waves transfer momentum that contributes to a surge. The wave contribution is highly dependent on the slope of the sea floor. The two curves bounding the yellow slice give a range for the fractional contribution of waves to the total surge, as calculated in various models. On steep slopes, waves make the dominant contribution. But even on shallow slopes, the wave contribution could still be significant; waves added about 2–4 feet (0.6–1.2 m) to the surges during Hurricane Katrina.
Hurricane wind fields can be complex. A range of phenomena interact to form complicated wind features such as spiral bands and embedded high-velocity regions. Land proximity and the cycles in which a hurricane’s eye wall breaks down and is reestablished (eye-wall replacement cycles) can also markedly affect winds in a storm. Despite that complexity, a hurricane is in essence a heat engine (see the Quick Study by Kerry Emanuel in Physics Today, August 2006, page 74 ), and much of the structure of its wind field has been found to be well represented by a relatively small set of parameters. Primary among those are storm intensity, size, forward speed, and a “peakedness” function. Coastal-surge models driven with best-fit parametric wind fields don’t have any greater systematic error than models employing wind fields that are not parametrically constrained. But because they don’t account for all the detail of a storm’s structure, the parametric models have 10–20% higher random errors.
Larger storms bring higher surges
A few months after Hurricane Katrina, the Sun Herald of Biloxi, Mississippi, wrote that “Camille killed more people in 2005 than it did in 1969.” 5 Many residents did not evacuate from areas that remained dry during Hurricane Camille, a category-5 storm on the standard Saffir-Simpson scale. They believed they were perfectly safe from Hurricane Katrina, only a category-3 storm when it struck the Mississippi coast. But Katrina was much larger than Camille, and tragically, that made it a more dangerous generator of storm surge. 6
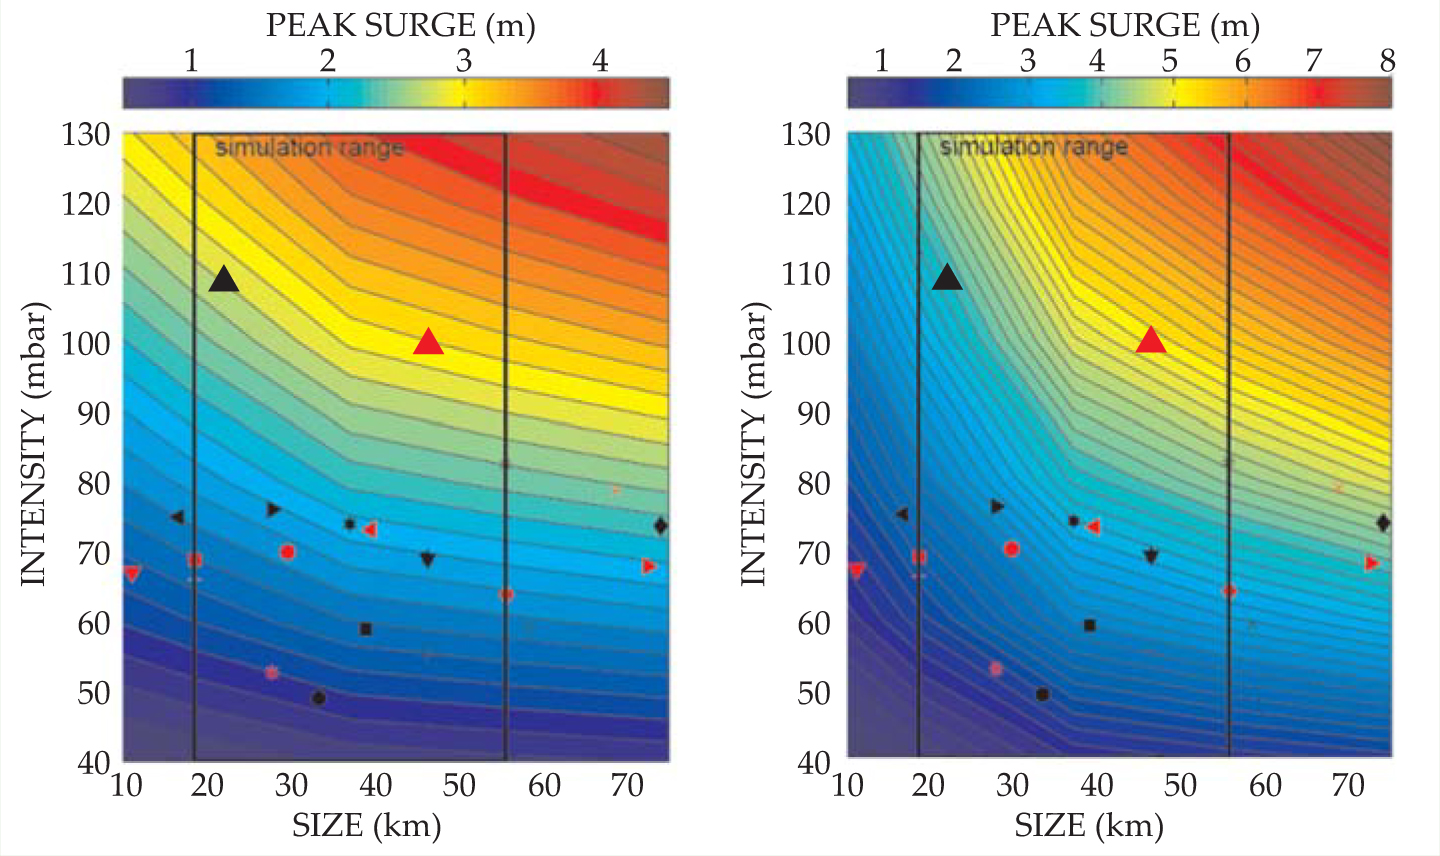
Figure 4 illustrates the influence of storm size and intensity on surge elevations for two slopes typical of shelf areas in the Gulf of Mexico. It drives home the important point that coastal inundation risks cannot be well posed in terms of only storm frequency and intensity. In particular, the data given in the figure suggest that along the Mississippi coast, a storm of Camille’s size cannot produce a surge equal to Katrina’s unless it is far more intense in the Gulf of Mexico than presently believed possible.

Figure 4. A storm’s size and intensity both contribute to storm surge. These contour plots show surges from idealized simulations that assumed a constant sea-bottom slope of 1/1000 (left) and 1/10 000 (right), typical values along the Louisiana and Mississippi coasts. Storm size is measured by the radius to the maximum winds and intensity by the difference between peripheral and central pressures. Results are extrapolated linearly beyond the simulation range indicated by vertical lines. The superimposed geometric figures give data for historic storms in the Gulf of Mexico. The two most intense storms are Hurricanes Camille (large black triangle) and Katrina (large red triangle). Even though Katrina was the less intense of the two, its size caused it to produce a much higher surge.
Simulations such as those presented in figure 4 can also help meteorologists estimate the probability that a hurricane will produce a surge of at least a given amplitude. The product of accepted individual probability distributions for storm intensity and size yields the joint probability distribution for storms with a specified intensity and size. Neglecting effects related to storm speed and the angle of approach to land, which tend to affect surges to a lesser extent, one can integrate the joint probability beyond the appropriate contour line in figure 4 to determine the probability that a storm will generate a surge of at least a given height. Given the observed frequency of hurricanes along the Gulf Coast, a hurricane that generated Katrina-like surges would come along once in about 400 years.
Wetlands don’t always mitigate surges
Modelers and community planners alike want to know the degree to which marshes and coastal forests slow inland surge penetration. A commonly stated rule of thumb says that a storm surge is attenuated at a rate of 1 m for every 14.5 km of marsh as the surge propagates inland from the shore. That estimate is based on a US Army report that examined inland penetration for seven storms occurring between 1909 and 1957 throughout southern Louisiana. 2 However, the data display considerable scatter and suggest that the attenuation rate for those storms ranges from −1 m per 20 km to −1 m per 7 km.
The frictional effects responsible for attenuation influence both the vertical and lateral structures of currents. In depth-averaged two-dimensional models, bottom friction is typically represented by a quadratic surface-drag law similar to that for surface wind stress. Lateral frictional effects are represented with a relationship similar to Newtonian viscous dissipation and require high resolution when spatial gradients in currents are large. After wind and wave forcing diminishes substantially, forces generated by friction and the gradient of the water surface become dominant in most coastal areas. The decoupling of the wind and wave forcings is fortunate because during the slow, frictionally dominated recession process, the modeling of friction can be validated independently of the representation of those forcing fields.
The assumption of a constant attenuation rate, as in the US Army report, implies a simple balance between the gradient of the water surface and bottom friction. The large attenuation range actually observed suggests that the situation is more complex. In fact, attenuation depends on many details, including momentum balance; the storm’s track, forward speed, duration, size, and associated waves; the regional bathymetry and topography, including shelf width and barrier islands; the local geometry; levee and raised-feature elevations; inland bathymetry and topography, including the channels that interconnect water bodies; and the local surface roughness.
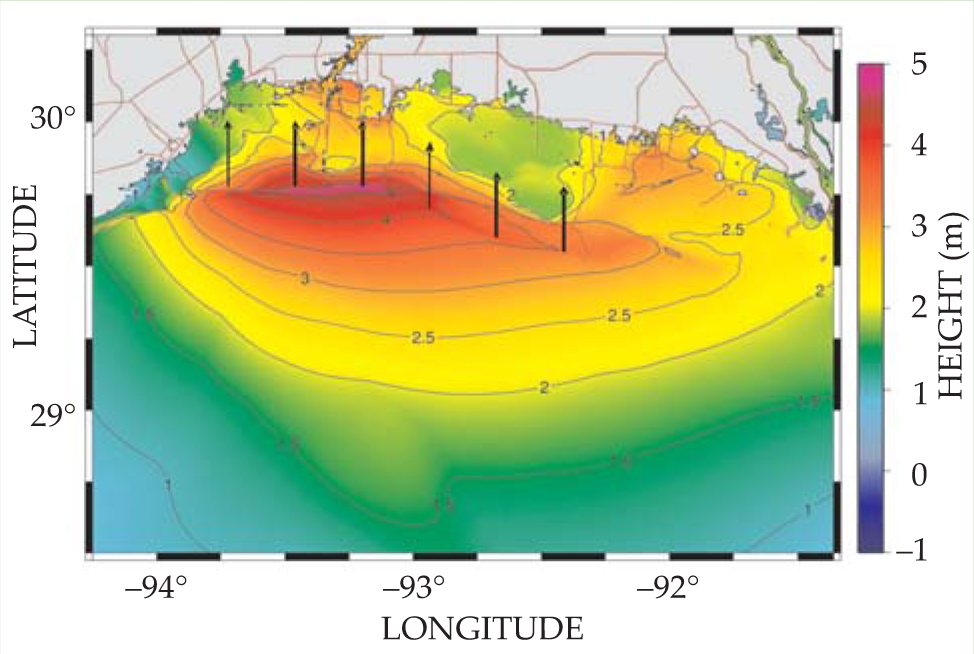
Increased frictional resistance slows the rate at which water moves inland. The resulting increased seaward surge levels can cause increased water levels in portions of the system. Increased friction also leads to a steepening of the surge front as it propagates inland. The surge amplitude can be attenuated by friction as the surge propagates inland, but the degree of attenuation also depends on the structure and duration of the forcing winds and waves. Hurricane Rita furnishes an instructive example; the storm struck the Gulf coast a month after Katrina. In western Louisiana, Rita, which was on a fast southeast-to-northwest track, blew water away from the coast and then plunged water onto land as the eye of the storm passed rapidly. Figure 5 shows the maximum computed water levels during the storm for the western part of the state; maximum inland attenuation rates ranged from −1 m per 11 km to −1 m per 19 km.

Figure 5. Inland marshes can attenuate storm surges, as happened in western Louisiana during Hurricane Rita. In this contour plot of simulated surge elevations, maximum surges occur at the coast. The vertical arrows aligned roughly east–west through the maximum indicate tracks inland from the coast that were used to estimate maximum surge attenuations.
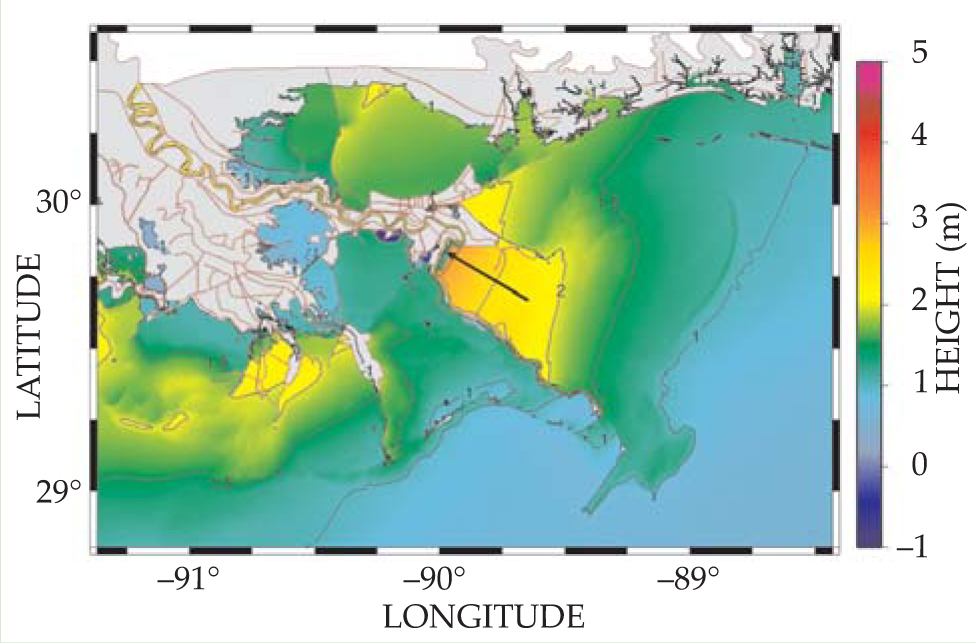
A very different scenario occurred in eastern Louisiana, where Rita blew nearly steady easterly to southeasterly winds toward the protruding delta. Figure 6 shows the computed maximum water levels in the region; indeed, during much of the event, the water-surface elevation was near that maximum. The maximum surge at English Turn occurred in an area fronted by almost 40 km of marsh and shows an increase of surge across the marsh up to the point where the flow was stopped by the Mississippi River levees. The dominant momentum balance here is between wind stress and water-surface gradient terms. Water levels, which increased over the marsh at a rate of +1 m per 46 km, would have increased more steeply if the winds had been higher. Thus, although friction played a role in how fast the water got to English Turn, it ultimately did not determine surge levels there since the winds blew almost steadily for a full day. In short, significant frictional resistance may slow the progress of water getting somewhere, but if the wind blows long enough and strongly enough, the water will get there.

Figure 6. For slow-moving storms with nearly steady winds, surge levels can increase as one moves inland over marshland. That’s what occurred in eastern Louisiana during Hurricane Rita. In this contour plot of simulated surge elevations, the arrow indicates the track inland from the edge of the Caernarvon marsh to English Turn that was used to estimate the maximum rate of surge increase.
The third dimension and beyond
To facilitate numerical solutions, modelers assume that vertical motions of water within coastal areas can be neglected relative to horizontal motions. In addition, they assume that an idealized depth-averaged slab of water will act like an actual water column that includes a vertical distribution of horizontal velocities. That additional simplification works well for pressure-driven flows such as tidal and riverine flows in shallow coastal waters; in those cases the vertical variation of the horizontal velocities is minimal except near the very bottom of the water column.
Wind and wave forcings, however, are applied at the top of the water column, and the combination of faster surface flows and a bottom return current can affect a coastal surge. Specifically, faster surface currents reduce the difference between wind and water speeds. As a result, the momentum transfer rate between air and sea is slightly reduced, and surges are diminished. Conversely, bottom-layer return currents yield a shoreward bottom stress that is added to the wind stress and thus enhances surge. Those opposing effects depend strongly on depth, local bathymetry, and vertical mixing rates in a water column. Parametric studies suggest that the net result is usually an increased surge level, in extreme cases by 25%.
Present-day model applications on large domains typically do not consider 3D effects. The good agreement of 2D simulations with observations suggests that the net forward momentum enhancements are lumped in with the air–sea drag coefficient, which in models is somewhat larger than suggested by observations. But lumping distinct processes into parameters ultimately reduces the accuracy of models. If modelers are to achieve more refined physics-based predictions, then the net effect of momentum flux distributed in space and time must eventually be carefully examined in well-resolved 3D simulations that may ultimately rely less on local calibration data. The increased computational burden for 3D simulation is not too large, perhaps a factor of two. So it is likely that a shift to vertically resolved simulations will occur in the near future.
The physics community’s understanding of the generation, propagation, and attenuation of storm surges has significantly evolved over the past decade. One major improvement has been to include wave radiation stress to force surges. Other significant advances include vastly improved resolution and the use of objective functions for specifying bottom drag. Recently the focus has shifted to accurate systemwide descriptions and multiprocess, high-resolution simulations that cover basin-scale regions. Such simulations are now possible thanks to the availability of high-performance, large-scale parallel-computing platforms. Given accurate, well-resolved forcing functions to represent winds, waves, atmospheric pressure, tides, and riverine flows, modelers could approach the capacity to simulate the fundamental physics.
Nowadays, models use historical data to determine subgrid-scale processes, and they are beginning to achieve high levels of accuracy without the extensive local tuning required in the early days. For example, in a study by the US Army Corps of Engineers that “hindcasted” Hurricane Katrina, 7 the standard deviation for the difference between observed and modeled high-water marks was 0.4 m. Still, that leaves considerable room for improvement, particularly considering the cost of protection systems and the impact of storm surges.
For example, future models will need to incorporate improved knowledge of the coastal winds in hurricanes, specifically the details of the eye-wall-structure and open-water wind-structure changes as hurricanes approach landfall. Furthermore, they will require better quantification of the physics of air–sea momentum transfer, including the effects of water depth and wave conditions. Missing in today’s formulations are the effects of wind, wave, and current flows through partially or fully submerged vegetation and integrated frictional effects of a wetland’s complex subgrid-scale channels and distributary systems.
Rainfall runoff should be considered as an integral part of flooding computations. It has traditionally been neglected in coastal hurricane flood modeling, but runoff becomes important in many contexts, including inland areas, partially or fully sheltered embayments, and leveed areas. Models will have to address the vigorous geomorphic changes associated with hurricanes, including deepening of channels; degradation and breaching of barrier islands, coastal dunes, and levees during the storm; and deposition of sediment during the floodwater recession. All of those can affect the details of a flood.
Given the existing observation base, we believe that the new generation of surge models can provide valuable information for most US coastal areas. Being more firmly based in the physics of the processes and less linked to local calibration, those models should also provide useful estimates of surges in a future that is likely to include sea-level rise, new flood-protection structures, variation in upland drainage patterns, and possible loss of wetlands. It is essential, however, for surge modelers to further refine the effects of the many processes that contribute to storm surge by distinctly accounting for each process and by using microscale observation to improve the parameters that estimate subgrid-scale effects.
We who model surges want decision makers to have confidence in our models and to trust them to provide vital information. But that will only happen if our predictive tools realistically represent all important surge processes. Accurate simulation methods will help those in charge to avoid repeating the historical pattern in which flood protection has been mainly a response to previous floods. Consider, for example, southern Louisiana. In response to frequent riverine and less frequent hurricane floods, levee systems there have been built higher and longer, often along the banks of existing rivers and bayous. That is not necessarily a good strategy for hurricane protection, particularly in the protruding Mississippi delta—long, continuous, high levees dam the flow, which results in increased surge levels. Furthermore, long continuous levees stop the natural sedimentation processes necessary to build up the delta and maintain wetlands.
Simulations suggest that it is possible to design localized ring levee systems that, in coastal areas, more effectively protect against floods and manage sediment. It is our hope that today’s and tomorrow’s models will be used for a rethinking of flood protection that rejects the traditional reactionary short-term approach and looks far into the future.
Both authors were supported in part by the System-Wide Water Resources Program of the US Army Corps of Engineers. The chief of engineers has granted permission for publication of the contents of this article. One of us (Westerink) was also supported in part by NSF, under grant OCI-0746232.
References
1. United Nations Atlas of the Oceans, Human Settlements on the Coast, http://www.oceansatlas.org/id/1877 .
2. Corps of Engineers, US Army Engineer District, New Orleans, Interim Survey Report, Morgan City, Louisiana and Vicinity, serial no. 63, US Army Engineer District, New Orleans, LA (November 1963).
3. J. J. Westerink et al., Mon. Weather Rev. 136, 833 (2008). https://doi.org/MWREAB
10.1175/2007MWR1946.1 4. M. D. Powell, P. J. Vickery, T. A. Reinhold, Nature 422, 279 (2003). https://doi.org/NATUAS
10.1038/nature01481 5. J. Norman, Sun Herald (Biloxi, MS), 12 February 2006, p. A1.
6. J. L. Irish, D. T. Resio, J. J. Ratcliff, J. Phys. Oceanogr. (in press).
7. Corps of Engineers, US Army Engineer District, New Orleans, Flood Insurance Study: Southeastern Parishes, Louisiana—Draft Intermediate Submission 2: Offshore Water Levels and Waves (rep. prepared for the Federal Emergency Management Agency, Region 6), US Army Engineer District, New Orleans, LA (January 2008).
8. A. M. Shaw, Eng. News-Rec. 102, 698 (1929). https://doi.org/ENREAU
More about the authors
Don Resio is a senior scientist at the US Army Engineer Research and Development Center in Vicksburg, Mississippi. Joannes Westerink is a professor in the department of civil engineering and geological sciences and concurrent professor of mathematics at the University of Notre Dame in Notre Dame, Indiana.
Donald T. Resio, 1 US Army Engineer Research and Development Center, Vicksburg, Mississippi, US .
Joannes J. Westerink, 2 University of Notre Dame, Notre Dame, Indiana, US .


