Looking for mantle plumes
DOI: 10.1063/PT.3.1217
Unlike most physics or chemistry experiments, which are run under carefully controlled laboratory conditions, the important experiments in Earth science are performed by Earth itself; scientists simply observe and interpret the results. Fortunately, Earth repeats its experiments, but seldom with the same results because the conditions of each experiment differ. The subduction of ocean plates, for instance, occurs at some dozen zones around the world, each displaying enough similarities with the others that researchers in the 1960s were able to form a conceptual model of the process.
The evidence for subduction is so compelling that it isn’t seriously questioned, although considerable effort remains directed toward understanding the causes of the observed variations. Mid-ocean ridges, where the plates diverge and hot mantle rock underneath flows upward to bridge the gap, are similarly understood in a plate-tectonic context. Together, ocean-plate spreading and subduction are the dominant elements of plate tectonics and Earth’s convection, with the sinking of the cool ocean plates driving its internal flow. Those plate-tectonic processes are also responsible for the vast majority of Earth’s volcanism.
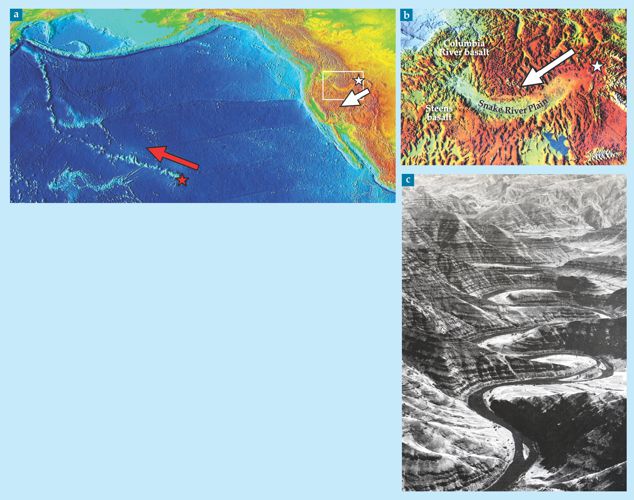
But not all volcanoes on Earth reside at mid-ocean ridges or subduction zones. Hot spots are regions of long-lived and extensive volcanism not directly associated with plate tectonics. The most well known is Hawaii, which is located in the middle of the Pacific plate and yet exudes more lava per unit area than anywhere on Earth. Over tens of millions of years, the volcanism has left a 6000-km track of islands and undersea mountains that are carried away by the moving plate. Yellowstone, at the northwest corner of Wyoming, is the largest active continental hot spot, and although relatively young, it, too, has left a clear volcanic track in its wake. Figure 1 shows the topography created by both Hawaii and Yellowstone. Many other hot spots of various sizes are found around the world; their locations are fairly stable with respect to one another, although their relative motions average several millimeters per year—roughly 10% of the speed of a tectonic plate.

Figure 1. The topographies of the Pacific Ocean Basin and the western US are scarred from volcanism at Hawaii and Yellowstone, respectively the most active hot spot overall and the most active continental hot spot on Earth. (a) The Hawaiian hot spot (red star) has left a trail of volcanoes on the Pacific Ocean floor as the Pacific plate moved in the west-northwest direction, designated by the red arrow. Prior to 47 million years ago, the hot spot was drifting southward, a direction researchers attribute not to plate motion, but to an earlier, different mantle convection field that deflected a rising plume.
The plume model
As early as 1963, J. Tuzo Wilson and others were impressed by the apparent age progression of some volcanic tracks. And shortly after Wilson’s and others’ discovery of plate tectonics later that decade, W. Jason Morgan proposed what’s become known as the plume hypothesis—the view that hot mantle plumes rise from great depths through the large-scale circulation systems caused by plate tectonics to produce relatively fixed hot spots. 1 The need for a rapid supply of hot mantle has made the so-called thermal boundary layer at the core–mantle boundary a prime candidate for the plumes’ source (see figure 2). The greater density of the core prevents convection across that boundary, so heat must be transported upward by conduction. But to conduct heat as rapidly as convection transports it around the core and mantle, the thermal boundary layer establishes a much greater temperature gradient.

Figure 2. Mantle melting, caused by decompression during a plume’s ascent. (a) As commonly envisioned, a mantle plume is a narrow column of buoyant rock that originates from the super-heated thermal boundary layer just above the core and feeds a hot spot on Earth’s surface. At depths of 410 km and 660 km, the mantle is thought to experience crystallographic phase transitions. (Courtesy of Edward Garnero, Arizona State University.) (b) In shallower reaches, mantle at average temperature (blue) and at elevated temperature (red), such as a plume or region hotter than average, follows different cooling curves. Melting begins at the solidus, the heavy black line, and the fraction F that melts increases with temperature and decreases with depth. Earth’s asthenosphere is a layer of soft, deformable uppermost mantle that is nearly or partially molten. Above it, the tectonic, lithospheric plate is relatively cool and viscous. Unlike mantle at average temperature, which remains solid as it rises, a plume intercepts the solidus and becomes increasingly molten. The melt can fracture the lithosphere and rise to the surface, where it erupts as lava.
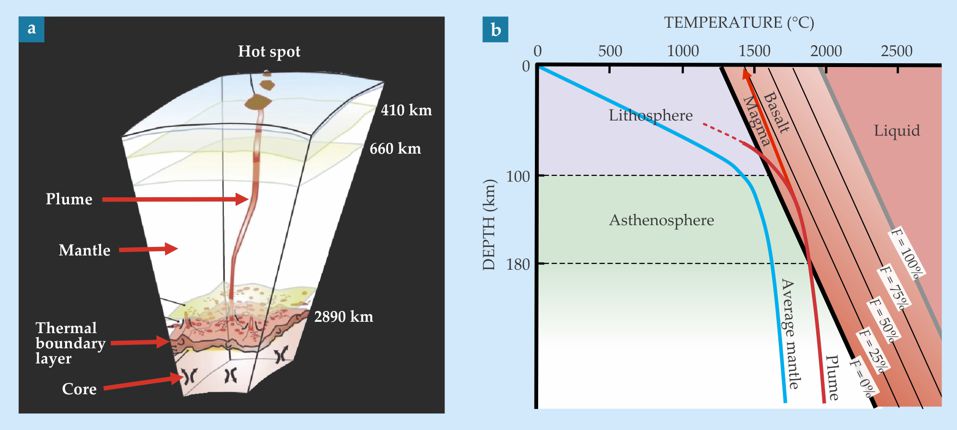
More recently, some geophysicists have suggested other thermal boundary layers in the mantle as sources of heat. Whatever the source, as a hot mantle plume rises and decompresses, it partially melts in the shallow upper mantle, creating magma. (Once that magma breaches the surface, it flows as lava and then solidifies into basalt.) The chemistry of hot-spot magmas, however, differs from those of the mid-ocean ridges in ways that suggest a source that includes some relatively primitive and presumably deep parts of Earth. In particular, hot-spot magmas often have elevated values in the ratio of primordial helium to radiogenic helium (3He/4He), which indicates their source in a part of Earth that has not lost its dissolved gases to the atmosphere.
Unlike a pot of water heated from below and cooled on top, probably only 10–30% of Earth’s surface heat comes from the core. Most of it is created by the radioactive decay of uranium, potassium, and thorium in the mantle, which makes Earth more like a pot of water in a microwave oven—heated within and cooled from above. Nonetheless, the core, with a surface area only about a quarter the size of Earth’s surface, does create a thermal boundary layer that could account for the focused upwellings of material and the supply of heat to hot spots at a rate that to many Earth scientists seems implausibly large to attribute to any other region of the mantle.
A narrow, chimney-like column is envisioned to account for surface hot spots, a picture that’s consistent with the fluid dynamics of a buoyantly rising low-viscosity fluid. The viscosity is low because rock viscosity depends strongly on temperature, and a columnar geometry minimizes the work required to deform viscous layers of Earth by connecting the source to the surface in a way that concentrates the deformation in a small volume.
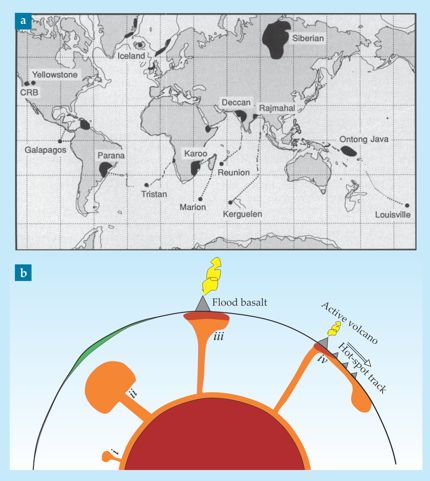
An active volcano resides at one end of a hot-spot track. But whenever a major hot-spot track can be traced back to its origin on the plate, it is found to begin with a flood-basalt event. The largest volcanic events created by our planet, flood-basalt eruptions occur every 20 million years on average. Figure 3a shows their global distribution. To account for the eruptions, many researchers invoke a model in which the columnar plume develops while rising through viscous mantle both a bulbous head and a trailing narrow tail, as illustrated in figure 3b. Besides the flood basalts, one predicted consequence of plumes is a 1- to 2-km rise in Earth’s surface a few million years before the hot spot erupts. That prediction makes the search for uplift preceding flood volcanism an important line of research.

Figure 3. Flood basalts and hot-spot tracks as plume heads and tails. (a) Earth’s distribution of continental flood-basalt provinces, each formed by thick lava flows from ancient eruptions covering thousands to millions of square kilometers, and the series of volcanic tracks—if still observable—that lead to an active hot spot. (Adapted from ref.
Problems with plumes
Although the plume hypothesis provides most Earth scientists with a compelling account of the origin and behavior of hot spots, it has skeptics. Their motivations range from a desire to be more soundly convinced by observations before adopting the model, to a belief that the mantle is compositionally stratified (and thus able to halt convective flow) at a depth of 660 km—well above the core–mantle boundary—to a view that the geologic evidence simply contradicts the hypothesis.
Perhaps the most significant inconsistency in the plume hypothesis is the presence of large bends in hot-spot tracks that do not correspond to changes in plate motion; Hawaii and Yellowstone are both good examples. The search for evidence of preeruption uplift in Earth’s surface has produced mixed results, largely because of the difficulty of resolving from the geologic record the timing of the predicted gentle upwarping spread over hundreds of kilometers. The clearest example of an absence of uplift is associated with Earth’s largest flood basalt, deposited 250 million years ago over much of Siberia. There, initial flows covered broad coal fields, an indication that the surface was near sea level right up to the time of initial eruptions and experienced no preceding uplift. Those and other problems have spawned efforts to provide alternatives to the plume hypothesis.
Most proposals suggest some form of local up-flow of material in Earth’s asthenosphere, the layer lying immediately beneath the cold, strong lithosphere, which comprises the plates. The asthenosphere is nearly or partially molten, and the pressure reduction that accompanies its ascent can cause it to melt without any added heat source (see PHYSICS TODAY, October 2006, page 21 ). Hot spots unrelated to plumes could thus originate from several processes: up-flow of the asthenosphere into the space vacated by detached and sinking parts of the lower lithosphere; convective overturn of unusually hot material in a heterogeneous asthenosphere; and convective flow that is driven by an upward-sloping boundary between the asthenosphere and lithosphere, possibly initiated by lateral temperature gradients.
In a potentially important process that can amplify and accelerate magma production, hot-spot-created melt infiltrates the cracks and pores of the lower lithosphere. The increase in density causes material to drip off the lithosphere, which invigorates local convection and magmatism. 2 Moreover, when the lithosphere is under even relatively low horizontal compression, melt can more easily fracture it and ascend.
None of those alternative processes on its own is thought to account for hot spots. Rather, what alternate models have in common is the view that the upper mantle is partially molten and convectively unstable, and any locally triggered convection promotes decompression melting. In that context, some researchers attribute the movement of volcanism along a track to a local convective flow pattern that is organized by plate motion with respect to the underlying mantle.
Yellowstone
The Yellowstone hot spot began with the most recent flood-basalt eruptions in history—the Columbia River basalt flows, which erupted about 16 million years ago from fissures in northeast Oregon. Those eruptions are joined to Yellowstone today by the Snake River Plain, a distinctive physiographic depression created by volcanism that propagated from eastern Oregon across Idaho to Yellowstone (see figure 1).
Those who research Yellowsone will object that such a simple description and application of the plume head-and-tail model to explain the hot-spot track belie a far more complex system. Their concerns illuminate the nature of the plume debate. Chief among them is that the Columbia River flood-basalt eruptions occurred in the wrong place, far north of the location predicted by the southwest motion of the North American plate. Several published accounts address the problem by modifying the plume model to include interactions between the rising plume and local structures within the upper mantle, such as subducted ocean lithosphere or thickness variations in the North American lithosphere.
Although proponents of the various modified plume models focus on different aspects of the anomalous behavior, several features of Yellowstone’s history are clear: Wide areas from north-central Nevada to southeastern Washington became volcanically active nearly simultaneously; the Steens flood-basalt eruptions of southeast Oregon were nearly contemporaneous with the Columbia River flood basalts 250 km away, but were initiated slightly earlier; the Columbia River flood-basalt eruptions dominated the overall volcanic output; and the southernmost volcanic centers, although not comparable in eruptive volume, form a series of calderas located where one would predict them—backtracking southwest from the Yellowstone hot spot along the path taken by North America’s plate (see figure 1b).
The most common accounting is that a plume head arrived at southeast Oregon and flattened underneath the plate, a process that redistributed the volcanism over a broad area that included the Columbia River basalts. 3 Unfortunately, that doesn’t explain why the Columbia River flood basalts were so much larger, or why they and the western Snake River Plain are so far off track; it also requires the plume head to flatten at an improbably fast rate. One popular idea is that the rising plume encountered the oceanic plate subducting beneath the Pacific Northwest and was dragged off course before finally breaking through beneath northeast Oregon. 4
Such proposals to explain the location and magnitude of the Columbia River flood basalt require geoscientists to either radically modify or abandon the model of a rising plume head for at least this series of eruptions in history. Even so, in a tectonically active planet where most events do not play out in isolation, processes such as those just described are possible, perhaps even expected.
How to see a plume
If only we could peer into Earth like we can across the universe. In a fashion, we can—not with light waves but with the elastic waves generated by earthquakes. The data that have been most useful for imaging the various mantle structures at depths of hundreds to thousands of kilometers are the travel-time delays of seismic waves captured by an array of seismometers. The delay or advance of a wave at a seismometer is a consequence of variations in its speed through the planet. In the mantle, those variations are primarily related to changes in material properties caused by temperature and, where it’s present, molten rock. Mantle that is hotter or partially melted is less stiff than cold, dry mantle and transmits seismic waves more slowly. A wave that encounters a mantle plume should thus have arrival times delayed by the wave’s interaction with the seismically slow mantle.
Our ability to resolve underground features, however, is limited primarily by the uneven and often sparse distribution of signal-producing earthquakes and of seismometers that record their seismic wave fields. The result is a highly heterogeneous and anisotropic sampling of Earth’s interior. Three other important problems limit imaging. First, because many structures, including plumes, are gradational in nature, seismic imaging is restricted to transmission methods such as the tomographic techniques used in medical scans. Second, essentially all seismic energy at frequencies greater than about 1 Hz is lost to attenuation during the transmission, a problem that limits researchers to wavelengths of about 10 km and longer. Third, the myriad temperature-varying seismic velocity structures in the upper several hundred kilometers of Earth’s mantle complicate the identification of plumes. Figure 4 illustrates that general heterogeneity.

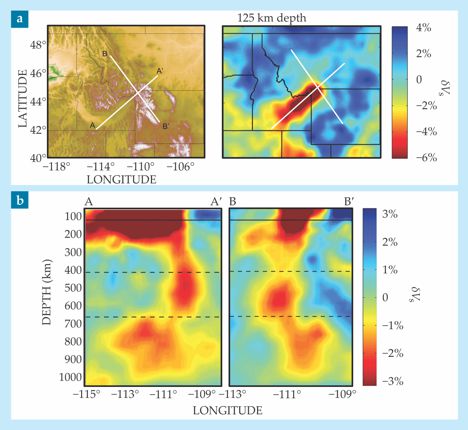
Figure 4. Seismic images of the Yellowstone plume. The arrival times of shear waves from distant earthquakes at a seismometer deviate by up to ±5 seconds. The waves’ delay or early arrival carries information about mantle properties such as temperature and melt fraction, which subtly alter the waves’ speed VS. Images of the speed variations—blue signifying cold, fast-transmitting material and red signifying hot, slow-transmitting material—are created by inverting the travel-time data and displayed at a given depth or as a function of depth. (a) An image of the topography around Yellowstone, including the Snake River Plain, puts the seismic image of the area at a depth of 125 km in context. (b) Vertical cross sections below the A–A’ and B–B’ lines on the topographic map reveal the continuous but tortuous form of the Yellowstone plume—even through transition depths (dashed lines), where crystallographic transformations are thought to occur. (Adapted from ref.
To better understand the ray-coverage problem, consider that most seismic rays begin from the few areas around the world that are seismically most active. Because a travel-time delay can occur anywhere along a ray path, the resulting images tend to show streaks along corridors where the density of rays is particularly high. For example, a set of delayed rays sharing a particular corridor of space tends to create a low-velocity streak along that corridor. Resolving structures beneath an array of seismometers thus depends on having sufficient rays crossing those corridors to discern precisely where the delay occurred.
The problem is worrying because a streak in a tomographic image along a steeply inclined corridor of high ray density could easily be mistaken for a plume. The way to significantly improve resolution of a putative plume is to deploy a dense array of seismometers over a wide area around a major hot spot and then record global seismic activity for several years. That would provide a dense set of widely distributed rays, each one associated with a delay time.
EarthScope
Yellowstone’s distance from the oceans makes it an ideal target for such an investigation. Since 2004 the USArray component of the EarthScope initiative has set up more than 400 portable seismometers, spaced 70 km apart, across the US (see PHYSICS TODAY, December 2003, page 32 ). Intended eventually to reach the East Coast, the array now covers the western two-thirds of the US and has allowed researchers to image surface crustal structure (see the article by Roel Snieder and Kees Wapenaar in PHYSICS TODAY, September 2010, page 44 ) and the deeper mantle structure beneath the Yellowstone hot spot with unprecedented accuracy. 5 , 6
Seismologists have captured both S-wave (shear wave) and P-wave (compressional wave) images. Figure 4 shows two-dimensional maps at a particular depth and as a function of depth, reconstructed from S-wave arrival times; warm and cool colors represent rock through which waves propagate relatively slowly or quickly, respectively. Large volumes of high-velocity (cool) mantle, such as that seen extending from 450 km to 800 km depth in cross section B–B′, are found scattered across the upper mantle. Using standard velocity-to-temperature scaling relations for unmolten mantle, those seismically fast regions are up to 300 °C cooler than the ambient mantle.
The origin of the low-velocity volume of material has been contentious among Earth scientists. But the structures, which appear to extend from shallow regions to well below the regions where minerals are thought to change crystallographic phase, provide strong evidence for a plume that feeds Yellowstone. The large degree to which the velocities are depressed requires elevated temperatures and, at least for material close to the surface (160 km or less), the presence of melt. 5
Normally, ascending mantle is thought to be in the solid state until it reaches a depth between roughly 160 km and 190 km; above that, volatile-enriched mantle begins producing a small amount of melt—on the order of tenths of a percent. It’s only when the mantle rises to a depth near 70 km—its volatile-free melting depth—that it extensively melts.
More relevant to the origin of the Yellowstone hot spot is the large complex-shaped low-velocity structure nearly beneath it that extends down to some 1000 km. Standard velocity-to-temperature scaling relations predict that low-seismic-velocity material at 250 km or deeper, where melt is not expected, is about 100–200 °C hotter than ambient mantle. Because the western US has experienced the cooling effects of a subducting oceanic slab for more than 150 million years, that low-velocity region is unlikely to be an anomalous volume of uncooled upper mantle.
If the imaged low-velocity structure is indeed the plume beneath Yellowstone, it is not the usually envisioned simple cylindrical conduit of figure 2a. The blobby appearance suggests either that the plume is disrupted by the subducting ocean lithosphere—apparent as the high-velocity (blue) upper- and mid-mantle structures near Yellowstone—or that it interacts with parts of the upper mantle whose minerals are experiencing major crystallographic phase transformations. Seismological evidence places the transformations at depths of 410 km and 660 km. Unfortunately, existing data do not permit geophysicists to distinguish between the possibilities.
A consideration of Yellowstone’s history leads to a similar conclusion about its complex behavior. The off-track location of the Columbia River eruptions and the arcuate Snake River Plain that connects active Yellowstone with the Columbia River flood basalt suggest that an ascending plume must have intercepted subducting ocean lithosphere 4 or flattened at the base of North American lithosphere. 3 In either case, one can argue that the plume is not vigorous enough to simply plow vertically through obstructions in its path.
Thanks to the high-resolution imaging enabled by EarthScope’s USArray, evidence is mounting in favor of the presence of narrow, deeply seated, active convective plumes that operate in a more focused fashion than the large-scale plate-tectonics circulation in which they are embedded. Other, less well-imaged hot spots around the world share many traits with Yellowstone and are often suggested as sharing similar origins. As imaging beneath the others improves, the hope is to resolve whether they are fed by simpler, more cylindrical conduits or exhibit structures as complex as Yellowstone’s, and whether deep-mantle origins are a general characteristic of hot spots.
If the plume hypothesis finds increasing observational support, then the irregular, bent hot-spot tracks behind much of the reluctance to accept it may well be regarded as sensitive probes of past mantle-convection patterns. Those patterns are, after all, influenced by subducting plates, changes in the plates’ motion, interactions at crystallographic-transition zones, and even deep mantle flow. 7
References
1. W. J. Morgan, Nature 230, 42 (1971). https://doi.org/10.1038/230042a0
2. L. Elkins-Tanton, Geol. Soc. Am. Spec. Pap. 388, 449 (2005).
3. P. Hooper et al., Geol. Soc. Am. Spec. Pap. 430, 635 (2007).
4. D. Geist, M. Richards, Geology 21, 789 (1993). https://doi.org/10.1130/0091-7613(1993)021<0789:OOTCPA>2.3.CO;2
5. B. Schmandt, E. Humphreys, Earth Planet. Sci. Lett. 297, 435 (2010). https://doi.org/10.1016/j.epsl.2010.06.047
6. M. Obrebski et al., Geophys. Res. Lett. 37, L14305 (2010), doi:10.1029/2010GLO43489. https://doi.org/10.1029/2010GLO43489
7. J. Tarduno et al., Science 324, 50 (2009). https://doi.org/10.1126/science.1161256
8. M. A. Richards, R. A. Duncan, V. E. Courtillot, Science 246, 103 (1989). https://doi.org/10.1126/science.246.4926.103
More about the authors
Eugene Humphreys is a professor of geophysics and Brandon Schmandt is his doctoral student, both at the University of Oregon in Eugene.


