Heat under the microscope
DOI: 10.1063/PT.3.2479


Heat conduction is familiar to us all and yet requires a wide range of physics—statistical mechanics, crystallography, and quantum mechanics among them—to fully explain. At the macroscale, heat conduction can be described as a diffusion process in which energy moves along a temperature gradient. The heat flux dissipated by the gradient depends on a material property, the thermal conductivity, as described by the constitutive relation, Fourier’s law. The heat equation, which is derived from Fourier’s law and the conservation of energy, describes the distribution of temperature over space and time.
Typically, the heat equation is assumed to be the end of the story for thermal conduction. However, the macroscopic theory leaves some fundamental questions unanswered. For example, why is diamond an exceptional thermal conductor, whereas gallium arsenide, a material with the same crystal structure, is only an average one? Lattice vibrations have long been understood as being responsible for heat conduction in a solid, but among the broad spectrum of the vibrational modes, which are primarily responsible for heat conduction? And what are the typical propagation lengths of those vibrations?
The answers to such questions are of considerable importance as electronic components become ever smaller and faster. In many applications—including LED lighting, high-power transistors, ultrasensitive radiation detectors, and thermoelectric waste-heat recovery—a microscopic view of thermal transport is essential. To list just one example, the rise in temperature near the active region of a transistor can be significantly higher—by tens of kelvin—than predicted by Fourier’s law, and that discrepancy affects the performance and reliability of devices ranging from smartphones to power amplifiers.
Ingredients for a theory
Starting nearly a century ago with Peter Debye, 1 who first attributed heat conduction in dielectric crystals to delocalized lattice waves whose quanta are called phonons, researchers developed many aspects of a microscopic theory. Subsequent work by Rudolf Peierls, 2 Paul Klemens, 3 and others led to the Boltzmann transport equation, which describes the transport of phonons as particles, and to an improved understanding of mechanisms by which phonons interact with each other and are scattered by such lattice imperfections as point defects and grain boundaries.
Based on those results, Joseph Callaway 4 and others introduced models in 1959 that express the thermal conductivity in terms of quantities such as group velocities and mean free paths (MFPs). In the simplest form of those models, the thermal conductivity relates to microscopic properties of the lattice through the kinetic equation

in which Cω is the frequency-dependent specific heat, υω is the group velocity, Λω is the phonon MFP, and ω is the phonon frequency. The specific heat and group velocity are set by the phonon frequency spectrum or, equivalently, the dispersion (shown in figure 1), which can be measured using inelastic neutron scattering and other techniques.

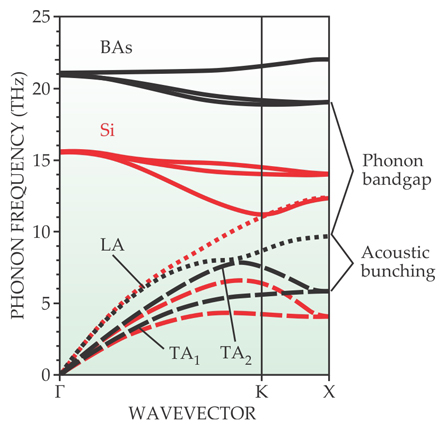
Figure 1. The dispersion curves of boron arsenide (black) and silicon (red) differ in ways that reveal why BAs has an exceptionally high thermal conductivity (~2000 W/m·K), about an order of magnitude higher than that of Si. High phonon scattering rates reduce the thermal conductivity. First, the large bandgap between the low-frequency acoustic phonons (broken lines) and higher-frequency optical phonons (solid) in BAs inhibits scattering among the different types. Si exhibits no such bandgap. Second, the acoustic branches in BAs are bunched together: Compare the frequency bandwidth of the longitudinal (dotted, LA) and two transverse (dashed, TA1 and TA2) acoustic modes in Si to those in BAs. The bunching restricts the phase space for scattering between acoustic phonons, and again inhibits scattering. Γ, K, and X are various crystal symmetry points in reciprocal space. (Adapted from ref.
At cryogenic temperatures, phonons don’t experience any scattering events that would randomize their motion, so they propagate as lattice waves and their dispersion is governed by the crystal structure and interatomic harmonic potential. Around room temperature and above, though, phonon scattering is pervasive, which leads to particle-like diffusion. The strength of the scattering can be described by the MFPs, the magnitudes of which vary widely with phonon frequency and are set by perturbations to the perfect harmonic lattice from phonon–phonon interactions or crystal defects.
Although the MFPs are key to understanding the origin of a solid’s thermal conductivity, they are difficult to measure or calculate directly, unlike specific heat and group velocity. Today, researchers often infer the MFPs by adjusting the fitting parameters of semiempirical models until they match the available experimental data. That approach can yield useful insight but is limited. First, it is not predictive, because the fitting parameters must be determined using experimental data before any conclusions can be drawn. Second, the inferred MFPs strongly depend on assumptions made in the fitting and thus are difficult to determine unambiguously. Separating multiple scattering mechanisms with different temperature and frequency dependencies is even more challenging. As a result, phonon MFPs remain unknown in most crystals.
Indeed, the difficulty of studying thermal phonons caused phonon MFPs to remain a mystery for decades. Unlike electrons, phonons have no charge and cannot be controlled by external electric or magnetic fields. Unlike photons, phonons have no benchtop source that can produce them at a particular frequency, nor can an arbitrary phonon mode be easily probed. Furthermore, whereas photons interact very weakly with each other, the nonlinear interactions between phonons are comparatively strong and responsible for thermal resistance at room temperature and above. Roughly speaking, studying phonons is akin to studying light using only light bulbs, without spectrometers, and with strong interactions between the photons. It’s no surprise that thermal phonons have remained so poorly understood.
Fortunately, recent advances in computational and experimental tools are providing a new window on the nature of heat conduction and how to manipulate or engineer heat flow in a material. This article discusses a few of those advances.
Computing phonons
Historically, researchers have studied thermal conductivity using semiempirical models. Preferable would be to calculate thermal conductivity from first principles—based only on a crystal’s atomistic structure—and thereby eliminate the fitting parameters. Such an approach, using density functional theory (DFT) to calculate interatomic potentials, has in fact been widely adopted and applied with tremendous success since 2007, when Boston College’s David Broido and coworkers proposed it for semiconductors and insulators. 5
Density functional theory has long been used to calculate phonon dispersions, but thermal conductivity calculations are harder: The thermal resistance of pure crystals is determined by the anharmonic component of the interatomic potential and thus requires extracting the cubic force constants, a much more challenging calculation than determining the harmonic force constants that set the phonon dispersion; see the
More specifically, the ab initio DFT approach has helped answer a fundamental question: What makes a good dielectric thermal conductor? Only a few high thermal-conductivity crystals, in which heat conduction is due to phonons, are known to scientists. Si, silicon carbide, and diamond are among them. Each of those materials has a high sound velocity—a signature of stiff interatomic bonding—and is composed of light elements. Those two basic characteristics provide a rule of thumb for gauging the thermal conductivity of other crystals. As a converse example, the low-thermal-conductivity material PbTe consists of heavy atoms and has a low sound velocity, which make it ideal as a thermoelectric (see the article by Gerald Mahan, Brian Sales, and Jeff Sharp in Physics Today, March 1997, page 42) .
Although those criteria are useful, they yield no information about the scattering mechanisms that limit phonon MFPs. It’s perhaps no surprise that no one has identified any new highly conductive crystals in 40-some years. Last year Lucas Lindsay and Thomas Reinecke from the US Naval Research Laboratory, together with Broido, leveraged the predictive power of ab initio techniques to propose a new and illuminating set of microscopic criteria for thermal conductors based on an analysis of the compound boron arsenide. 6 By traditional reasoning, one would expect BAs to have unexceptional thermal conductivity comparable to that of Si, around 200 W/m·K. Ab initio calculations, however, predict a value for BAs comparable to that of diamond, around 2000 W/m·K, which puts it in very rare company.
The high thermal conductivity can be explained by the unique vibrational properties of BAs, illustrated by its dispersion curve in figure 1. Acoustic phonons, or low-frequency vibrations of a few terahertz over multiple primitive unit cells, carry most of the heat in a pure crystal lattice. The thermal resistance in the crystal arises from three-phonon scattering, in which one phonon decays into two or two phonons combine into one, with the strength of the interaction determined by cubic interatomic force constants. But for the scattering to occur, each three-phonon process must satisfy momentum and energy conservation.
In most crystals like Si, the scattering events often involve an optical phonon—that is, a high-frequency vibration of the atoms within a single primitive unit cell. For example, a common scattering process consists of an optical phonon decaying into two acoustic phonons. But in BAs, many of those processes are forbidden because of the exceptionally large energy gap between acoustic and optical branches of the dispersion curve: The combined energy of two acoustic phonons is often smaller than that of a single optical phonon. The large energy gap comes from the difference in atomic mass between boron and arsenic.
The unique profile of the acoustic branches, which are bunched together in figure 1, further restrict scattering. Three phonons on the same branch cannot simultaneously satisfy energy and momentum conservation. If all acoustic phonons have the same dispersion, no acoustic phonon scattering is possible; and as the different phonons gradually bunch together, the phase space available for three-phonon scattering involving only acoustic phonons becomes increasingly restricted. For the particular case of BAs, midrange acoustic phonons are mostly excluded from scattering with either acoustic or optical phonons. The result is that phonons have long MFPs that exceed 1 µm.
The exceptionally high thermal conductivity of BAs can therefore be attributed to vibrational properties that limit the number of possible three-phonon processes. One can generalize the lesson of BAs to identify an important new trait for good thermal conductors: They should minimize the number of three-phonon interactions, a task that can be achieved with a large gap between acoustic and optical phonons and with acoustic phonon bunching.
Measuring the spectrum
Obtaining such microscopic insights experimentally has been all but impossible in the absence of any benchtop technique able to excite and probe arbitrarily chosen thermal phonon modes. In a typical benchtop experiment, a local heater excites a broad spectrum of phonons, and their integrated effect would then be measured as a temperature difference, which averages out the microscopic information of interest.
Recently an experimental technique has emerged that enables the direct measurement of microscopic properties using readily available equipment. The technique, MFP spectroscopy, 7 measures the distribution of MFPs, or the accumulated thermal conductivity as a function of MFP, for a wide variety of materials. The MFP distribution is a useful quantity because it reveals which phonons are the primary heat carriers and the key length scales at which a material’s thermal conductivity decreases from its bulk value due to scattering from grain boundaries or sample boundaries. 8
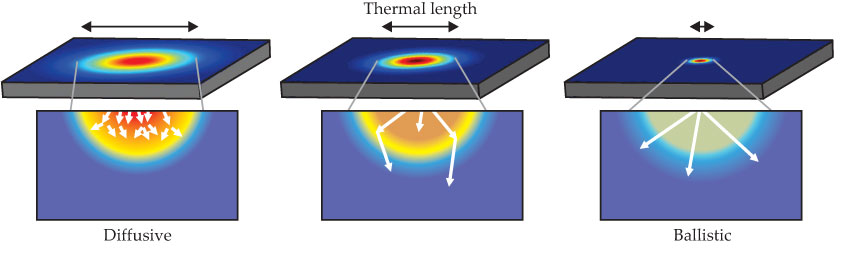
Mean free path spectroscopy is based on a simple principle: The heat flux dissipated by a given temperature difference depends on how a thermal length scale, the distance over which a temperature difference exists, compares with the MFPs. If that thermal length is much larger than the MFPs, the heat transport is diffusive and well described by Fourier’s law. At the other extreme, when the thermal length is much smaller than the MFPs, phonons move ballistically, and heat transport occurs by phonon radiation in an exact analogy to thermal radiation from a blackbody. 9 As the thermal length decreases and more of the phonon spectrum transports heat ballistically in the transition from the diffusive regime, Fourier’s law gradually breaks down.
As outlined in figure 2, MFP spectroscopy consists of observing the discrepancies in heat flux from the law’s prediction as the thermal length is systematically varied from the diffusive to ballistic regimes. To change that thermal length, one can, for example, change the diameter of a heating laser beam or, as discussed in the next paragraph, the fringe spacing of two interfering laser beams. The discrepancies in heat flux are observed as a thermal conductivity that appears to vary with the thermal length. 7

Figure 2. Mean free path spectroscopy. The heat flux dissipated by a fixed temperature difference depends on how the length over which the temperature difference exists compares with the phonon mean free paths. MFP spectroscopy consists of systematically varying that thermal length, typically using a laser beam whose diameter can change, and observing the transition from the diffusive to the ballistic regimes. From those observations the underlying MFP distribution can be obtained. The white arrows in the figure represent the average MFP relative to the thermal length.
To quantitatively understand the physics of MFP spectroscopy, consider a so-called transient grating spectroscopy experiment in which a sample is impulsively heated with a sinusoidal pattern of variable spatial period created by the interference of two laser beams. The transient thermal decay is measured using a probe laser, and the in-plane thermal conductivity is extracted as the only unknown parameter in a thermal model used to fit the decay curve.
Jeremy Johnson (now at Brigham Young University) and colleagues recently used the approach to study thin Si membranes with thicknesses of a few hundred nanometers.
10
The thermal conductivity measurements shown in figure 3a exhibit a puzzling trend. Although the conductivity is a material property and should thus be a constant, it plummets when the grating’s period is made smaller than 5 µm. The observation can be explained by accounting for the possibility that some phonons have MFPs comparable to the external thermal length set by the grating period. One of us (Minnich) recently used the Boltzmann transport equation (BTE) to examine the thermal transport that occurs in the experiment.
11
The BTE governs the evolution of a distribution function that describes the probability of finding a phonon in a region of phase (or reciprocal) space and real space, as discussed in the

Figure 3. The thermal conductivity keff of two thin (390-nm) membranes of silicon (a), normalized to their bulk value kbulk, is measured using transient grating spectroscopy, which heats the sample with the interference pattern between two laser beams. The inset illustrates the membrane’s initial sinusoidal profile of alternating hot (red) and cold (blue) fringes whose temperature decay is measured in time. The thermal conductivity rapidly decreases as the grating’s spatial period is reduced below 5 µm because some phonons have mean free paths (MFPs) comparable to that period. The scattering of phonons at membrane boundaries prohibits the measured conductivity from ever reaching the bulk value. (Adapted from ref.
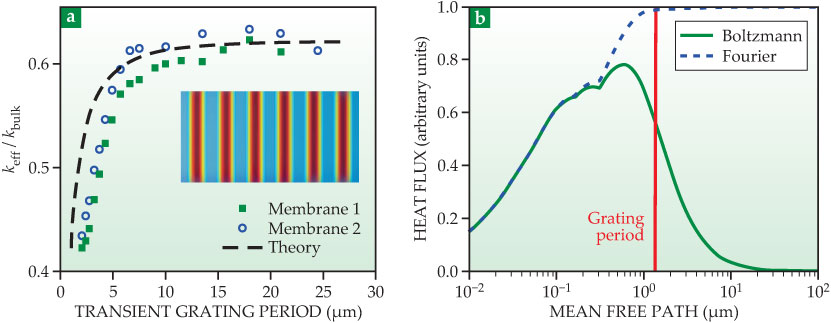
The key observation from that work is shown in figure 3b, which plots the calculated spectral heat flux versus phonon MFP for a grating wavelength comparable to some MFPs. Although Fourier’s law predicts that long-MFP phonons contribute significantly to heat conduction, the calculated heat flux from phonons with MFPs comparable to the transient grating period is far smaller than that.
The physical discrepancy turns out to be useful because experimentalists can exert control over the phonons in an experiment. Rather than measure the contribution of all phonons to heat flux, they can instead examine the contribution of different-frequency phonons by systematically varying the thermal length via the grating period. That extra degree of freedom provides access to the phonon spectrum itself rather than the averaged result.
Although the MFP spectroscopy technique is young, it has already produced important insights that agree with predictions made by ab initio methods described in the
Phononic crystals
The MFP is a critical microscopic property, but it is not the only factor influencing heat conduction by phonons. According to the equation on page 27, heat capacity and group velocity are also important, which raises a question: Is it possible to manipulate thermal conduction by changing those parameters?
At first sight it does not appear easy, because the dispersion relations that set both the group velocity and heat capacity are determined by the microscopic details associated with atomic bonding in a material. However, the wavelengths of many phonons involved in thermal conduction exceed the lattice constant. So if the material in question is structured at some longer length scale—by drilling a periodic array of holes, say, through the lattice—the phonons with wavelengths around that length will interfere just as x rays do in crystals. Such structures are called phononic crystals, 13 in analogy with the better-known photonic crystals, whose periodic features control their interaction with light. The interference in phononic crystals modifies the band structure of the long-wavelength phonons enough that one can engineer changes in both the density of states, which affects heat capacity, and the group velocity.
What length scale should one use? Because the spectral energy density of low-frequency thermal phonons has the same Planck distribution shape as electromagnetic thermal radiation from a blackbody, the strongest effect on thermal conduction is produced by disturbing phonons near the maximum energy density. That maximum follows the famous Wien’s displacement law, which states that the wavelength of the dominant phonons is inversely proportional to temperature. At room temperature that wavelength is on the nanometer scale; but by cooling the material down to cryogenic temperatures, the dominant wavelengths increase to the micron scale. Modern lithographic techniques can thus make phononic crystals with periodicities that correspond to the wavelengths of the dominant thermal phonons.
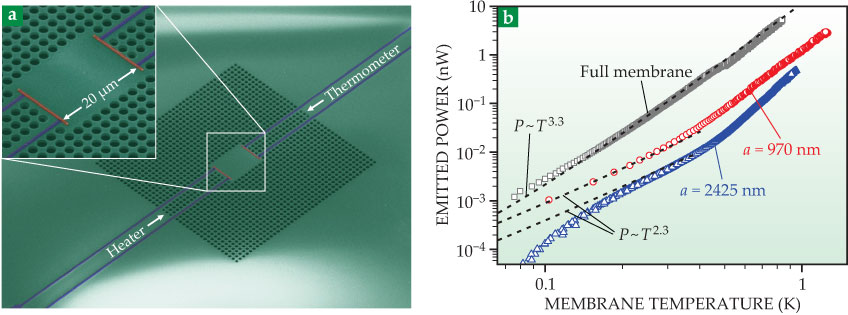
A group led by one of us (Maasilta) followed that line of reasoning last year and studied thermal conductance in 2D phononic crystals (PnCs) at subkelvin temperatures. 14 Figure 4a shows a scanning electron micrograph of a sample consisting of an array of holes etched in a half-micron-thick silicon nitride membrane. We compared two PnCs having different periodicities with an unetched sample and observed a strong reduction in thermal conductance—up to a factor of 30—with a concurrent change in the temperature dependence (from T3.3 to T2.3), as plotted in figure 4b.

Figure 4. A two-dimensional phononic crystal, fabricated by drilling holes in a silicon nitride membrane (a) and imaged using scanning electron microscopy. The heater and thermometer are tunnel junctions. (b) The observed emitted phonon power P versus temperature T for a full, uncut membrane (black squares) and two phononic crystals (red circles and blue triangles) that differ in the hole lattice constant a. Though the two crystals had the same amount of material removed to produce the holes, their thermal conductances varied significantly, clear evidence of phononic effects. The two crystals’ T2.3 dependence of power on temperature also varied from that of the uncut membrane, further evidence of phononic, coherent interference effects. (Adapted from ref.
Each PnC had the same amount of material removed and therefore should have produced the same reduction in thermal conductance, without any change in temperature dependence, in the absence of phonon interference. Because no scattering occurs at subkelvin temperatures, one can only conclude that coherent interference among phonons is behind the modification to the band structure and our observations.
From the numerical simulations, we were able to calculate how the phonon density of states and the average group velocity change in a PnC structure. The thermal conductance is proportional to the product of the two factors, and according to the calculations, both decrease in the frequency range relevant at low temperatures. The most important factor turns out to be the group velocity: Phonons in the PnC structures slow down by about a factor of 6. Curiously, one of the PnCs even exhibits a bandgap—a frequency region devoid of phonons. Nevertheless, the other PnC structure (without the bandgap) exhibits a lower thermal conductance. Thus the existence or size of a bandgap does not seem to predict anything about thermal conductance. Work is in progress to understand what type of structure most reduces the thermal conductance and how large an effect is possible.
In the low-temperature regime, PnC structures could be developed into ultrasensitive bolometric radiation detectors—similar to the ones recently used in the BICEP2 experiment to observe primordial gravitational waves from the polarization fluctuations of the cosmic microwave background (see Physics Today, May 2014, page 11 ). Researchers have also studied whether phononic effects can be used to control thermal conduction at room temperature. In that regime, applications include improving the performance of thermoelectric devices, which benefit from reducing thermal conductivity without reducing electrical conductivity.
To apply the results of low-temperature studies to room temperature, however, the periodicity of the PnC must be scaled down to nanometers. That’s challenging but not out of reach. And the fact that a substantial amount of heat is carried by phonons with MFPs longer than a micron in some semiconductors at room temperature offers hope that modification of the band structure can also be used to engineer a material’s conductivity at higher temperatures. The field is too young to predict how those manipulations will bear on applications, but one thing is clear: The age-old problem of heat conduction has new tricks up its sleeve—even after 100 years of study.
Box. A microscopic theory of phonons
The ab initio approach to thermal conductivity is based on solving the Boltzmann transport equation (BTE) with input from density functional theory (DFT). 5 The BTE governs a distribution function Ψ that describes the probability of finding a phonon in real space and phase space. Under the assumption of a uniform temperature gradient ∂T/∂xβ along the xβ direction, the equation is given by

where n0 is the Bose–Einstein distribution, W±λλ′λ″ are the three-phonon scattering rates, vβλ is the group velocity, T is the absolute temperature, and λ denotes a particular phonon mode with some wavevector and polarization. The left-hand side of the equation describes the change in phonon population due to advection induced by the temperature gradient, and the right-hand side is the three-phonon collision term due to phonon–phonon interactions. The thermal conductivity k can easily be determined once Ψ, the solution to the equation, is known.
The calculation is clearly quite formidable, and in the early days of thermal conductivity studies, before the development of quantum mechanical simulation packages and powerful computers, it was essentially impossible to solve. The first step is to determine the scattering rates W±λλ′λ″, which are given by Fermi’s golden rule. The golden rule, in turn, requires the cubic interatomic force constants, which are defined as the third derivative of the total energy with respect to atomic displacements. Of course, calculating those force constants requires an accurate interatomic potential, which can be obtained from standard DFT codes such as Quantum Espresso or VASP. A frequently used approach to obtain the cubic force constants is to calculate the harmonic force constants while atoms in the computational cell are systematically displaced. The cubic force constants can then be calculated as the finite-difference derivative of the harmonic force constants. They then give the scattering matrices on the right-hand side of the equation above.
The next step is to solve the BTE, itself a daunting task. Again, the principle difficulty is in the collision term, which couples triplets of phonons together by three-phonon scattering. Identifying all of the possible scattering processes requires many searches through the entire computational phase space, which consists of hundreds of thousands of discrete points. The collision term can be written as a linear system of equations with Ψ, the unknown distribution function, as the solution. The number of elements in the matrix for that linear system is equal to the square of the number of phase-space points—on the order of tens of billions of elements. Solving the equation with matrix inversion methods is certainly possible but computationally expensive.
Fortunately, a much faster method exists. Rather than solving a linear system, the BTE can be solved by iteration—a prior guess of the solution is used to update the solution until convergence is achieved. The first guess turns out to be the so-called relaxation time approximation of the BTE. After tens of iterations, depending on the material, the procedure converges and Ψ is determined.
Finally, the thermal conductivity tensor kαβ can be obtained directly from

where V is the volume of the crystal, ω is the phonon frequency, and vαλ is the group velocity in the xα direction. However, the key application of the ab initio approach is not simply calculating thermal conductivity but understanding its origin in a material. At the end of the procedure, the solution of the BTE reveals not only the contribution of every phonon to thermal conductivity over all phase space but also which phonons couple to which other phonons.
References
1. M. Planck et al., Vorträge über die kinetische Theorie der Materie und der Elektrizität …, B. G. Teubner, Leipzig, Germany (1914).
2. R. Peierls, Ann. Phys. (Leipzig) 395, 1055 (1929). https://doi.org/10.1002/andp.19293950803
3. P. G. Klemens, in Solid State Physics, vol. 7, F. Seitz, D. Turnbull, eds., Academic Press, New York (1958), p. 1.
4. J. Callaway, Phys. Rev. 113, 1046 (1959). https://doi.org/10.1103/PhysRev.113.1046
5. D. A. Broido et al., Appl. Phys. Lett. 91, 231922 (2007). https://doi.org/10.1063/1.2822891
6. L. Lindsay, D. A. Broido, T. L. Reinecke, Phys. Rev. Lett. 111, 025901 (2013). https://doi.org/10.1103/PhysRevLett.111.025901
7. A. J. Minnich et al., Phys. Rev. Lett. 107, 095901 (2011). https://doi.org/10.1103/PhysRevLett.107.095901
8. C. Dames, G. Chen, in Thermoelectrics Handbook: Macro to Nano, D. M. Rowe, ed., CRC/Taylor & Francis, Boca Raton, FL (2006), chap. 42.
9. T. Klitsner et al., Phys. Rev. B 38, 7576 (1988). https://doi.org/10.1103/PhysRevB.38.7576
10. J. A. Johnson et al., Phys. Rev. Lett. 110, 025901 (2013). https://doi.org/10.1103/PhysRevLett.110.025901
11. A. J. Minnich, Phys. Rev. Lett. 109, 205901 (2012). https://doi.org/10.1103/PhysRevLett.109.205901
12. K. T. Regner et al., Nat. Commun. 4, 1640 (2013). https://doi.org/10.1038/ncomms2630
13. Y. Pennec et al., Surf. Sci. Rep. 65, 229 (2010). https://doi.org/10.1016/j.surfrep.2010.08.002
14. N. Zen et al., Nat. Commun. 5, 3435 (2014). https://doi.org/10.1038/ncomms4435
More about the authors
Ilari Maasilta (maasilta@jyu.fi) is a professor of physics at the University of Jyväskylä in Jyväskylä, Finland. Austin Minnich (aminnich@caltech.edu) is an assistant professor of mechanical engineering and applied physics at the California Institute of Technology in Pasadena.


