Gravitational Lenses
DOI: 10.1063/1.1784273
Albert Einstein’s general theory of relativity, completed in 1915, provided the tools needed to describe the universe’s structure and to determine the propagation of light through it. It showed that if one pretends that spacetime has no curvature, then light would appear to be deflected as it passes by a gravitational potential well. Such bending—now called gravitational lensing—was seen for the first time during the solar eclipse of 29 May 1919 by British expeditions in Sobral, Brazil, and on Príncipe Island, off the west coast of Africa. The expeditions observed stars near the edge of the Sun and measured their displacement to be closer to Einstein’s prediction of 1.7 arc-seconds than to the Newtonian prediction of half that value. The 1919 measurements represented a major triumph for Einstein’s theory.
For 60 years, the deflection of light by the Sun was the only known example of gravitational lensing. However, that changed in 1979 when Dennis Walsh, Bob Carswell, and Ray Weymann discovered a quasar that was multiply imaged by a massive foreground cluster galaxy. 1 Since then, the field of gravitational lensing has rapidly developed, both observationally and theoretically. Astronomers now use gravitational lensing to investigate the distribution of matter and energy in the universe from cosmological to stellar scales.
The expanding universe
The universe appears to be homogeneous and isotropic on its largest scales. And it is expanding. The history and future of its expansion are best captured by a single function, the scale factor a(t), which is proportional to the mean separation of galaxies as a function of cosmic time (t). 2 It remains one of the main goals of observational cosmology to measure the scale factor accurately and to use the dynamical equations of motion governing cosmic expansion to infer the universe’s material content.
A simple and natural cosmological model, inspired by inflation, posits that the spatial geometry of the universe is flat, not curved, and that a fraction Ωm of its current total mass-energy density is in the form of predominantly cold matter—that is, matter that had near-zero speed at the onset of galaxy formation. The remaining fraction, ΩΛ = 1 – Ωm, is in the form of a constant dark energy density. The normalized first derivative of the scale factor
Observations, notably those of Cepheid variable stars, distant supernovae, and the large-scale structure of mass and microwave background fluctuations, are consistent with a flat universe with H 0 = 72 km/(s·Mpc), Ωm = 0.3, and ΩΛ = 0.7, with roughly 10% errors (see reference , for example; page 19 in this issue; and three pieces in the April 2003 issue of Physics Today: page 21 , Michael Turner’s Reference Frame on page 10 , and the article by Saul Perlmutter on page 53 ). Cosmologists believe that only 15% of the contribution to Ωm is from baryonic matter in the form of stars and gas; the remainder is styled “dark,” and possibly comprises a new, supersymmetric, weakly interacting particle.
The accelerating expansion of the universe, the preponderance of dark energy, and the large percentage of cold matter that is not baryonic are all remarkable features of the cosmological model suggested by recent observations. Cosmologists need to probe those surprising features in a variety of ways and to improve the accuracy of their measurements.
The underlying model itself needs to be examined as well. For example, the dark energy density, unlike Einstein’s cosmological constant, may vary with time and have a rich, dynamical behavior. Alternatively, there may be no dark energy at all, and observers may be seeing the effect of gravitational-field leakage into hitherto unseen extra dimensions. (See the article by Nima Arkani-Hamed, Savas Dimopoulos, and Georgi Dvali in Physics Today, February 2002, page 35 .) Deciding between those and even more radical proposals is an important challenge for the physical sciences. A good way to start is by constraining the function a(t). Gravitational lensing helps to do that in several ways. 4
Measuring the Hubble constant
The constant H 0 is one of the most important parameters in physical cosmology, because it indicates both the size and the age of the universe. However, measuring the Hubble constant has been plagued by difficulties ever since the 1920s, when astronomers discovered that the universe is expanding.
The classic approach has been to construct a so-called cosmic distance ladder: Astronomers use nearby celestial objects, for which distances are easier to measure, to calibrate the distances to objects that are farther away. In that manner, they can build up distances to far-off objects that effectively move with the Hubble flow—that is, the average speed with which galaxies would recede from us in a completely homogeneous and isotropic universe. Astronomers, though, have only a poor understanding of the underlying physics of many of the objects used in constructing the distance ladder. Thus, the empirical corrections they apply to observed data can hide biases that limit the reliability of results obtained using the classic ladder approach.
Gravitational lenses promise an accurate, independent measurement of the Hubble constant in a single step. The idea, as first proposed by Sjur Refsdal in 1964, 5 is to observe a multiply imaged variable source. Lenses that yield multiple images, such as those shown in figures 1–3, are called strong. The total travel times associated with the different images created by strong lenses can differ by days or even years and are inversely proportional to H 0. Such time delays are ideally suited to accurate measurement by ground-based radio and optical telescopes in dedicated monitoring programs. The physics of gravitational lensing is well understood. Moreover, astronomers can carry out lensing measurements on relatively nearby sources, which allows them to determine a value for the Hubble constant that does not strongly depend on such cosmological parameters as Ωm and ΩΛ.

Figure 3. The lensing cluster Abell 1689. Note the many arclike features tangentially aligned with the cluster center. They are strongly lensed background sources at different distances. The positions and shapes of the arcs can be used to determine the mass distribution of the cluster and potentially the scale factor of the universe.
(Image courtesy of NASA; N. Benitez, Johns Hopkins University; T. Broadhurst, Hebrew University of Jerusalem; H. Ford, JHU; M. Clampin, Space Telescope Science Institute; G. Hartig, STScl; G. Illingworth, University of California Observatories/Lick Observatory; the Advanced Camera for Surveys science team; and the European Space Agency.)
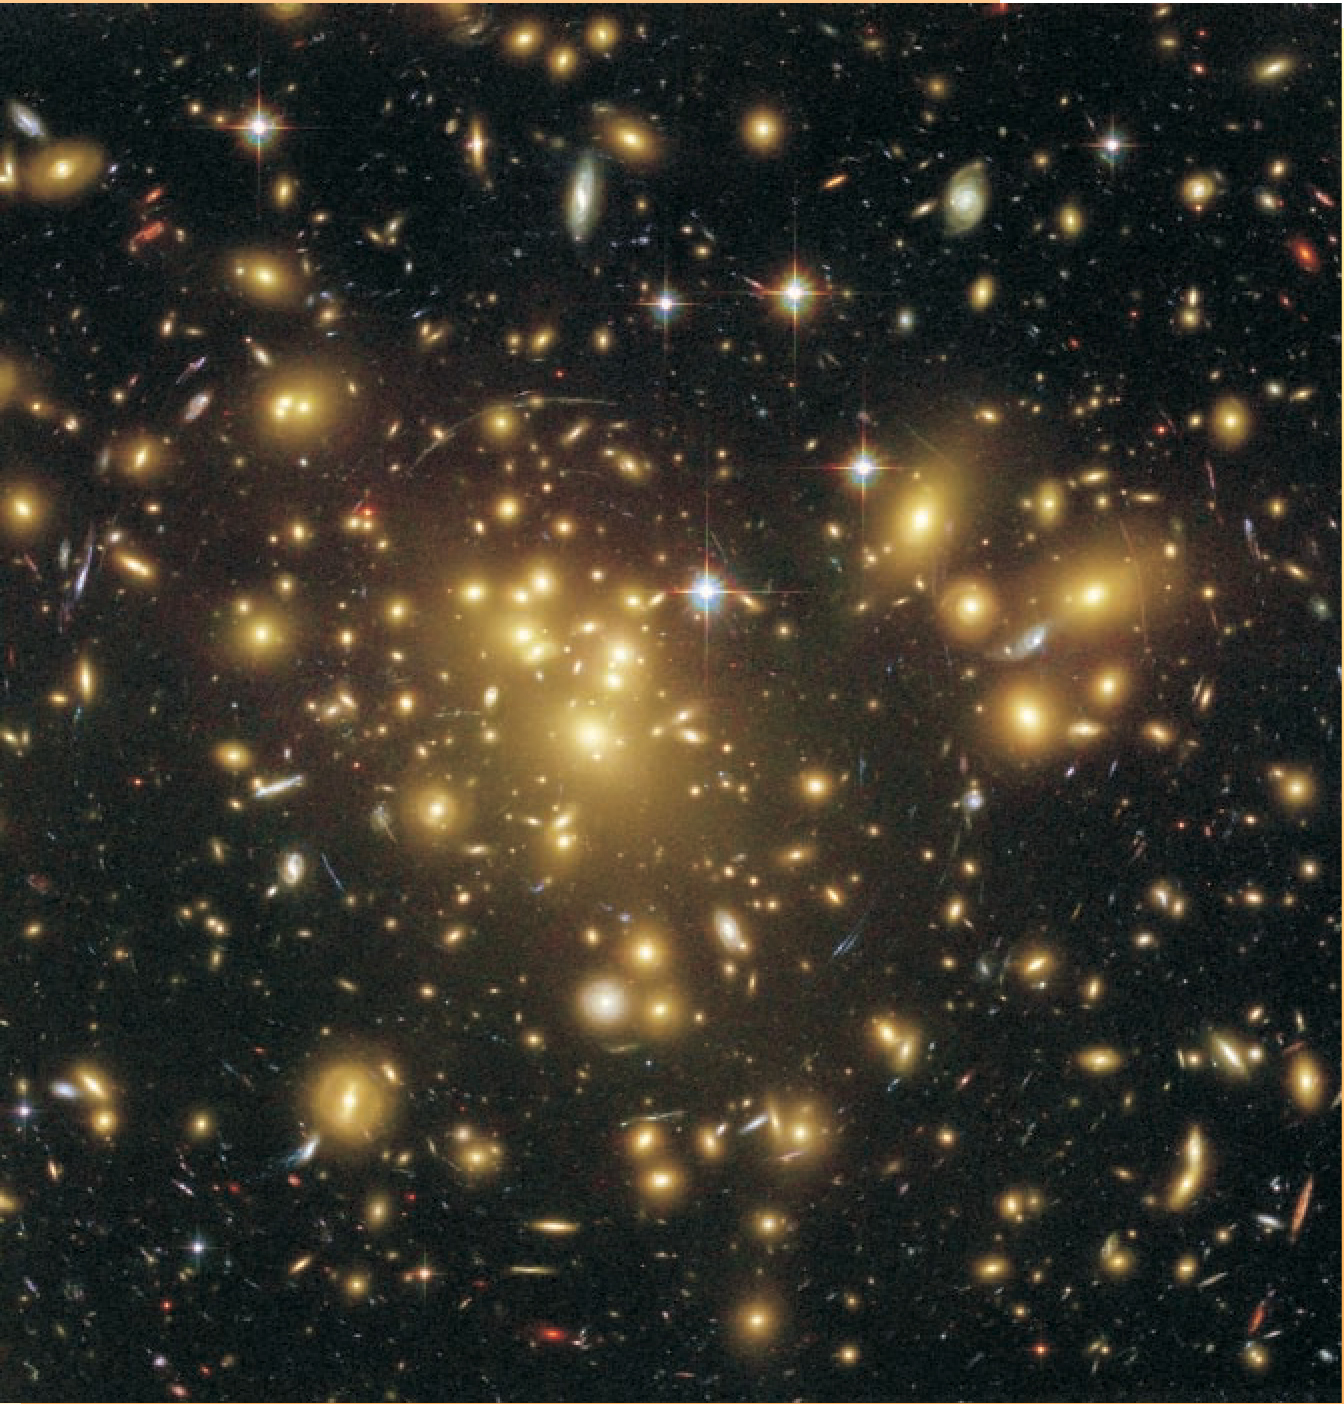

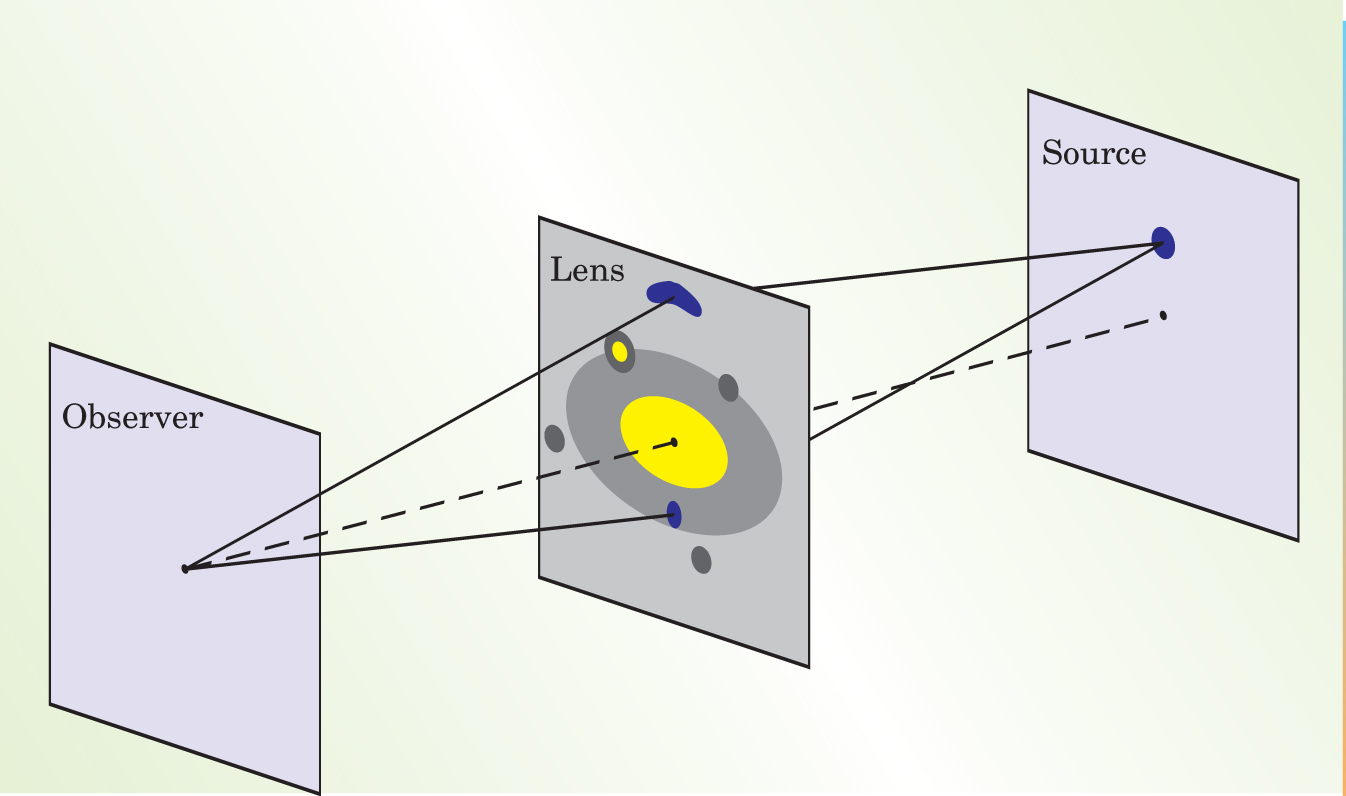
Figure 1. Strong gravitational lens geometry. Light emitted from a source travels along multiple geodesic paths—two in the case illustrated—to an observer who sees multiple distorted images of the source projected on the sky. The two paths have different lengths, and so a geometric time delay is introduced between the images. That the paths also sample different portions of the gravitational potential leads to an additional time delay, sometimes called a Shapiro delay. Astronomers measure the sum of the two time delays, which is inversely proportional to the Hubble constant. The lens illustrated here is a galaxy with stars (yellow) and a surrounding dark-matter (dark gray) halo. Also shown are several small dwarf satellites, with and without luminous matter, that can affect the lensed images.
A serious difficulty, however, attends the determination of the Hubble constant via lensing delays. In addition to the time delays, one must accurately know the mass distribution of the lens and small perturbations to the gravitational lens potential from other nearby galaxies—ultimately, the total gravitational field is what determines the lens geometry and the time delays from which H 0 is inferred. Observational efforts have often focused on measuring time delays and neglected mass distributions. Consequently, measurements of H 0 inferred from different lens systems have not always been consistent. At present, about a dozen lens systems have reasonably accurately measured time delays, and soon, many more will. Armed with good delay data, astronomers have shifted their attention to sophisticated modeling of the stellar and dark-matter mass distributions in lens galaxies to determine the gravitational potentials with greater accuracy.
Figure 2 shows a superb example of a strong lens system, CLASS B1608+656, observed by the Cosmic Lens All-Sky Survey. The system is particularly interesting because observers have measured all of the three time delays associated with the four lensed images; the delays range from 4 to 10 weeks. The two lens galaxies make B1608+656 a complex system, but by combining the time delays with optical images from the Hubble Space Telescope and velocity information from the Keck telescope on Hawaii’s Mauna Kea, one can construct an accurate mass model of the lens galaxies. Combining time-delay and mass information yields a determination for H 0 of 75 km/(s·Mpc) with an error of 10%.6 Even though that value is in agreement with that of the HST Key Project, 3 one should remain cautious, because it is based on a single lens system. Still, in the past several years, additional lens systems have been analyzed in detail, and the values of H 0 they give seem to be converging. That encourages us to believe it will soon be possible to improve the technique and enlarge the sample so that gravitational lensing can break the 10% precision barrier and provide the most accurate measurement of H 0.

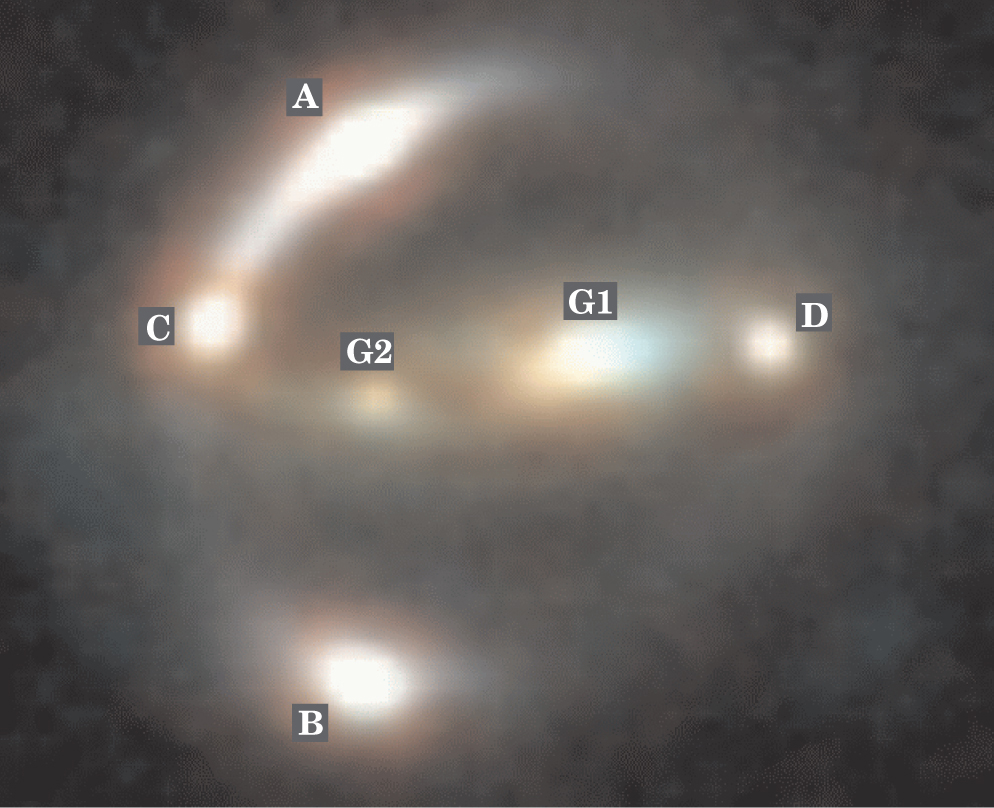
Figure 2. A true-color image of the lens system CLASS B1608+656, taken by the Hubble Space Telescope. The two foreground galaxies (G1 and G2) magnify and distort a single background source into four bright lensed objects (A-D).
Courtesy of Tommaso Treu, UCLA.)
Constraining cosmologies
The number of strong lenses one expects to see in a large lens survey can be predicted as a function of the geometry and kinematics of the universe, provided one has adequate knowledge of the redshift distribution of the lensed sources, the local density of the lens galaxies, and the mass-density profiles of the lenses. When one varies cosmological parameters, the volume between Earth and a distribution of distant sources changes. Consequently, so does the number of inferred intermediate lens galaxies. For example, increasing the dark energy increases the volume and thus the number of gravitational lenses one would expect to see in a survey. By comparing model predictions with results from lens surveys, astronomers can constrain cosmological parameters.
A different kind of technique, which is sensitive to the matter density of the universe, relies on weak gravitational lensing. That is, it relies on lensing not strong enough to form multiple images. The gravitational potential variations of weak lenses cause small distortions in the shapes of background sources. By measuring those distortions, one can determine the amplitude of density fluctuations. So-called tomographic surveys give three-dimensional information; otherwise, one determines 2D variations in which the radial coordinate is essentially integrated out. The current weak-lensing measurements are degenerate in that a measurement might be consistent with small fluctuations in a high-density universe or large fluctuations in a low-density universe. But microwave background observations uniquely determine the density fluctuations at early times: By combining microwave-background and weak-lensing observations, one can determine the mass-energy density of the universe.
Both strong and weak lensing give values of Ωm significantly less than 1. The largest strong lens survey—CLASS—gives Ωm ≈ 0.2–0.3 with an error of about 0.1, assuming a flat geometry. 7 The current weak-lensing determination gives an Ωm of about 0.3 with 10% error. 8 Those results are in good agreement with independent determinations from, for example, distant supernovae.
The nature and behavior of the mass fluctuations are also of interest in their own right. After all, structures such as clusters, galaxies, and stars originated from some sort of fluctuation, and those structures grow and evolve under the influence of their own gravity. Weak and strong gravitational lensing both provide valuable tools for measuring the mass distribution in the universe—from the largest scales to the smallest. 9 Because the deflection of light does not depend on the nature or dynamical state of the deflecting mass or energy, one can investigate the distribution of all mass including, particularly, the dark matter. Gravitational-lensing approaches are thus superior to galaxy-distribution studies that only trace luminous matter and hence need to be supplemented with an uncertain prescription, called bias, that allows one to relate light fluctuations to matter fluctuations. Bias, in other words, is a rule for determining where galaxies form in a sea of dark matter.
Large-scale structure
Cosmologists have a theory for describing the growth of density fluctuations from the time the microwave background was imprinted (t ≈ 400 000 years) to the present day (t ≈ 14 Gyr). It seems to give a consistent interpretation of observations, but it definitely needs to be tested. An excellent approach to testing the theory is to measure weak-lensing distortions of distant sources over a wide range of angular scales. That approach is most sensitive to the amplitude of density fluctuations of matter—luminous and dark—over the second half of the universe’s life.
If δρ/ρ is the density fluctuation in a single roughly spherical region subtending an angle θ, then the distortion induced in the image of an individual galaxy is roughly Ωmθδρ/ρ). Of order θ 1 independent spherical regions lie along the line of sight and their distorting contributions add stochastically. Thus, one can estimate the amplitude of the measured distortion—also called cosmic shear—to be about Ωmθ1/2(δρ/ρ). Over angular scales ranging from 0.5 to 10 arcminutes (corresponding to linear scales of some 0.5–10 megaparsecs), the cosmic shear typically ranges from a few parts per hundred down to a few parts per thousand. Cosmic shear was first detected in 2000 by five independent international groups. 10
To probe large-scale density fluctuations, astronomers observe circles on the sky subtending an angle θ, measure the shapes of a large number of galaxies within those circles, and compute the galaxies’ average distortions. If the sample contains N galaxies, then the statistical error scales as N −1/2. However, systematic effects associated with the atmosphere, telescope, and detector must also be considered. Typically one needs a sample of some 105 galaxies to measure cosmic shear with reasonable precision. Recent observations with a sample of more than a million galaxies have determined, for the density fluctuations as a function of angular scale, a slope that is in agreement with theory. 11
Cosmic-shear measurements, however, have only been done on areas that cover much less than 1% of the sky, and many results are preliminary. The coming years promise dramatic improvements in astronomers’ understanding of large-scale structure through wide-field surveys and tomographic weak-lensing studies that will yield detailed mass maps of the universe from its largest scales (tens of degrees) down to cluster scales.
Clusters and galaxies
Clusters of galaxies represent the largest and most recently collapsed structures in the universe. Thus, they are of particular importance in the study of how structure evolves from the linear (δρ/ρ ≪ 1) to nonlinear (δρ/ρ ≅ 1) scale. They can have masses of 1014 solar masses or greater, about 85% of which is dark matter. Combined with predictions from large numerical simulations, observations of clusters provide a benchmark test of cosmological models.
Weak-lensing measurements can help resolve cluster mass distributions out to radii r as large as 10 arcminutes. 10 At that radius, clusters start to merge with the surrounding large-scale cosmic environment. Weak-lensing studies are now being combined with x-ray observations, galaxy velocity measurements, and detections of the so-called Sunyaev-Zeldovich dips in the microwave background caused by the passage of photons through hot, ionized cluster gas. Armed with those data, astronomers can piece together maps of the galaxies, dark matter, and gas that compose clusters.
The inner regions ( r ≪ 100 kpc) of rich clusters exhibit strong gravitational lensing of background galaxies, most spectacularly in the form of multiple giant arcs as seen in figure 3. Measurements of such arcs can be combined with x-ray observations and stellar kinematic studies of the central galaxies to determine the central mass distribution. Simulations predict “cuspy,” anisotropic inner density profiles with – d(lnρ)/d(lnr) in the range of 1.0–1.5, but recent observations show a much shallower variation. If the observations withstand ongoing scrutiny, then they could be an indication that dark matter might be different from what is usually assumed. It might, for example, be lukewarm or self-interacting.
Galaxies are the dominant tracers of the distant universe. They, like clusters, are believed to undergo hierarchical merging as the universe ages. However, understanding how they form and evolve is even more model-dependent than is the case with large-scale structure and clusters: Gas dynamical, stellar, radiative, and nuclear processes can segregate gas, stars, and dark matter and can affect galaxy mass and energy content in a way that is hard to quantify. Gravitational-lens measurements are thus especially important because they can provide an accurate measurement of galaxy masses on radial scales from kiloparsecs to hundreds of kiloparsecs.
Gravitational lensing plays a dominant role in determining the mass and mass distribution of galaxies beyond the local universe—that is, at redshifts of about 0.1 or greater. 9 We know that the outer parts of galaxies—their halos—are dominated by dark matter, but we do not have a good understanding of the halos’ extent and shape. A particularly good way to explore halos on scales of tens to hundreds of kiloparsecs is to use galaxy-galaxy lensing. The technique involves statistically measuring the weak-lensing distortions around galaxies—background galaxies are preferentially elongated tangentially. Astronomers have used it to trace dark-matter halos out well beyond the light distribution and to show that the radial dependence of the density is consistent with numerical simulations. For typical bright galaxies, observers have measured the half-mass radius and demonstrated that dark matter is elongated in the same direction as the light distribution.
Strong lensing can determine how mass is distributed in the region within radii of about 10 kpc. Through detailed mass modeling combined with accurate photometry and spectroscopy, one can determine the distributions of stellar and dark matter within individual galaxies. The HST, in combination with radio telescopes, produces high-resolution images, and large ground-based optical telescopes supply stellar velocity distribution data. Recent results show that distant galaxies have so-called isothermal densities satisfying ρ ∝ r −2, but the exponent has a considerable scatter of about 15%. The results for distant galaxies are consistent with those obtained for local galaxies. 12
On smaller scales inside the dark-matter halos around galaxies, simulations with pure cold dark matter predict that roughly 10% of the dark-matter mass should be located in hundreds to thousands of small compact satellites. Remarkably, only a handful have been observed in the Milky Way. That may pose a severe problem for theories of cold dark matter.
Perhaps the satellites are indeed present but contain no luminous mass and so have thus far escaped detection. Such satellites would affect how individual lens galaxies produce multiple images. A lens galaxy with a sufficiently smooth mass distribution has a remarkable and perhaps telling property: If it produces two or three highly magnified merging images—such as images A and C in figure 2—then a specific combination of the image fluxes sums to zero. On the other hand, if the mass in the lens galaxy contains many dark-matter satellites, with their related small-scale gravitational-potential perturbations, the flux relation needn’t hold. For many lens systems with highly magnified images, the appropriately summed fluxes do not add to zero, 13 which has been interpreted as the first detection of these dark-matter satellites. 14
Still, the flux relations have been checked for only a small number of lens systems, so the exciting indications of dark-matter satellites should be regarded as preliminary. To confirm the existence of those satellites, observers will need to see their direct effects on the fluxes and shapes of multiply imaged sources. High-resolution (about 0.001 arcsecond) radio observations could reveal such effects, as could observations of lensed quasars in the mid-IR, for which propagation effects such as absorption and scattering, and also microlensing, are negligible.
Stars and planets
Relatively small masses can be detected using microlensing, the production of flux changes in compact background sources due to the passage of intervening compact lenses close to the line of sight. Microlensing forms multiple images and may be viewed as strong lensing on very small angular scales, typically micro- to milliarcseconds. Present-day telescopes cannot resolve the multiple images at such small scales; rather, they detect changes in the total brightness of the lensed source.
Both luminous stars and compact dark objects can serve as microlenses. The probability that a specified background source is lensed by the foreground stellar population of the Milky Way is tiny—something like 10−6—so observers must conduct large microlensing surveys. They look either near the center of the Milky Way or toward large nearby galaxies, where millions of stars have the potential to be lensed.
The most interesting results have come from the Massive Compact Halo Object and Expérience de Recherche d’Objets Sombres teams, which monitored stars in the Large Magellanic Cloud and attempted to find rapid magnification changes due to compact dark matter in our galactic halo. 15 The MACHO team claims that about 20% of the Milky Way halo consists of compact objects of some 0.5 solar mass. That mass content is greater than the total mass of the known stars. Self-lensing, in which both the source and lens are in the Magellanic Clouds, is likely to be the explanation of the MACHO results. The EROS team finds fewer microlensing events than the MACHO team and sets an upper limit of 25% for the compact dark matter content of the halo. In any event, it is now clear that only a small fraction of the Milky Way halo’s dark matter consists of massive compact objects and that dark matter must be sought in the particle physics domain.
Microlensing is also invaluable as a probe of black holes. One recognizes a potential “dark star” when a lens mass is measured to be more than about 3 solar masses, too heavy to be a neutron star or white dwarf. If the lens is close enough, one might be able to rule out a luminous star as an explanation, which would leave only a black hole as a viable candidate. The microlensing technique is pretty much the only tool astronomers have for measuring the density of single black holes in the Milky Way. It has already been used to find three reasonably convincing black hole candidates, one of which is shown in figure 4(a).

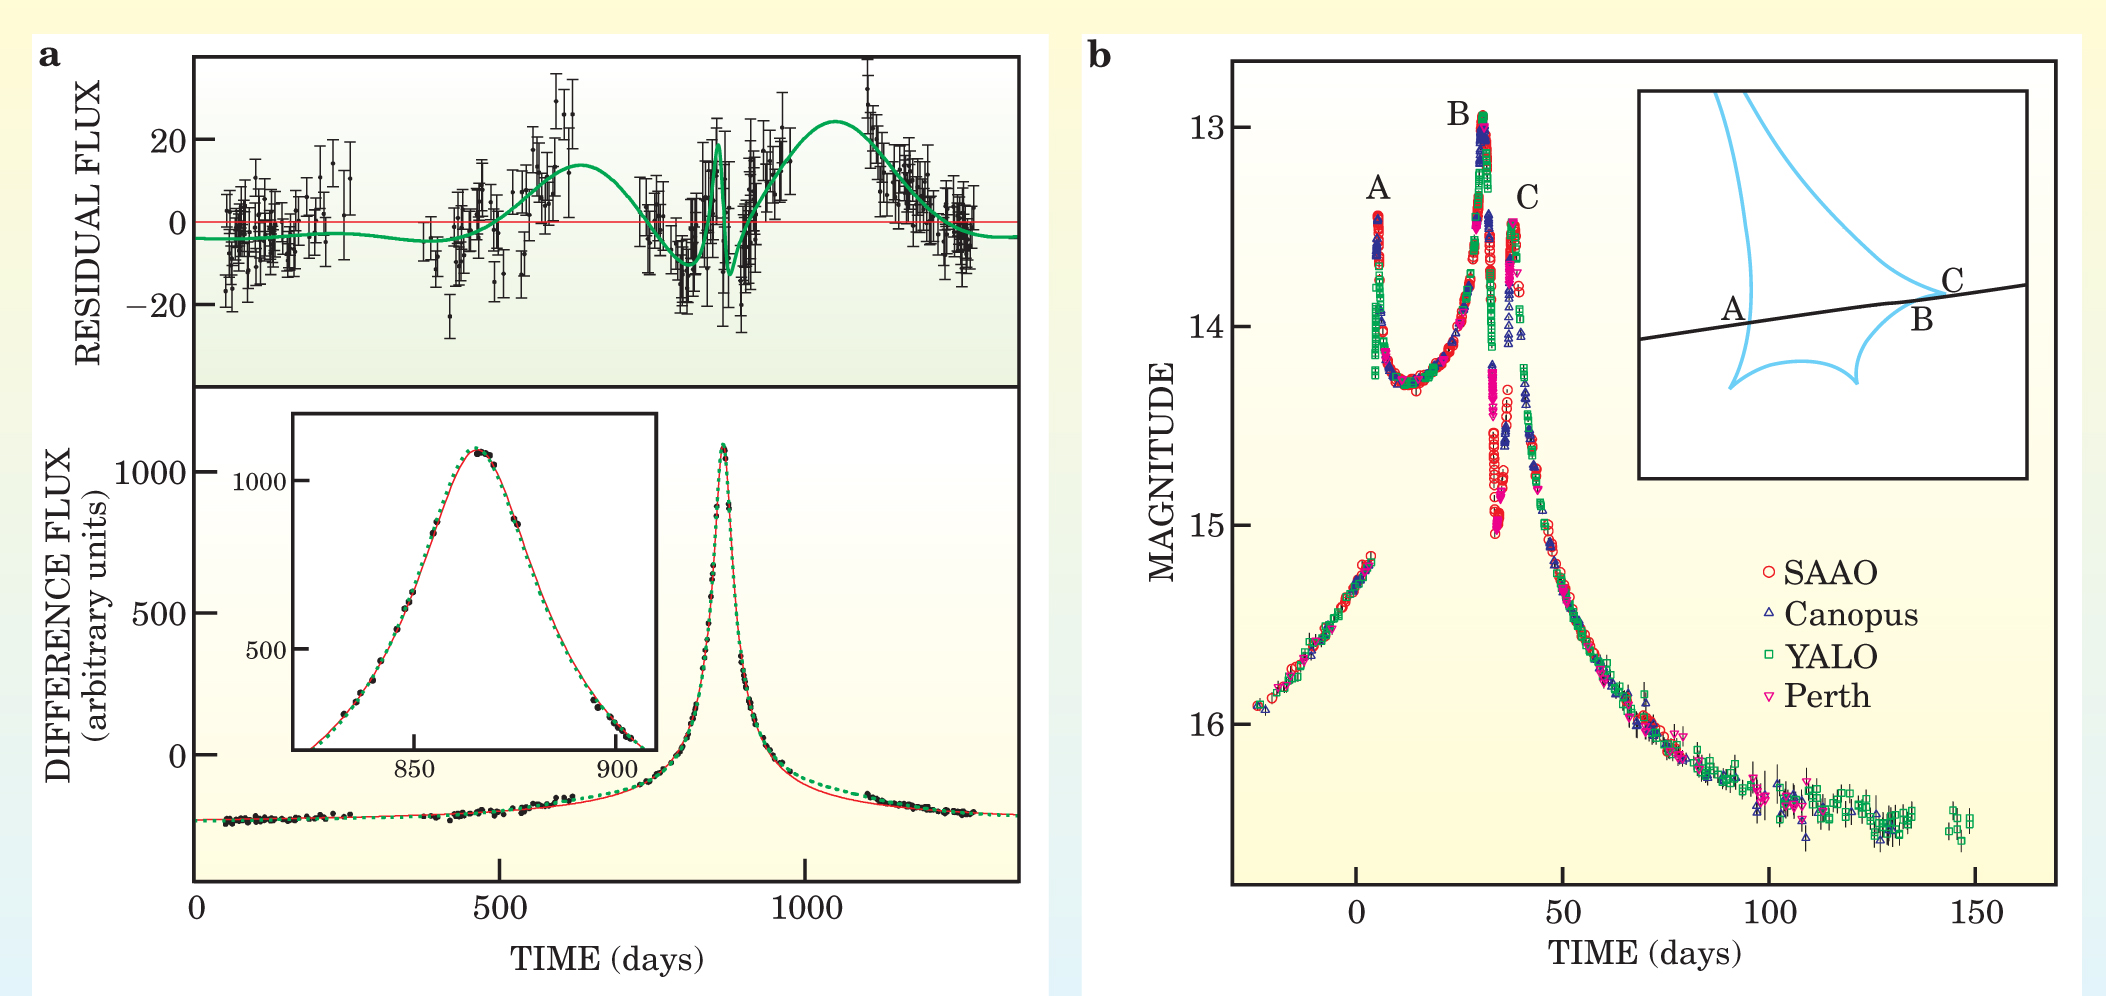
Figure 4. Microlensing. (a) An optical light curve shows how flux changes over the course of the microlensing event OGLE-1999-BUL-32; the inset shows the light curve close to the peak. The mass of the lensed object deduced from the light curve suggests that the object could be a black hole. Because of the geometry and long duration of the event, a light-curve model that takes Earth’s orbital motion into account (green) gives significantly different results from the “standard” model (red). (b) An optical light curve for the event EROS BLG-2000-5, obtained by the PLANET (Probing Lensing Anomalies Network) collaboration. Data are from the South African Astronomical Observatory (red); the Canopus Observatory in Tasmania, Australia (blue); the YALO consortium (green); and the Perth Observatory in Australia (magenta). The inset shows a microlens caustic (light blue) and the path of the lensed object across it. The points identified as A, B, and C show the position of the object corresponding to the three bumps in the light curve. Times on the horizontal axes are relative to arbitrary standards.
(Adapted from S. Mao et al., Mon. Not. R. Astron. Soc. 329, 349, 2002.)(Adapted from J. H. An et al., Astrophys. J. 572, 521, 2002.)
A binary lens yields a more complex flux distribution, such as the one illustrated in figure
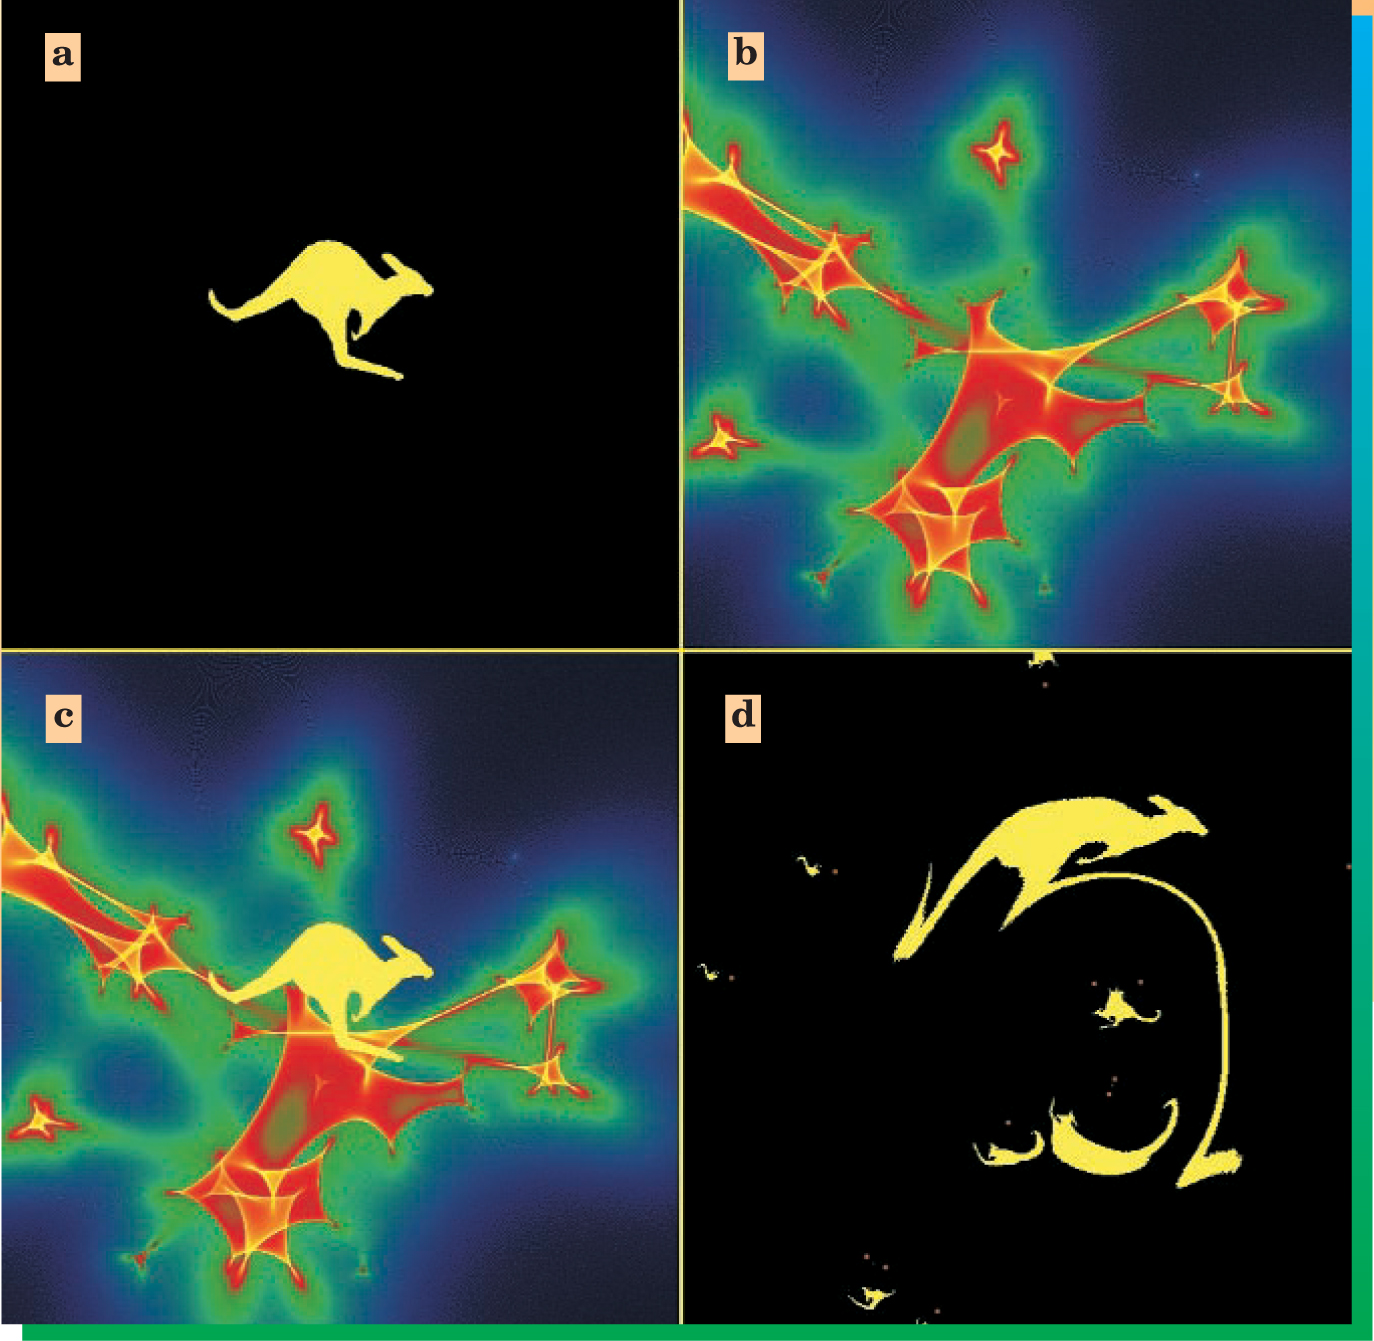
Microlensing is improbable in our galaxy, but stars in more distant strong-lensing galaxies can form caustic networks (see figure 5) that can magnify or demagnify compact sources on microarcsecond scales. 17 The accretion disks in lensed optical quasars or the shock fronts in lensed radio jets, for example, could be highly magnified; one could then probe their size and structure on extremely small angular scales. From microlensing studies, astronomers have learned that massive black holes contribute only a small percentage of the mass in distant galactic halos.

Figure 5. A microlensed kangaroo. In the simulation displayed here, a source (a) is lensed by a random distribution of compact objects, say stars. Those objects form a caustic network (b) of regions with very high magnification and distortion. Brighter areas indicate regions of greater magnification. The source and caustic network are superimposed in (c). Quadrant (d) illustrates the lensed image. The scale of a microlensed image is typically microarcseconds, so, as the lens moves in front of the source, observers would see only a change in brightness of the source with time.
Courtesy of Joachim Wambsganss, Potsdam University.)
Large and deep surveys
The rapid transformation of gravitational lensing from a scientific curiosity to a cosmological tool has been made possible by painstaking observations at mostly radio and optical wavelengths. However, much work remains to be done—observable stars and galaxies number over a hundred billion.
The next steps are already in progress. Large and deep surveys now being carried out with ground-based telescopes will observe more than 10 million galaxies and measure their weak-lensing distortions on an angular scale of about a degree. They should also discover many new cases of strong lensing and microlensing. Some of those surveys will be able to determine the distances of the galaxies using galactic photometric redshifts—essentially colors—and thus enable tomographic studies. The ongoing surveys will provide data on the evolution of mass fluctuations. The data can then be compared against simulations that make accurate predictions as a function of a given cosmological model.
The prospects for further advances undoubtedly center around major new telescopes that are being designed, in part, to carry out gravitational lensing studies. One of those is SNAP, the SuperNova Acceleration Probe. The space-based telescope will measure the size and shape of the universe by studying supernovas and mapping weak lensing. It may also be able to detect a new form of weak lensing. Most of the billion or so galaxies that SNAP will observe—the building blocks of the galaxies we see around us today—are too dim for their shapes to be measured. However, they are physically clustered, and as with brighter galaxies, the clustering will be sheared. If that shear is detectable, it will most likely tell astronomers the redshift distribution of those building blocks. In addition, SNAP should discover tens of thousands of galaxy-sized strong lenses and advance astronomers’ understanding of galaxy mass distributions.
The proposed Large Synoptic Survey Telescope and the smaller, less technically involved PanSTARRS (Panoramic Survey Telescope and Rapid Response System) search will take a complimentary approach. Those projects will survey about half of the sky from the ground, but atmospheric blurring will render their resolution inferior to that of space-based telescopes. They should generate a billion galaxy images and may be able to look at the largest scale mass structures in the local universe. Large numbers of clusters should be found through weak lensing, and the evolution of their density with cosmic time would provide an independent measurement of the dynamics of the universe.
Radio telescopes may well match the capability of their optical counterparts. Current telescopes are improving, and there are prospects for two larger radio telescopes: the Low-Frequency Array and the Square Kilometer Array.
Scientists have only partly been able to script the study of lensing; the history of the field is full of unanticipated phenomena. What better place to seek further serendipitous discoveries than in observational investigations of dark energy, dark matter, dark stars, and planets? It is in the unscripted discoveries, we predict, that gravitational lensing will continue to contribute most to the understanding of the universe.
References
1. D. Walsh, R. R. Carswell, R. R. Weymann, Nature 279, 381 (1979).https://doi.org/10.1038/279381a0
2. Further details can be found in any good cosmology textbook. See, for example, J. J. Peacock, Cosmological Physics, Cambridge U. Press, New York (1999).
3. W. W. Freedman, M. M. Turner, Rev. Mod. Phys. 75, 1433 (2003).https://doi.org/10.1103/RevModPhys.75.1433
4. See, for example, P. Schneider, J. Ehlers, E. E. Falco, Gravitational Lenses, Springer-Verlag, New York (1992).https://doi.org/10.1007/978-1-4612-2756-4
5. S. Refsdal, Mon. Not. R. Astron. Soc. 128, 307 (1964).
6. L. V. E. Koopmans, T. Treu, C. C. Fassnacht, R. R. Blandford, G. Surpi, Astrophys. J. 599, 70 (2003).https://doi.org/10.1086/379226
7. K.-H. Chae et al., Phys. Rev. Lett. 89, 151301 (2002).https://doi.org/10.1103/PhysRevLett.89.151301
8. C. C. Contaldi, H. Hoekstra, A. Lewis, Phys. Rev. Lett. 90, 221303 (2003).https://doi.org/10.1103/PhysRevLett.90.221303
9. See, for example, P. Schneider, http://arXiv.org/abs/astro-ph/0306465 .
10. See M. Bartelmann, P. Schneider, Phys. Rep. 340, 291 (2001).https://doi.org/10.1016/S0370-1573(00)00082-X
11. M. M. Brown et al., Mon. Not. R. Astron. Soc. 341, 100 (2003);https://doi.org/10.1046/j.1365-8711.2003.06237.x
U. Pen, L. Van Waerbeke, Y. Mellier, Astrophys. J. 567, 31 (2002).https://doi.org/10.1086/33857612. T. Treu, L. V. E. Koopmans, http://arXiv.org/abs/astro-ph/0401373 .
13. See, for example, S. Mao, P. Schneider, Mon. Not. R. Astron. Soc. 295, 587 (1998).https://doi.org/10.1046/j.1365-8711.1998.01319.x
14. N. Dalal, C. C. Kochanek, Astrophys. J. 572, 25 (2002).https://doi.org/10.1086/340303
15. See, for example, N. N. Evans, http://arXiv.org/abs/astro-ph/0304252 .
16. I. I. Bond et al., http://arXiv.org/abs/astro-ph/0404309 .
17. R. Kayser, S. Refsdal, R. Stabel, Astron. Astrophys. 166, 36 (1986).
More about the authors
Leon Koopmans is an assistant professor at the Kapteyn Astronomical Institute in Groningen, the Netherlands. Roger Blandford is director of the Kavli Institute for Particle Astrophysics and Cosmology at Stanford University in Menlo Park, California.
Leon V. E. Koopmans, 1 Kapteyn Astronomical Institute in Groningen, the Netherlands .
Roger D. Blandford, 2 Kavli Institute for Particle Astrophysics and Cosmology at Stanford University in Menlo Park, California, US .


