Echolocation in dolphins and bats
DOI: 10.1063/1.2784683
Research on animal sonar can be traced to the Italian scientist Lazzaro Spallanzani, who in 1773 observed that bats could fly freely in a dark room and that blind bats could fly and avoid obstacles as well as bats that could see. Five years later Swiss scientist Charles Jurine found that when the ears of bats were plugged with wax, the animals became helpless and collided with obstacles. That early work took place before the understanding of the principles of ultrasonics and the establishment of acoustics as a science. So Spallanzani and Jurine could not formulate an acoustic theory of biosonar. It was not until 1938 that Robert Galambos and Donald Griffin used an ultrasonic detector developed by William Pierce to show that bats echolocated by emitting ultrasound and receiving the echoes. By that time the principles of ultrasonics were understood, and they provided a theoretical framework for describing the acoustic process underlying echolocation. Thus began modern research into animal sonar as described in Griffin’s seminal book Listening in the Dark: The Acoustic Orientation of Bats and Men (Yale University Press), originally published in 1958.
The discovery of echolocation in bats paved the way for the discovery of echolocation in dolphins. As early as 1947, Arthur McBride observed attempts to capture dolphins at night in turbid waters. He noted that the animals could avoid fine mesh nets and, even at distances beyond visual range, could detect openings in the nets. However, it was not until 1960 that Kenneth Norris and his colleagues unequivocally demonstrated echolocation in dolphins by covering a dolphin’s eyes with rubber suction cups and observing that the animal could avoid obstacles in a maze—all the while emitting ultrasonic sounds. Those early beginnings of dolphin echolocation research are summarized in a book written by one of us (Au). 1
Today, acousticians understand that dolphins and bats possess a sophisticated biosonar system that allows them not only to detect, discriminate, and pursue prey, but also to track the trajectory of prey in order to solve the prey-intercept problem. And those feats are typically accomplished in noisy environments often cluttered with background targets. In addition to catching prey, dolphins and bats also use biosonar to navigate and to avoid obstacles.
Both animal taxa have experienced some similar survival pressures resulting in convergent evolution for biosonar capabilities. However, the physics associated with body size and locomotion, the acoustic properties of environment and prey, and ecological effects have all influenced the natural selection process. As a result, dolphin and bat biosonar systems have different characteristics. In this article we discuss some basic biosonar properties of both taxa and examine how physical constraints have influenced the development of their echolocation systems. More than 65 species of toothed whales (odontocetes) use sonar, as do more than 700 species of bats. 2,3 Most of our discussion will center on the Atlantic bottlenose dolphin (Tursiops truncatus) and the big brown bat (Eptesicus fuscus). Those species, the white rats of biosonar, have been the most experimentally studied.
The shape of sound
The dolphin produces sonar signals in its nasal system by forcing air through two pairs of lips. Commonly referred to as the dorsal bursae–monkey lips complex, or phonic lips, they are situated about 3 cm below the blowhole. Figure 1a shows a computer tomography (CT) scan of the midsagittal (symmetry) plane of the dolphin. The assumed position of the sound source is shown below the blowhole. Signals propagate through the melon, which consists of “acoustic fat,” a special lipid material found only in the melon and the lower jaw. Sound velocity measurements indicate a graded sound velocity profile with low velocity near the midline of the melon and increasing velocity outward toward the melon’s surface. CT scans have shown a low-density core that likely corresponds to the low-velocity pathway through the melon. 4 Echolocation signals are diffracted by the graded sound velocity profile toward the low-velocity core, which provides some focusing of the sonar beam—much as light is diffracted while propagating through a medium with a changing index of refraction.

Figure 1. Dolphin sounds. (a) This computer tomography scan of the plane along the midline of a bottlenose dolphin’s head shows the location of the sound source (click generator); the propagation path through the melon, a region consisting of a special lipid material; and the location from which sound emerges. The red areas are the bones of the jaw and skull; the orange areas around the core of the melon indicate the epidermal layer, the hypodermal layers, and a matrix of connective tissues and fat; and the yellow area is the lipid core of the melon. (b) The sound pressure waveform for a bottlenose dolphin’s echolocation click lasts for 40–70 μs. The frequency spectrum is shown in the lower panel.
(
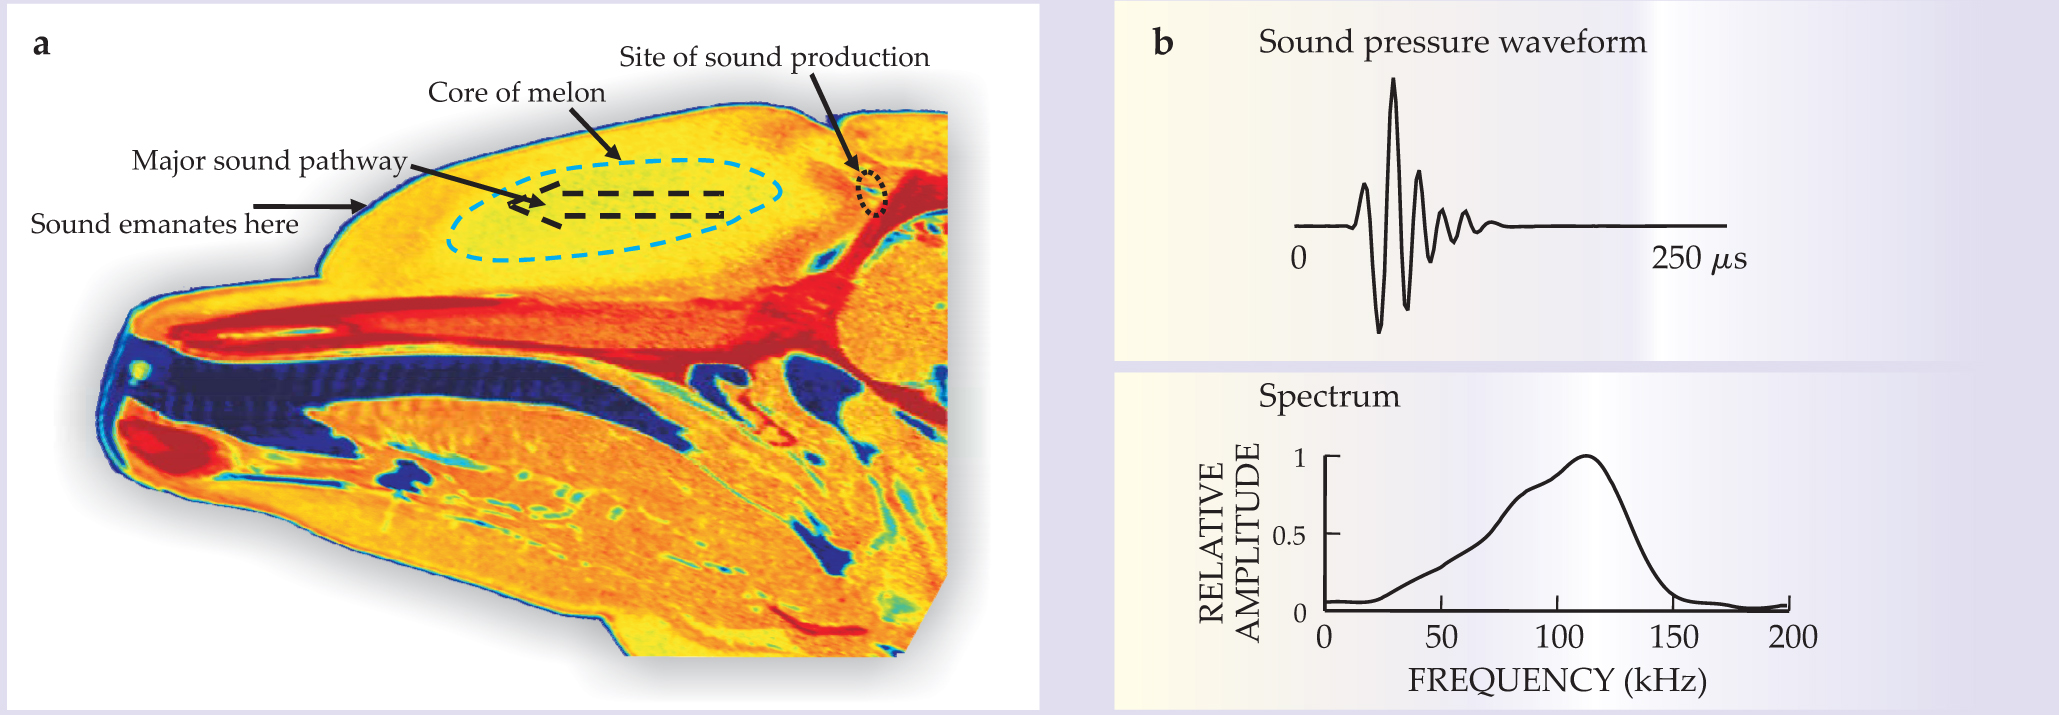
Most dolphins typically emit whistle signals and brief broadband echolocation clicks. Figure 1b illustrates such a click, which generally has between four and eight cycles and a duration of 40–70 μs. Peak-to-peak source levels can be very high, from 210 to 225 dB SPL. The sound pressure level, or SPL, decibel notation means that for the amplitude of the peak-to-peak pressure difference p, 20 log(p/p 0) is in the range of 210–225 for a reference pressure p 0 conventionally chosen to be 1 micropascal when considering dolphins and 20 μPa for bats. Inverting the base-10 logarithm gives a pressure of 3.2–18 × 104 Pa. When considering a ratio of pressure amplitudes, one uses the symbol dB without further adornment.
High-intensity signals often have center frequencies of 100 kHz or more, whereas very-low-intensity signals often have center frequencies of 30–60 kHz. Indeed, the center frequency varies almost linearly with the signal intensity measured in decibels.
Despite the sometimes high signal intensities, the energy flux density in a click will not be very great because of the click’s short duration. The energy flux density at 1 m is given in terms of the instantaneous time-dependent acoustic pressure p(t) by
where ρ is the density of the medium and c its speed of sound. The product ρ c is called the characteristic impedance; for seawater it’s 1.5 × 10⁶ Pa·s/m. The resulting flux density for echolocation clicks typically varies from 0.001 to 0.033 J/m2. The intensity of the beam falls to half its maximum value at an angular width of approximately 10° in both the horizontal and vertical planes, so that the cross-sectional area of the beam at 1 m is approximately 0.024 m2. The bottom line: The energy in an echolocation click is something like 0.2−8.0 × 10⁻⁴ J.
Like people and other land mammals, bats usually generate their biosonar sounds in the larynx and project them through the vocal tract and open mouth into the surroundings (see figure 2a). In big brown bats, the mechanism of vocalization is broadly similar to the production of vowels in humans. Wideband, harmonically structured signals excite a vocal tract that limits the upper emission frequency to about 100–110 kHz.

Figure 2. Bat sounds. (a) The big brown bat emits echolocation sounds from its mouth. (b) The top panel shows the sound pressure waveform for the bat’s biosonar sound. In the bottom panel is a spectrogram of the sound. Note the three harmonics and the wide bandwidth achieved with the downward sweeping frequency modulation.
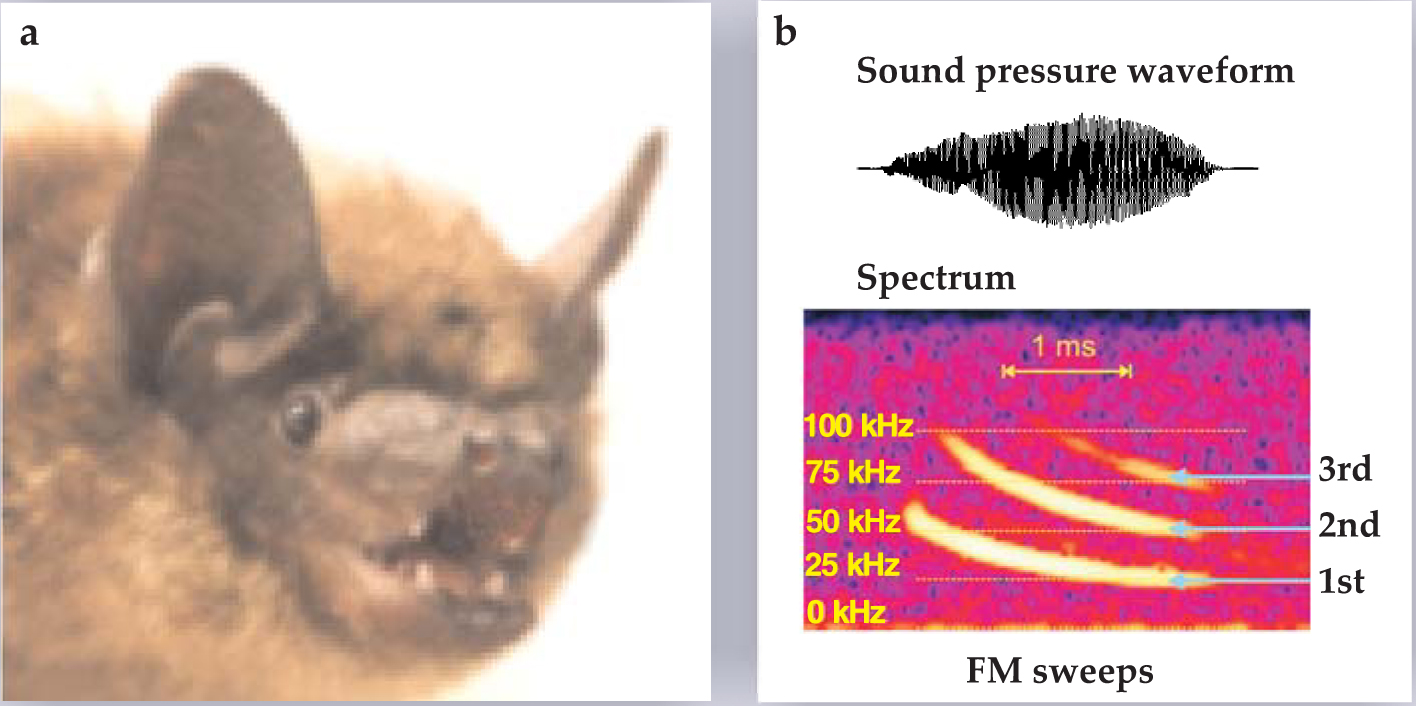
The range of biosonar sounds across the various species of bats covers frequencies from 10 kHz to about 150 kHz. Most bats broadcast wideband, frequency-modulated (FM) sounds arranged in one or more downward-sweeping harmonics. As illustrated in figure 2b, for example, big brown bats produce signals with three or more harmonics; the first of those sweeps from 55 kHz down to 22 kHz. In contrast to dolphin signals, the durations of bat FM sounds vary greatly depending on the species and the situation. During aerial interception of insects, open-space search signals of big brown bats persist for 20–25 ms, but the sounds’ durations shorten in proportion to distance until, during the terminal stage when the bat seizes the insect, they are only about 0.5 ms long.
Broadcast sound pressure is high in aerial-feeding bats, typically 100–120 dB SPL, but is lower in bats that fly and forage in vegetation. So-called whispering bats, for example, emit at about 65–70 dB SPL. The presence of harmonics clearly serves to broaden the bandwidth, which boosts the quality—that is, the information content—of images. Bats that routinely fly in dense clutter such as vegetation use sounds having many harmonics and shorter durations. 5
Novel reception systems
Bats that produce FM sounds employ sonar strategies similar to those of dolphins with their wideband clicks: As discussed later, they both perceive the distance to objects from the echo delay and the shape of objects from the interference spectrum generated when multiple reflections from different parts of objects overlap and interfere. 1,6
The open mouth of the bat, or the nose in nasal-emitting bats, serves as the broadcasting antenna to shape the transmitted beam, which is much broader than in dolphins. Big brown bats broadcast beams with widths of 30–40° at the highest frequencies, increasing to 120° at the lowest frequencies. A significant minority of bat species, including horseshoe bats and mustache bats, broadcast constant-frequency (CF) sounds generated by resonant laryngeal mechanisms. They listen in echoes for Doppler shifts that signify fluttering targets, and they have a neat trick to compensate for their own flight velocity relative to the target: They adjust the broadcast frequency of the CF signal so that echoes are maintained within the narrow frequency region well served in their ears by a section of the cochlea called the acoustic fovea. Those narrowband bats also emit an FM component that they use to determine the distance to objects, but it probably has too narrow a bandwidth to enable the bats to acquire detailed information about target shape.
A dolphin’s head is streamlined and smooth, lacking any protrusions, called pinnae, that could cause turbulence in the flow field and introduce flow noise in the vicinity of the bullae, or “ears.” The evolutionary process that led to an absence of any external pinnae in dolphins also resulted in a unique reception system. Bertel Møhl and colleagues embedded a small piezoelectric crystal in a suction cup that was positioned at different locations around a dolphin’s head. The group measured the animal’s auditory brain-stem response threshold to determine relative sensitivity to sounds. 7 Their results, shown in figure 3a, suggest that the dolphin could hear best when the suction-cup source was located in any of several areas of the lower jaw.

Figure 3. Dolphin hearing. (a) Piezoelectric crystals allow for measurements of hearing sensitivity as a function of location on the dolphin’s head. In this illustration, larger numbers indicate more sensitive hearing. The point of maximum sensitivity is indicated by the black-filled circle. The rectangular box corresponds to a piezoelectric clicker that was placed inside the dolphin’s mouth at the indicated location. (b) A numerical simulation maps the sound propagating into a dolphin’s lower jaw. Gray shaded areas indicate regions where the relative acoustic energy is high; darker gray means higher energy. Indicated in the simulation are the bullae or “ears” of the dolphin, and the panbone, a region in which the bone is much thinner than in the surrounding areas of the lower jaw.
(
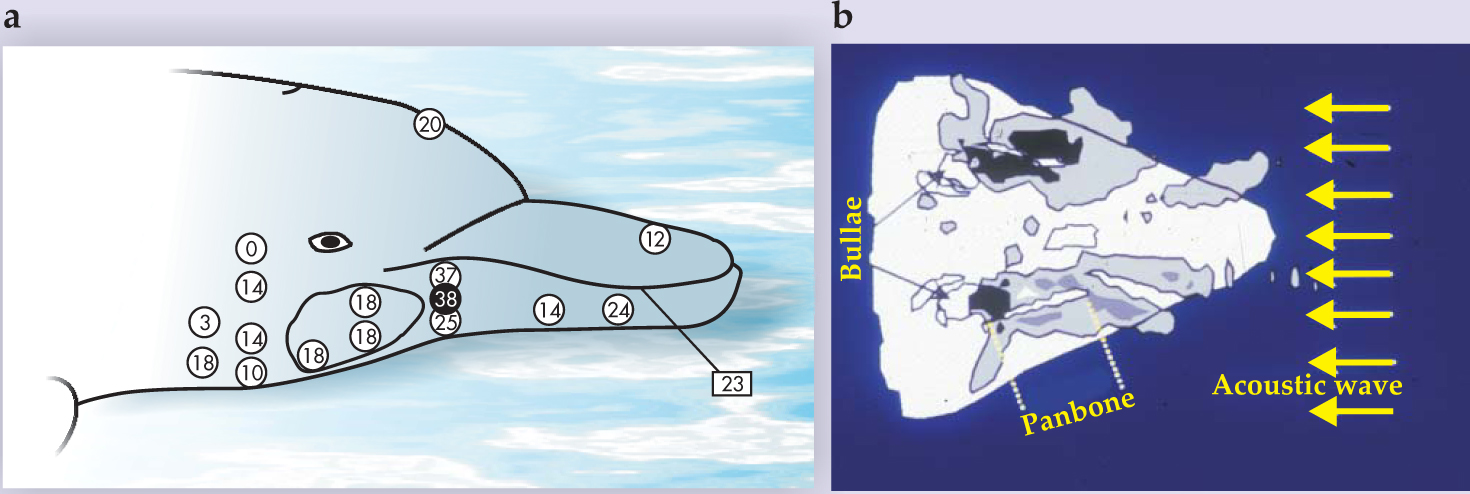
In 2001 James Aroyan used a finite-difference method to numerically solve the three-dimensional inhomogeneous wave equation and simulate a plane acoustic wave propagating into a dolphin’s head. 8 Figure 3b shows a horizontal slice of his 3D simulation. The necessary inputs of tissue density and sound speed as a function of position were approximated from CT scans similar to that shown in figure 1a.
Target detection
The effective range of the dolphin’s sonar system is much greater than that of the bat’s. One reason is that the energy in a dolphin’s echolocation signal is several orders of magnitude greater than that in a bat’s signal. Another reason has to do with the absorption loss properties of air and water. The sound pressure at a range r satisfies
where α(f) is the sound absorption coefficient, which depends on frequency f and medium. Given the frequencies at which bats and dolphins emit echolocation signals, the absorption coefficient is about two orders of magnitude higher for air-flying bats than for water-swimming dolphins.
Locomotion patterns also affect an animal’s ability to echolocate. Figure 4a shows the measured detection range for a bottlenose dolphin to detect a 7.62-cm water-filled sphere and a 2.54-cm solid sphere. The same figure shows the predicted detection ranges for a 30-cm-long cod presented at various aspects with respect to the sonar beam; the ranges vary from 109 m when the cod is broadside to the incident signal down to 70 m when the cod is swimming directly away. 9 The theoretical results assume a noisy body of water, with the noise being generated by snapping shrimp.

Figure 4. Target detection for bats and dolphins. (a) The plot shows the performance for a bottlenose dolphin detecting spheres (red lines) and the predicted ranges for its detecting an Atlantic cod (black lines). The 135° orientation is midway between broadside (90°) and tail (180°) aspects. (b) Two big brown bats (red and blue circles) were tested at detecting insect-sized spheres that were 4.8 mm and 19.1 mm in diameter. The rough doubling of detection distance with the fourfold increase in diameter is consistent with approximately the same echo-detection threshold. Both dolphin and bat experiments included trials with no target. The performance measure for the dolphins is the percentage of correct detections for the subset of trials in which the target is present. For the bat, the measure of correct performance includes all trials. The 50% threshold applied in the dolphin experiment is comparable to the 75% threshold applied for the bats.
(
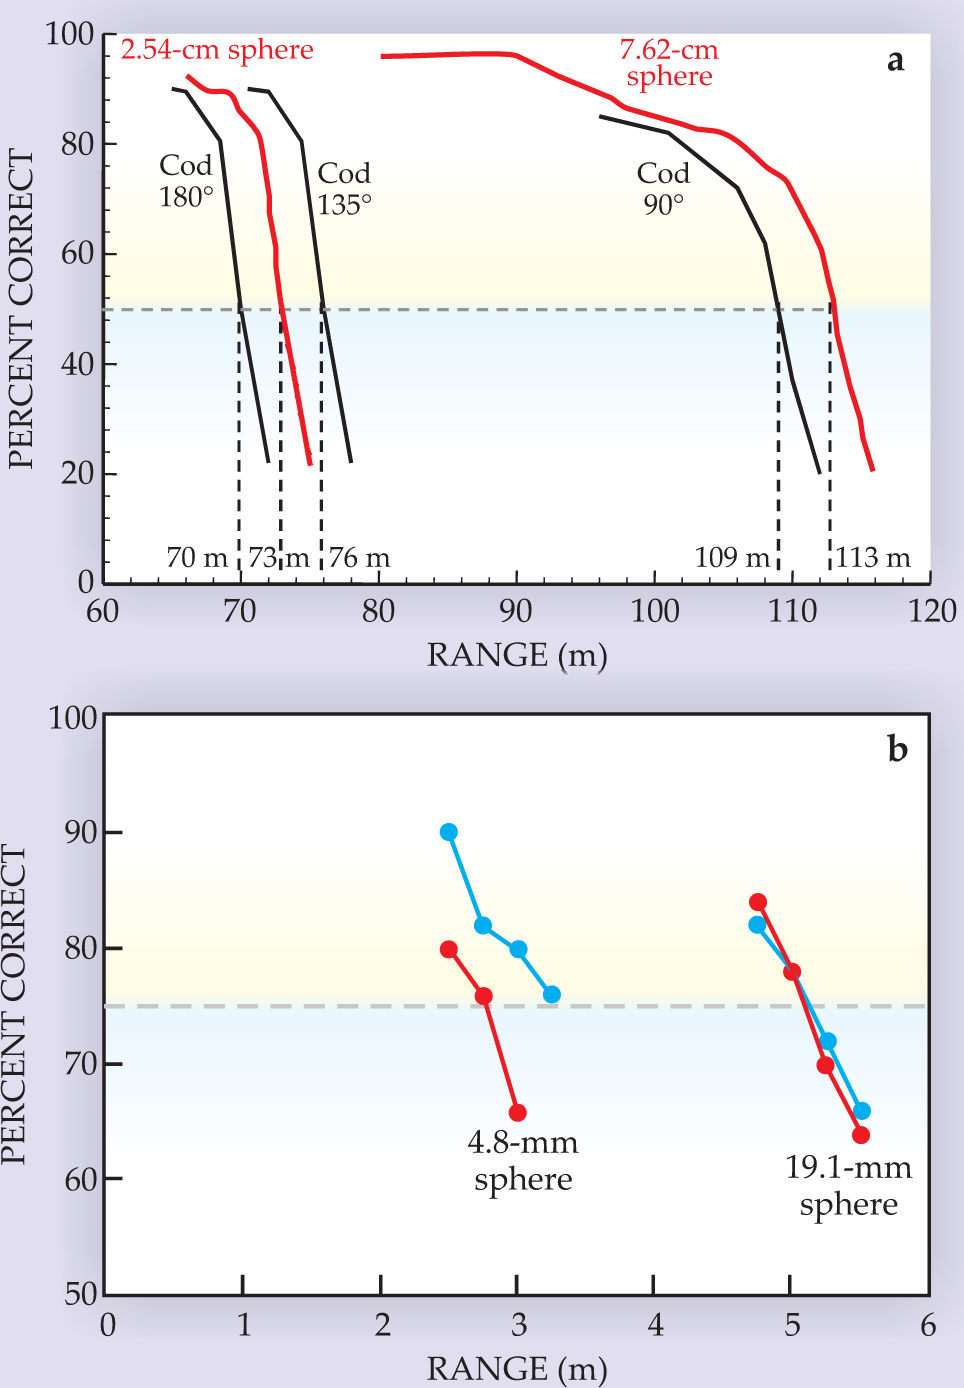
As displayed in figure 4b, big brown bats can detect insect-sized spheres at distances of a few meters. 10 In those experiments, the bat’s sounds have an amplitude of about 100 dB SPL at a distance of 10 cm in front of the open mouth. The combined effects of spreading losses out to the target and back are 12 dB per doubling of range for the 25-kHz frequencies that bats use for detection. Thus, a target range of 5 m amounts to losses of some 65 dB. Atmospheric absorption over the 10-m total path length is about 7 dB, and an additional 20 dB is lost (for the 19.1-mm sphere) because the target only reflects a portion of the signal. Combined losses for echoes from the 19.1-mm sphere thus bring the original transmission down to less than 10 dB SPL, which is about the bat’s threshold of hearing.
The restricted volume of active space for the bat’s sonar is offset by the bat’s relatively fast flight. Big brown bats move at roughly 5 m/s and thus can cover their own operating range in a second or two. When searching for insects in open space, they emit 5 to 10 sounds per second. In contrast, dolphins emit their sounds at widely different rates according to their momentary activity, and they can take minutes to swim over a distance of 100 m.
When bats encounter flying insects, they frequently take indirect flight paths that curve around the target. 11 Moreover, the insect itself is moving and turning. Consequently, in a short time the bat bathes the target with sound from different directions and receives echoes carrying information about the target at different aspect angles. From those echoes, the bat must reconstruct the target’s shape. In contrast, the dolphin’s high emission rate, combined with scanning movements of its head, gives it many closely graded views of an object.
Keen time resolution
The sound reception pathways of dolphins (figure 3) and bats (figure 5) are very different. That’s because bats have to overcome a huge uphill impedance mismatch when capturing energy in airborne sounds and transferring it to the fluid of the inner ear, whereas dolphins capture sound energy that is already waterborne. The characteristic acoustic impedance for air is approximately 416 Pa·s/m, a factor of 3600 smaller than the value for water.

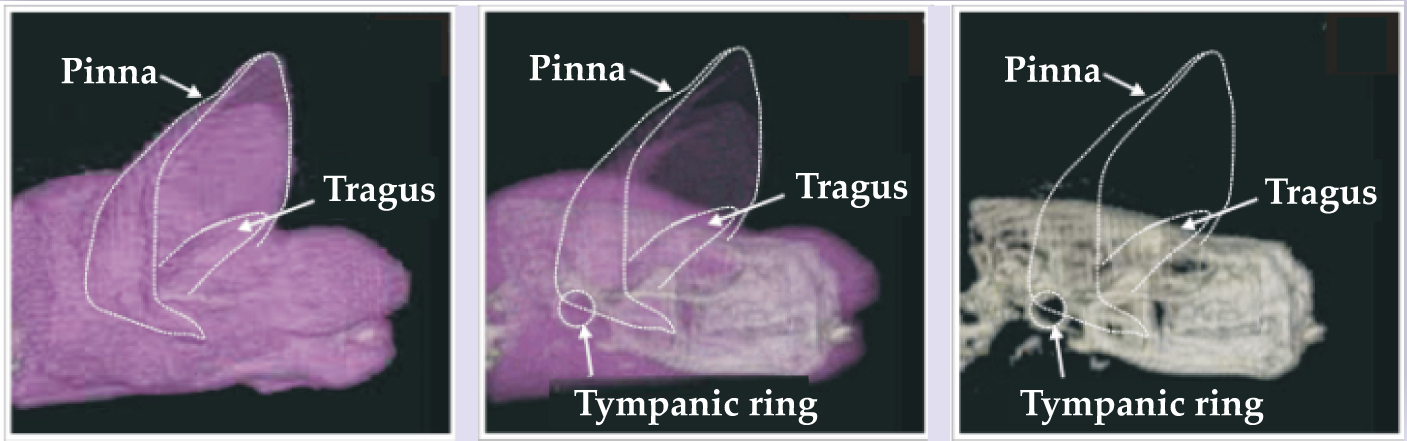
Figure 5. Bat hearing. These three computer tomography scans illustrate the big brown bat’s external ear, including the protective tragus, as a horn-line receiving antenna for funneling sound down to the tympanic ring, or eardrum.
(Courtesy of Darlene Ketten.)
In contrast, the auditory system that processes the captured sound is similar in both animal groups and not very different from our own. The inner ear’s organ of Corti contains a transmission line along which sound propagates to produce maximum mechanical activation at different locations according to frequency. For high frequencies, that location is at the input end—the basal turn of the cochlear spiral; for low frequencies, the terminal end—the apical turn. Transduction into nerve impulses is done by parallel frequency-tuned receptors arrayed along the organ of Corti. Their outputs make up a time history of the occurrence of different frequencies in sounds—a kind of spectrogram expressed in parallel neuronal channels.
The critical constraints on that time-frequency representation are the frequency-to-position map of the organ of Corti; the gain and sharpness of tuning for individual channels, which is adaptive; and the integration time associated with the processes that precede the generation of nerve impulses. Experiments reveal integration times to be roughly 200–250 μs in dolphins 1 and about 250–350 μs in bats. 6,12
Multiple echoes that arrive within the same integration-time window merge into a single sound having spectral features caused by mutual interference. Thus, if a dolphin or bat is to use arrival times to directly determine the time separation of echoes from multiple targets or from multiple scattering points on a single target of complex shape, then those arrival times must be separated by more than the integration time. Otherwise, the presence and separation of echoes must be determined from the shape of the interference spectrum.
It is the broadband nature of echolocation signals that allows dolphins and bats to finely discriminate the characteristics of targets. In 1953 Philip M. Woodward showed that for an ideal receiver the temporal resolution of a radar signal is directly related to the width of the frequency spectrum of the signal, and he gave a quantitative formula for calculating that resolution. 13 For signals such as those shown in figures 1b and 2b, the calculated Woodward time resolutions are about 14 μs for bottlenose dolphins and 21 μs for big brown bats. Those times provide a measure of how closely two target echoes can be separated in time and yet be discriminated as coming from two distinct locations and also indicate how accurately arrival time for an echo can be measured. Several experiments have demonstrated how the keen temporal resolution properties of broadband sonar signals can lead to fine discrimination of targets. We describe three of those, one with a dolphin and two with bats.
What do animals perceive?
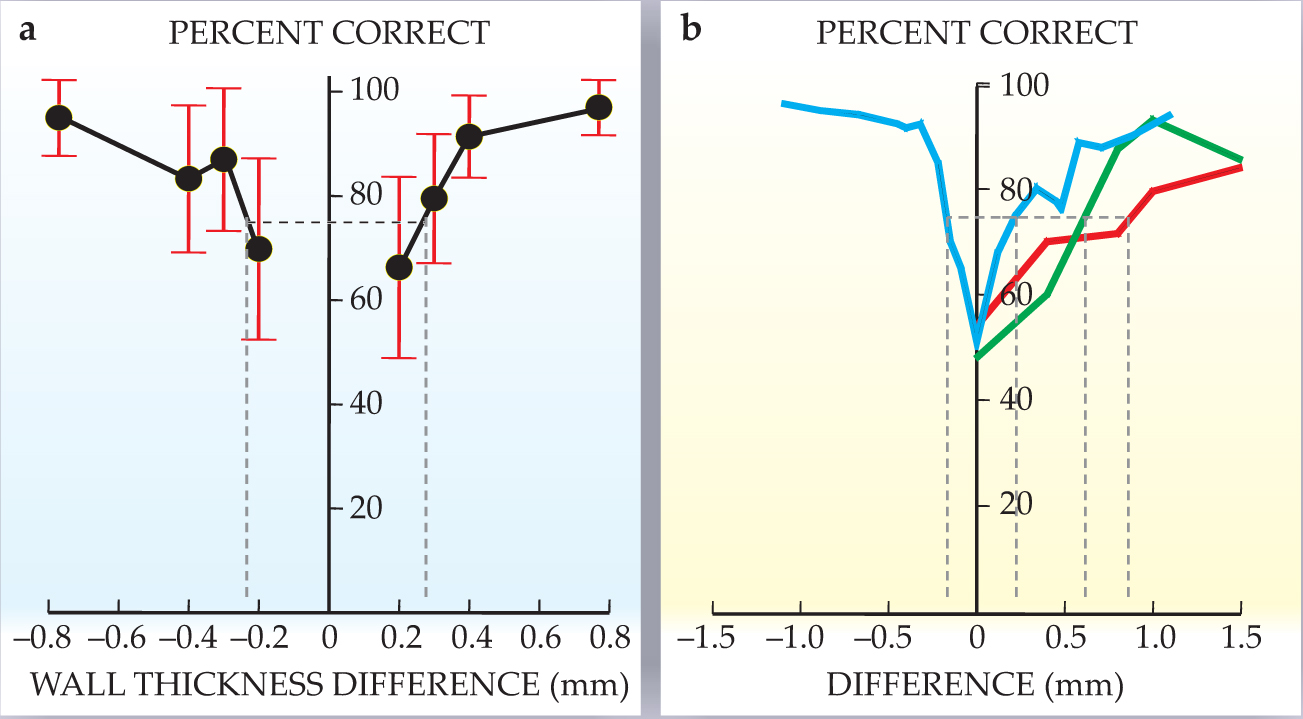
The experiment with the dolphin tested the discrimination of the thickness of a cylindrical wall. All cylinders in the experiment were made of aluminum and had a length of 12.7 cm and an outer diameter of 3.81 cm. A standard cylinder had a wall thickness of 6.35 mm. Comparison targets could have thinner or thicker walls whose absolute thickness differed from the standard’s by 0.2–0.8 mm. The dolphin had been trained to swim into a hoop station before echolocating; there it could move its head but was otherwise relatively stationary. In each trial, the dolphin indicated whether the standard or a comparison target was present; figure 6a shows how well it did as a function of wall-thickness difference between standard and comparison targets. The 75% correct-response threshold corresponds to a difference of 0.23 mm for the thinner targets and 0.27 mm for the thicker ones.

Figure 6. Fine discrimination. (a) A change of less than 0.3 mm in wall thickness allows a dolphin to choose between a standard and comparison aluminum cylinder. In the experiments summarized here, all cylinders had an outside diameter of 3.81 cm and the standard cylinder’s thickness was 6.35 mm. (b) The green and red curves show the ability of big brown bats to discriminate between two holes as a function of difference in hole depth. The blue curve shows the ability of the Indian false vampire bat to distinguish between slightly different highlight echo delays from electronically generated two-wavefront pulses.
(
With the help of a simulated dolphin sonar signal, researchers determined that the prominent components of an echo consisted of two “highlights”: one from the front surface of the cylinder and one from the inside back surface. Moreover, the time difference in the arrival of the two echo components can be determined by considering the two-way propagation of a signal through the front wall of the cylinder and through the water medium to the back wall. One finds that the time interval between the first and second highlight reflections is about 40 μs for all targets and that the time-interval difference between standard and comparison targets is about 0.5–0.6 μs at the threshold of a dolphin’s ability to discriminate between the two.
The shift in separation time also causes the spectrum of the echo from one target to be shifted in frequency with respect to another. 1 For example, the spectral shift between the standard target and a comparison target whose wall was 0.3 mm thinner was 3.2 kHz; for the target with walls 0.2 mm thinner, the shift was 2.2 kHz.
Experiments with bats can take advantage of both the relative simplicity of echo generation in air and targets into which sound energy does not penetrate. Several such experiments have explored the ability of bats to perceive changes in the time separation of highlights generated by reflecting surfaces located at slightly different distances. For example, bats have been trained to discriminate differences in the depths of holes drilled partway through plastic planar surfaces. Big brown bats, 14 as shown in figure 6b, and the European mouse-eared bat can distinguish differences as small as 0.6 mm.
Big brown bats and Indian false vampire bats 15 have been tested on their ability to perceive small changes in the delay separation of highlights from electronically generated “two-wavefront” pulses; the lab-generated signal gives the experimenter greater control over the acoustic stimulus. For both species, effects of overlap and interference on the spectrum of the combined reflections allowed bats to perceive differences of only 1–2 μs.
One critical question that remains is, What do the animals actually perceive for complex targets? The answer will depend on experiments that go beyond studying reception of sound and auditory sensitivity to consider possible dimensions of sonic images—in particular, what is meant by “shape” in sonar. Do dolphins and bats perceive targets as having not only a particular range deduced from overall echo delays but also a separate perceptual quality akin to pitch or timbre? If so, they are combining spatial (range) and auditory (coloration) dimensions. Or do they perceive targets as objects that have particular ranges along with particular range separations of their component parts? In that case they are combining two spatial dimensions.
The question comes down to this: How far does echolocation go toward spatialization of the images perceived by the animals? If biosonar processing stops at displaying target range, and thus leaves shape as an auditory dimension analogous to pitch or timbre, then target discrimination likely will prove to be somewhat aspect-dependent. However, if biosonar processing leads to determination of target range and range separation as spatial dimensions, then some kind of synthetic aperture mechanism might generate aspect-independent images of objects. Such a mechanism seems necessary to account for the ability of bats to distinguish between airborne mealworms and airborne disks of comparable target strength.
We have merely scratched the surface in our discussion of the properties and capabilities of echolocation in dolphins and bats. Natural selection and the physics of sound have enabled the two animals to evolve echolocation processes that are extremely well adapted to two very different environments. The animals are able to survive and thrive except in situations where humans encroach on their environment.
References
1. W. W. L. Au, The Sonar of Dolphins, Springer, New York (1993). https://doi.org/10.1007/978-1-4612-4356-4
2. A. D. Grinnell, in Hearing of Bats, A. N. Popper, R. R. Fay, eds., Springer, New York (1995), p. 1. https://doi.org/10.1007/978-1-4612-2556-0_1
3. G. Neuweiler, The Biology of Bats, E. Covey, trans., Oxford U. Press, New York (2000).
4. T. Cranford, in Animal Sonar: Processes and Performance, P. E. Nachtigall, P. W. B. Moore, eds., Plenum Press, New York (1988), p. 67.
5. H. -U. Schnitzler, C. F. Moss, A. Denzinger, Trends Ecol. Evol. 18, 386 (2003). https://doi.org/10.1016/S0169-5347(03)00185-X
6. J. A. Simmons et al., in ref. 2, p. 146.
7. B. Møhl et al., J. Acoust. Soc. Am. 105, 3421 (1999).
8. J. Aroyan, J. Acoust. Soc. Am. 110, 3305 (2001). https://doi.org/10.1121/1.1401757
9. W. W. L. Au, K. J. Benoit-Bird, R. A. Kastelein, J. Acoust. Soc. Am. 121, 3954 (2007). https://doi.org/10.1121/1.2734487
10. S. A. Kick, J. Comp. Physiol. A 145, 431 (1982). https://doi.org/10.1007/BF00612808
11. K. Ghose et al., PLoS Biol. 4(5), e108 (2006). https://doi.org/10.1371/journal.pbio.0040108
12. C. F. Moss, H.-U. Schnitzler, in ref. 2, p. 87.
13. P. M. Woodward, Probability and Information Theory, with Applications to Radar, Pergamon Press, New York (1953).
14. J. A. Simmons et al., Science 186, 1130 (1974). https://doi.org/10.1126/science.186.4169.1130
15. S. Schmidt, J. Acoust. Soc. Am. 91, 2203 (1992). https://doi.org/10.1121/1.403654
More about the authors
Whit Au is the chief scientist at the University of Hawaii’s Marine Mammal Research Program in Kaneohe. Jim Simmons is a professor of neuroscience at Brown University in Providence, Rhode Island.
Whitlow W. L. Au, Marine Mammal Research Program, University of Hawaii, Kaneohe, US .
James A. Simmons, Brown University, Providence, Rhode Island, US .


