Earth’s magnetic dipole collapses, and life explodes
DOI: 10.1063/pt.bide.yfhb


(Image from NASA’s Johnson Space Center.)

Is Earth’s magnetic field crucial to the planet’s habitability? Did it enable the evolution of life? Scientists have pondered those questions for at least 60 years.
1
The geomagnetic field shields our planet from solar and cosmic radiation that are harmful to life. The magnetosphere, illustrated in figure
The magnetic field is generated by convection in Earth’s liquid-iron outer core, as illustrated in figure
Until recently, no one had reason to suspect that the magnetic field in the past had nearly ceased for tens of millions of years. But with new data, paleomagnetists have found a prolonged near collapse of Earth’s magnetic field, some 575–565 million years ago during what’s known as the Avalon explosion, the dawn of macroscopic complex animal life. We now face the possibility of a new, unexpected twist in how life might relate to the magnetic field, a twist that could reach deep into Earth’s inner core.
A field adrift
When, in the 1950s, Ted Irving and his contemporaries first used paleomagnetic data to quantify continental drift—the harbinger of plate tectonics—they assumed that Earth’s magnetic field could be approximated as a dipole centered on the planet’s axis of rotation. 3 Ever since, geologists and geophysicists have used paleomagnetic directions recorded in rocks to reconstruct the past positions of continents because those data tended to conform to the expected field morphology. 4 They met a profound obstacle, however, when studying the Ediacaran Period, between 635 and 541 million years ago, because rocks formed at that time recorded a myriad of peculiar magnetic directions.
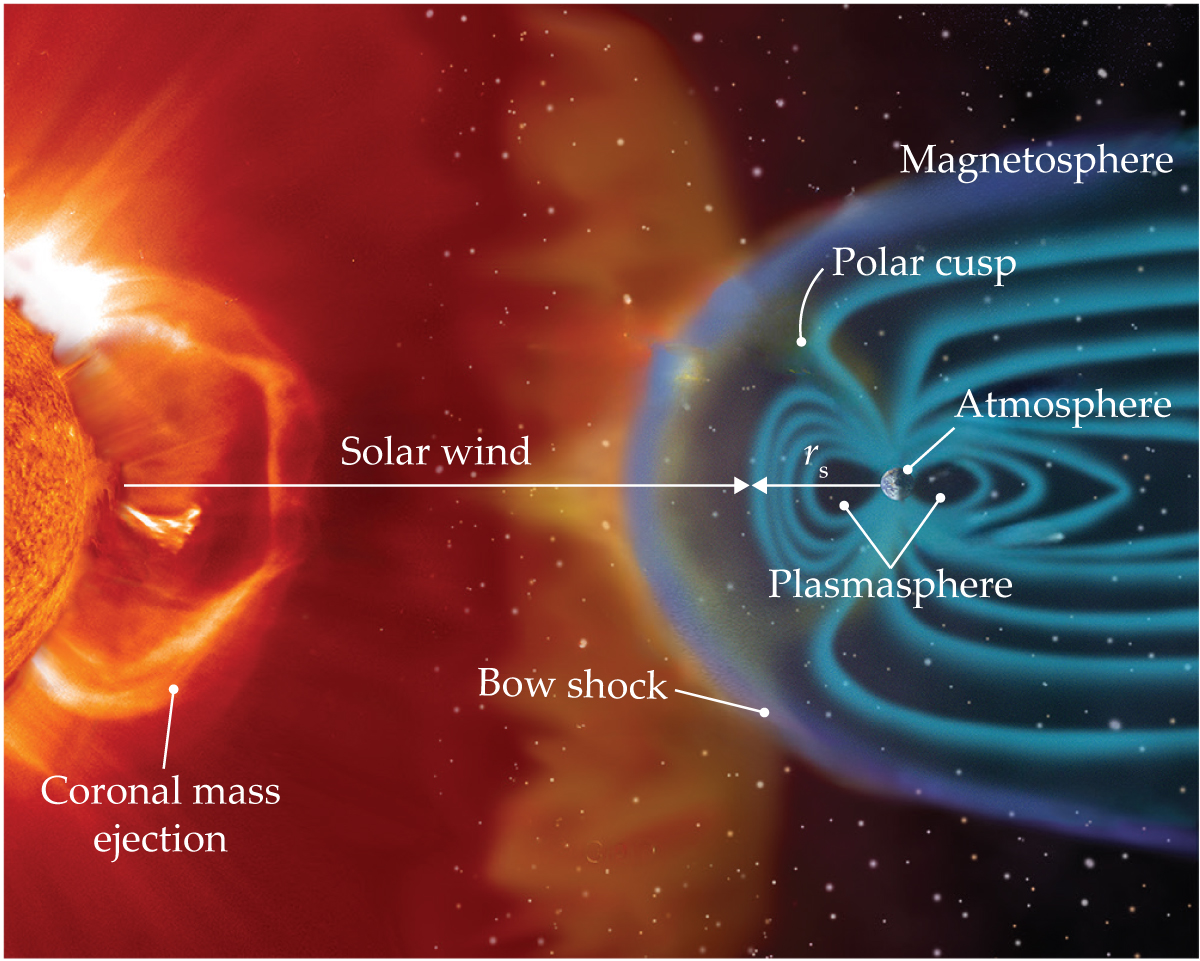
Figure 1.

The size and shape of the magnetosphere are controlled by interactions between the solar wind and Earth’s magnetic field. A big-picture view of changes in magnetosphere size with time can be obtained by tracking the magnetopause standoff distance rs, the point toward the Sun where the wind pressure is balanced by the magnetic field pressure. A typical standoff distance today is between 10 and 11 Earth radii. During solar storms—for example, the coronal mass ejection events and solar flares of May 2024 that produced auroras visible at low latitudes—the standoff can be compressed to half that distance, but only on hour time scales. The pressure balance between the solar wind and Earth’s magnetic field can be calculated back in time to understand the ancient paleomagnetosphere.
Some suggested that the odd directions recorded true polar wander, a reorientation of the solid Earth relative to its spin axis, at rates so high—up to tens of degrees per million years—that the explanation violated limits imposed by the viscosity of the mantle. Others proposed that the odd directions recorded alternations between a geocentric axial north–south dipole and a geocentric axial equatorial dipole, but they offered no reason for those changes. Subsequent studies revealed more complex directions that were incongruent with an interchange of dipole axes.
As even more data were collected, several groups concluded that the Ediacaran magnetic field was reversing polarity at a hyperfrequent rate, greater than 10 reversals per million years. From investigations of the most recent reversal, which occurred about 800 000 years ago, paleomagnetists knew that the field could take on an unusual morphology during a polarity change. A few researchers recognized that frequent reversals pointed to nondipolar fields that could account for some of the seemingly erratic Ediacaran magnetizations. Other groups, however, stood by the idea of true polar wander and assimilated data into ever-changing models that raised the question, What was the principal physical process responsible for the strange magnetic directions?
Paleomagnetists had based their interpretations of the Ediacaran geomagnetic field on only magnetic directions because reliable data on the past strength of the field—paleointensity—had not yet been collected. The measurement of paleointensity is especially challenging because data are easily corrupted by alteration induced in the laboratory. The highest fidelity recording of paleointensity requires tiny magnetic grains, 50 to a few hundreds of nanometers in size. Those minute crystal grains hold a single domain, a region where the magnetization is in a uniform direction. The magnetization of an ensemble of single-domain grains provides a measure of the magnetic field strength at the time the grains cooled. But rocks with a dominance of such grains are rare in nature. (See the
Measuring the intensity of the ancient magnetosphere
The magnetization, or remanence, of magnetic minerals in cooling igneous rocks can record the strength and direction of Earth’s magnetic field at the time the rock formed. Grains with a single magnetic domain are key to the collection of robust measurements of the past strength, or paleointensity, of Earth’s field. The magnetic grain sizes in most rocks are large enough that individual crystal grains contain many domains. The propensity of domain walls in multidomain grains to move, especially during geologic reheating events that even the best-preserved ancient rocks have experienced, can call into question whether magnetization has been accurately retained.
The single-crystal paleointensity method was developed to overcome that field-recording challenge. Many rock-forming silicate minerals (such as feldspars, pyroxenes, and quartz) or accessory minerals (such as zircons) can contain minute magnetic single-domain inclusions, without the multidomain grains common in bulk rocks. Some slightly larger magnetic inclusions, including small grains with more complex structures that act like single domains (for example, pseudosingle domains and single-vortex states), can also preserve ancient magnetizations.
Magnetic grains with a single magnetic domain can retain their magnetic fields for billions of years.
18
Laboratory heating experiments can be used to recover the paleofield strength
In 2015, using the single-crystal paleointensity method, Richard Bono was the first to collect robust paleointensity data from the Ediacaran Period. His results—a geomagnetic field with a strength just one-tenth of the present-day field’s—were startling. 5 Importantly, Bono and colleagues studied rocks that had cooled over at least many tens of thousands of years, so the readings were not just recording a geomagnetic reversal. Instead, they had measured the mean state of the past geodynamo. Bono and colleagues’ study sites were in northern Quebec, on the ancient continent of Laurentia. Their results were soon reproduced by Valentina Shcherbakova and colleagues, who reported ultralow field values from rocks in Ukraine, part of the ancient continent of Baltica.
Figure 2.

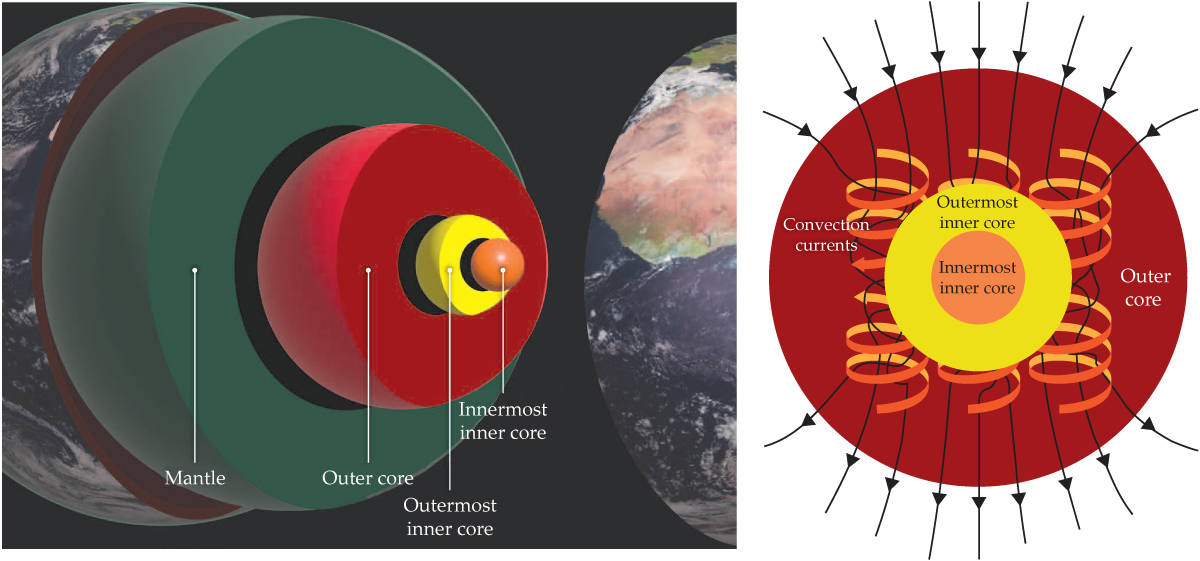
Changes deep inside Earth have affected the behavior of the geodynamo over time. In the fluid outer core, shown at right, convection currents (orange and yellow arrows and ribbons) form into rolls because of the Coriolis effect from the planet’s rotation and generate Earth’s magnetic field (black arrows). Structures in the mantle—for example, slabs of subducted oceanic crust, mantle plumes, and regions that are anomalously hot or dense—can affect the heat flow at the core–mantle boundary and, in turn, influence the efficiency of the geodynamo. As iron freezes onto the growing solid inner core, both latent heat of crystallization and composition buoyancy from release of light elements provide power to the geodynamo. (Left: Earth layers image adapted from Rory Cottrell, Earth surface image adapted from EUMETSAT/ESA; right: image adapted from Andrew Z. Colvin/CC BY-SA 4.0 .)
Shcherbakova and colleagues’ results came from quickly cooled ancient lava flows, but their samples spanned a substantial time period, up to 20 million years long. Daniele Thallner, working with Shcherbakova, bolstered the results from Baltica and found tentative evidence for ultralow fields from dikes, quickly cooled igneous intrusions that formed in existing rocks, in Laurentia.
6
More recently, Wentao Huang used the single-crystal method to document ultralow field values from slowly cooled Ediacaran rocks from Brazil, part of the ancient continent Gondwana. Huang’s data record the lowest time-averaged field found to date, one-thirtieth the strength of the present-day field. Together with the previous data, those results define an extraordinary ultralow time-averaged field interval, spanning at least 26 million years of the Ediacaran Period,
7
as shown in figure
A new view of the inner core
Independent of the flurry of new paleointensity data, researchers, including theorists, mineral physicists, and geophysicists, had been reconsidering the evolution of Earth’s thermal history and core evolution. In probing the details of the thermal history, those scientists raised the possibility that the thermal conductivity of Earth’s core had been previously underestimated by as much as a factor of three. Stéphane Labrosse and Francis Nimmo both showed that if the core’s conductivity was higher, the early core was also hotter. That suggested that Earth’s solid inner core, illustrated in figure
Mineral physicists have used high-pressure, high-temperature diamond anvil experiments to estimate conductivity values at core conditions, but those measurements are extraordinarily difficult. Recent experiments and analyses by several groups brought the initial high-conductivity estimates down, but the values are still higher than those based on classic assumptions. Measurements and debate are ongoing. Importantly, Peter Driscoll used a numerical model to predict that before inner-core nucleation, the geodynamo would approach the weak-field state, in which the kinetic energy of the fluid core exceeds the magnetic energy. 9
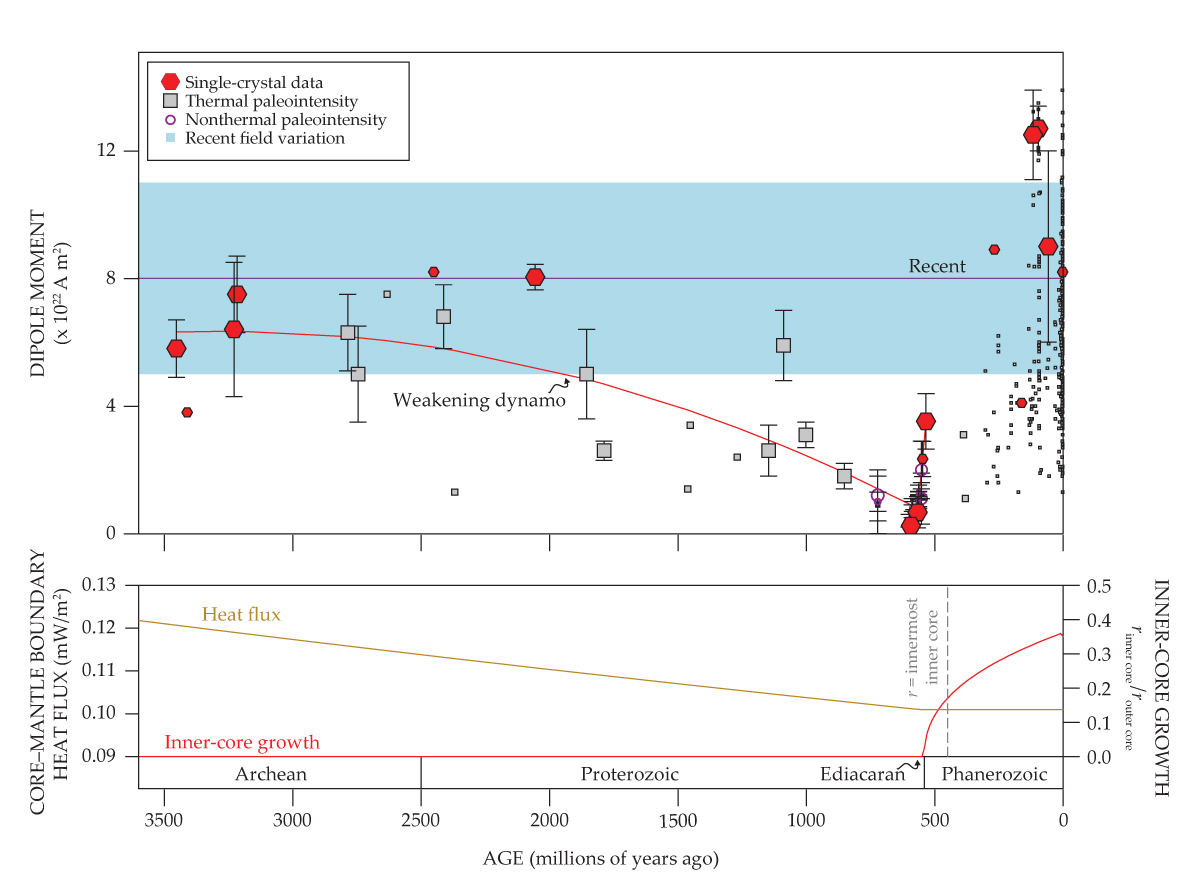
Bono and colleagues considered the long-term history of the geomagnetic field and found that time-averaged paleointensity data show highs and lows on time scales of tens to hundreds of millions of years, as would be expected if the generating efficiency of the geodynamo reflects changes in the pattern of heat flux across the boundary between the core and the mantle. Such variations might be imparted by cold sinking slabs of tectonic plates or by hot rising mantle plumes.
Yet behind those variations, the researchers also detected from 3.5 billion years ago a signal of an ever-decreasing dipole intensity leading into the field’s near-collapse, now dated between 591 and 565 million years ago, as shown in figure
Models predict that the magnetic field would strengthen as soon as the inner core started to grow because energy from both latent heat of crystallization and composition buoyancy would supply new power to the dynamo. Seizing on that prediction, Tinghong Zhou and colleagues conducted single-crystal paleointensity analyses on slowly cooled igneous rocks of the earliest Cambrian Period, just after the Ediacaran Period. They found that the time-averaged field strength had almost tripled between 565 and 532 million years ago
10
(see the top graph of figure
Since Inge Lehmann’s discovery of the solid inner core in 1936, seismologists have used data from large earthquakes to probe its inner structure. In 2002, Miaki Ishii and Adam Dziewoński found evidence for an innermost inner core, as sketched in figure
Zhou and colleagues investigated the possibility that changes in the lower mantle’s structure and heat flow could have influenced the pattern of iron crystallization that formed the inner core. Using their estimated age for the onset of inner-core nucleation and a model for its growth, they proposed that the boundary between the outermost and innermost inner core reflects a change in deep-mantle heat flow. In their model, the ancient deep mantle was dominated by one basal thermochemical structure until, some 450 million years ago, it was replaced with two structures—one beneath the Pacific Ocean and one beneath the Atlantic Ocean—by deep subduction of oceanic slabs (see the article by Ed Garnero and Claire Richardson, Physics Today, December 2024, page 36 ).
An explosion of animal life
Geophysicists and mineral physicists are approaching a consensus that could provide the key conceptual framework—the weak-field state before inner-core nucleation 5 , 9 —to understand why the Ediacaran geomagnetic field was so strange. Huang and colleagues also found a striking correlation between the evolutionary radiation (rapid increase in speciation) of animal life and the ultraweak field, and they took up anew the question of linkages with evolution. 7 , 12 Joseph Meert and colleagues had in 2016 suggested that a weaker field, which they inferred might be present from the apparent frequent geomagnetic reversals, was related to the explosion of complex life during the Cambrian Period, when nearly all modern animal phyla first appeared in the fossil record. (Although the Cambrian explosion of life has been recognized since the mid 20th century, the Avalon explosion of the preceding Ediacaran Period was discovered only in recent decades.)
Figure 3.

The collapse of Earth’s magnetic field in the late Ediacaran Period corresponds with the formation of the inner core, based on geodynamic simulations of the planet’s history. (top) Field strength (shown here as the strength of Earth’s dipole moment) over time is constrained by select paleointensity analyses. Symbol sizes are larger for time-averaged values. (bottom) Geodynamic models are used to estimate changes in the heat flux at the core−mantle boundary
In Meert and colleagues’ model, a key agent driving the Cambrian explosion was a greater incidence of energetic solar protons. 13 Charles Jackman and colleagues had long advocated that a deeper penetration of energetic solar particles into the atmosphere during periods of weak geomagnetic field strength would lead to chemical reactions that produce nitrogen oxides, which in turn would deplete the ozone layer and lead to an increase in UV radiation. Meert and colleagues hypothesized that a higher UV-B flux would increase mutation rates and thereby stimulate evolutionary processes during the Cambrian.
But Manasvi Lingam questioned the linkage because the atmosphere and water shield much UV radiation, something Carl Sagan had highlighted some 60 years earlier.
14
Paleontologists infer that most new Ediacaran and Cambrian animal forms lived in the subsurface of oceans, which makes UV shielding particularly relevant. And Huang and colleagues emphasize that the correlation between the ultraweak field and evolution is a phenomenon of the Ediacaran Period and not the Cambrian Period (see figure
Paleontologists have documented that eukaryotes (organisms with cell nuclei) were present before the Ediacaran Period, but they were almost exclusively microscopic in size. A dramatic increase in body size, however, occurred late in the Ediacaran Period—when mobile animals like the pancake-shaped Dickinsonia reached many decimeters in size 15 —and squarely within the time of ultraweak fields. Biologists generally associate larger body sizes and increased mobility with higher oxygen demands.
Is there evidence for increases in oxygenation during that spurt of evolution? Notwithstanding considerable ongoing debate associated with the difficulty of obtaining global oxygen signatures from measurements of ancient rocks, geochemists have found a wealth of data supporting an increase in oxygenation that coincides with the ultralow geomagnetic fields,
7
,
16
as shown in figure
Eric Blackman, David Sibeck, and I have considered whether the linkage might be found in changes to the paleomagnetosphere. Records of the strength of the time-averaged field can be derived from paleomagnetism, whereas solar-wind pressure can be estimated using data from solar analogues of different ages. My research group and collaborators have traced the history of solar–terrestrial interactions in the past by calculating the magnetopause standoff distance, where the solar-wind pressure is balanced by the magnetic field pressure, shown in figure
Satellite and ground-based measurements have established that the area of the polar cap, the high-latitude region where atmosphere loss can be exacerbated, will increase at smaller magnetopause standoffs. In a now-classic work, George Siscoe and Chin-Kung Chen summarized standoff distances with respect to the plasmasphere,
17
the region in the magnetosphere beyond which plasma density drops by an order of magnitude (see figure
Figure 4.

Potential connections between Earth’s magnetic field, oxygenation, and the evolution of life. (top) Geomagnetic field strength, shown here as the strength of Earth’s dipole moment, hit an all-time low (violet shading) in the late Ediacaran Period, followed by a rapid rise into the Cambrian Period, likely caused by the nucleation of Earth’s inner core. (middle) Atmospheric oxygen fluctuations over that period can be interpreted from relative variations in selenium isotopic ratios, δ82/76Se (open symbols, shown with a 25-million-year window mean and an error of one standard deviation).
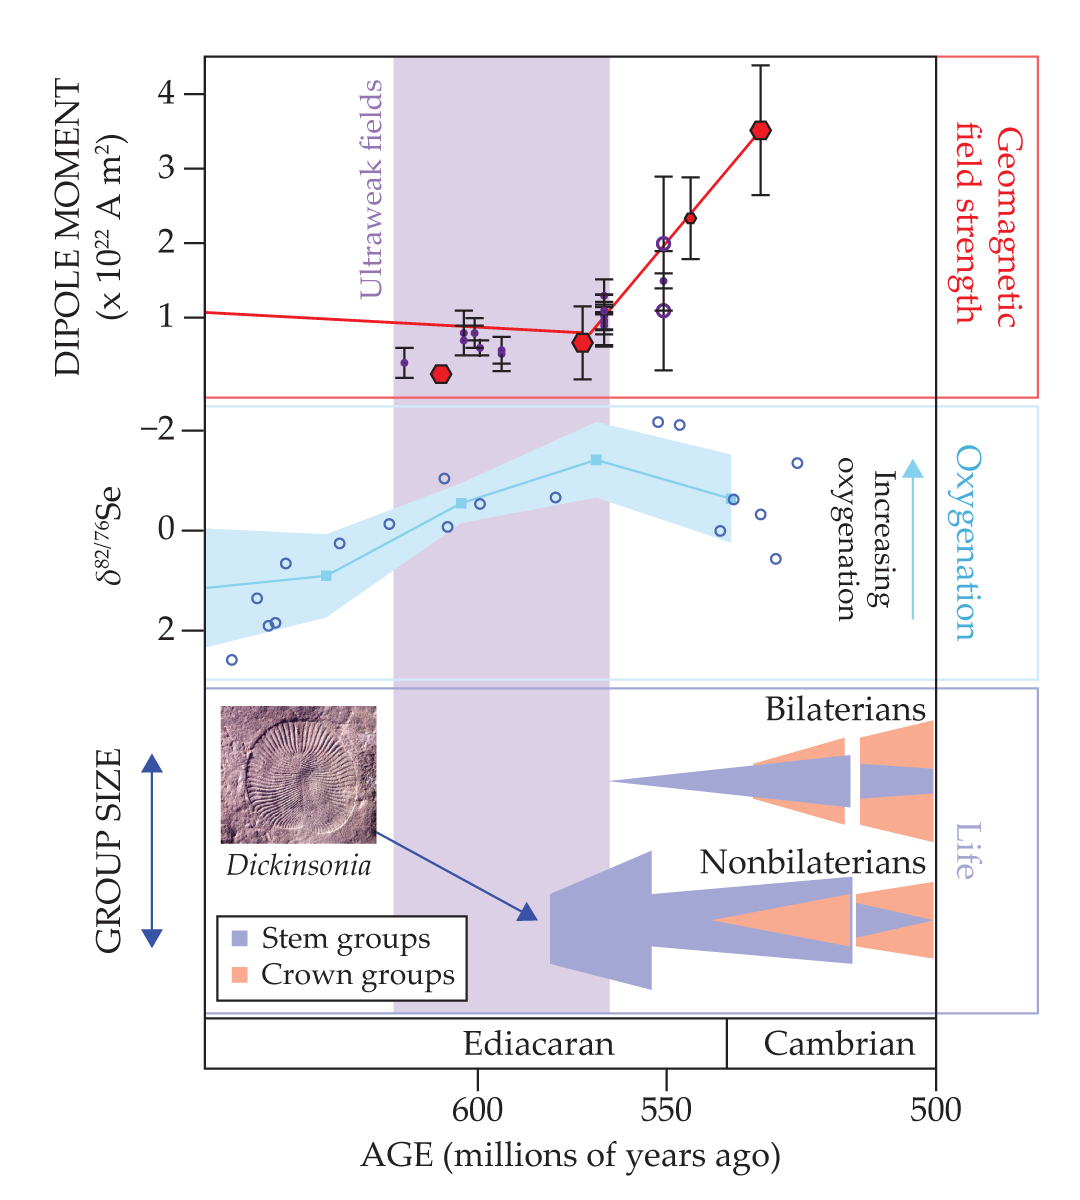
We are at an early stage in exploring exactly how much hydrogen could be lost, and available models yield different amounts, ranging from only modest increases in hydrogen escape to losses that produce oxygenation increases of a few percent. Together with our colleagues, we have proposed that the latter might represent the crossing of an oxygenation threshold and aided evolution of large, mobile Ediacaran animals like Dickinsonia.
Today, hydrogen supply to the plasmasphere and stratosphere is diffusion limited, so for hydrogen loss to be important, there needs to be an extra source of free hydrogen. We envision that source being tied to the increase in energetic solar particles, creation of nitrogen oxides, and destruction of the ozone layer, the process that Jackman, Meert, and others had contemplated. But we believe that the principal Ediacaran influence of increased UV radiation would be in increasing photodissociation of water and liberation of hydrogen that could ultimately escape to space.
New directions
In the past 12 years, paleomagnetists have found ultraweak magnetic fields for an interval that extended for tens of millions of years during the Ediacaran Period. They have demonstrated the reproducibility of that finding, and by sampling rocks from different ancient geologic regions, they have also provided strong evidence for the global nature of the ultraweak field. My colleagues and I interpret the weak field in the Ediacaran Period, followed by the increase in strength during the late Ediacaran and early Cambrian Periods, as marking the onset of inner-core nucleation.
That view is consistent with numerous models of Earth’s thermal history and geodynamo models, but the sparseness of the database of robust paleointensity values, uncertainties in the core’s thermal conductivity, and limitations of models in reaching parameters representing the core still allow for alternative models and interpretations. Addressing those uncertainties will enable the exploration of related fundamental questions, including whether the innermost inner core preserves a signal of an ancient mantle structure.
The correlation between the ultralow time-averaged Ediacaran field and evolutionary radiation of animal life is independent of uncertainties in the timing of inner-core nucleation. Many geologists and geochemists have produced data that show a concomitant increase in oxygenation, but the difficulties of isolating unambiguous global signals remain. Many biologists would regard an increase in oxygenation as a plausible factor aiding the evolution of larger, mobile Ediacaran animals. Our hypothesis of hydrogen loss provides a mechanism to link the ultralow fields, oxygenation, and animal radiation.
Scientists studying the Earth system, from surface to magnetosphere, will need to test the viability of that idea and other potential linkages that might explain the data and correlations. If our hypothesis is correct, we will have flipped the classic idea that magnetic shielding of atmospheric loss was most important for life, at least during the Ediacaran Period: The prolonged interlude when the field almost vanished was a critical spark that accelerated evolution.
This article was originally published online on 13 March 2025.
Editor’s note, 19 March: The first paragraph of the article originally said that Earth’s geodynamo is more than 4 billion years old; the sentence has been updated to say researchers think that is the age. The first paragraph in the box was also updated to clarify the mechanism for the magnetization of magnetic minerals.
References
1. J. Uffen, Nature 198, 143 (1963).https://doi.org/10.1038/198143b0
2. J. A. Tarduno et al., Science 349, 521 (2015).https://doi.org/10.1126/science.aaa9114
3. E. Irving, Paleomagnetism and Its Application to Geological and Geophysical Problems, Wiley (1964).
4. L. Tauxe et al., Essentials of Paleomagnetism, 5th Web ed. (2018), available at https://earthref.org/MagIC/books/Tauxe/Essentials .
5. R. K. Bono et al., Nat. Geosci. 12, 143 (2019).https://doi.org/10.1038/s41561-018-0288-0
6. D. Thallner et al., Geophys. J. Int. 231, 474 (2022).https://doi.org/10.1093/gji/ggac186
7. W. Huang et al., Commun. Earth Environ. 5, 207 (2024).https://doi.org/10.1038/s43247-024-01360-4
8. F. Nimmo, in Treatise on Geophysics, 2nd ed., vol. 8, G. Schubert, ed., Elsevier (2015), p. 27.https://doi.org/10.1016/B978-0-444-53802-4.00139-1
9. P. E. Driscoll, Geophys. Res. Lett. 43, 5680 (2016).https://doi.org/10.1002/2016GL068858
10. T. Zhou et al., Nat. Commun. 13, 4161 (2022).https://doi.org/10.1038/s41467-022-31677-7
11. J. Stephenson, H. Tkalčić, M. Sambridge, J. Geophys. Res. Solid Earth 126, e2020JB020545 (2021).https://doi.org/10.1029/2020JB020545
12. R. Wood et al., Nat. Ecol. Evol. 3, 528 (2019).https://doi.org/10.1038/s41559-019-0821-6
13. J. G. Meert et al., Gondwana Res. 34, 149 (2016).https://doi.org/10.1016/j.gr.2016.01.001
14. C. Sagan, Nature 206, 448 (1965).https://doi.org/10.1038/206448a0
15. S. D. Evans, J. G. Gehling, M. L. Droser, Geobiology 17, 490 (2019).https://doi.org/10.1111/gbi.12351
16. P. A. E. Pogge von Strandmann et al., Nat. Commun. 6, 10157 (2015).https://doi.org/10.1038/ncomms10157
17. G. L. Siscoe, C.-K. Chen, J. Geophys. Res. 80, 4675 (1975).https://doi.org/10.1029/JA080i034p04675
18. D. J. Dunlop, Ö. Özdemir, Rock Magnetism: Fundamentals and Frontiers, Cambridge U. Press (1997).https://doi.org/10.1017/CBO9780511612794
More about the authors
John A. Tarduno is the William R. Kenan, Jr, Professor of Geophysics and dean of research for the School of Arts and Sciences and the Hajim School of Engineering and Applied Sciences at the University of Rochester in New York.


