Diederik Korteweg, Pioneer of Criticality
DOI: 10.1063/1.1537912
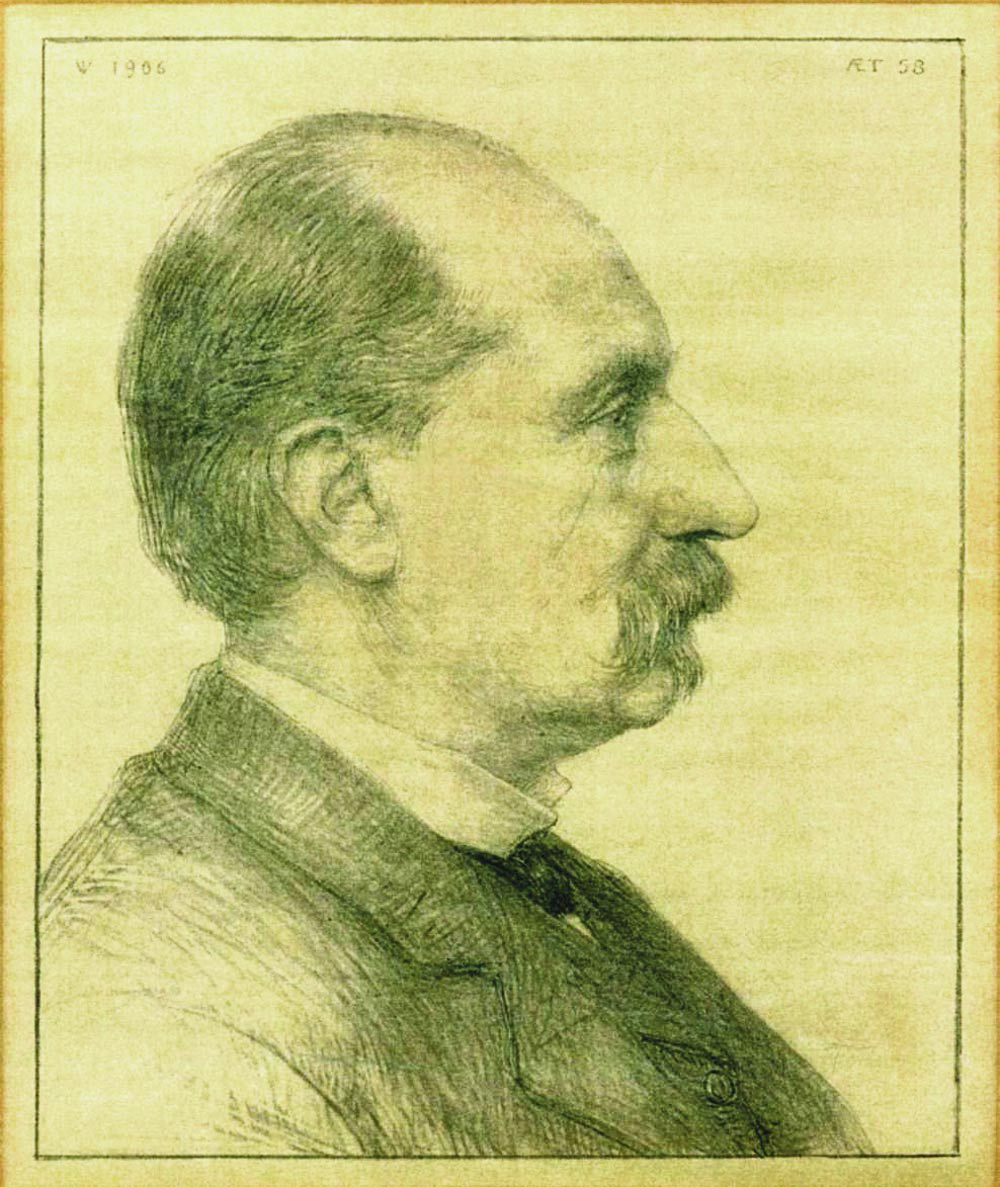
Dutch mathematician Diederik Johannes Korteweg (1848–1941), pictured in figure 1, is best known for the 1895 paper he wrote with his student Gustav De Vries. That paper, on the propagation of soliton waves in channels, has, in recent decades, been widely recognized as a groundbreaking work. 1 Korteweg also studied the stress—now called the Korteweg stress—resulting from density gradients at an interface between two fluids. 2 Korteweg’s contributions to the thermodynamics of phase transitions and criticality in fluid mixtures are far less known. They include honing the tools of differential geometry to characterize phase separation and criticality of fluid mixtures, developing a method of deformation of surfaces, and performing the first detailed analysis of the phase behavior of a special case of the van der Waals equation for binary fluid mixtures. 3

Figure 1. Diederik J. Korteweg in profile, as sketched by Dutch artist Jan Veth in 1906.
(Courtesy of Bastiaan Willink, Erasmus University, Rotterdam.)
Korteweg was born and raised in the southern Dutch province of Brabant. Fascinated by mathematics, he entered the Polytechnical School at Delft, but the engineering courses quickly discouraged him. He left, and took mathematics and mechanics courses that qualified him to teach. While a high-school teacher, he studied for the state exam in Latin and Greek, a requirement for access to a university education. He also published his first papers and corresponded with Johannes Diderik van der Waals (1837–1923) on the volume excluded by a collection of hard spheres.
After passing the university admission exam in 1876, Korteweg studied mathematics at the University of Utrecht for a year, and then entered the newly founded University of Amsterdam. His ascent there was meteoric. He defended his doctoral thesis on the propagation of waves in elastic tubes in 1878. His was the first doctorate granted by the young university, and physics professor van der Waals bestowed the degree. In September 1881, Korteweg assumed a professorship of mathematics with the inaugural address, “Mathematics as an Auxiliary Discipline.” He lived by his conviction that mathematics plays an important role in science, as proved by his work in thermodynamics, kinetic theory, and hydrodynamics. From 1900 to 1920, he edited volumes 11–15 of the collected papers of Christiaan Huygens. Korteweg was the thesis adviser of L. Egbertus Brouwer, who became famous for his work in topology and on the foundations of mathematics, 4 and to whom Korteweg voluntarily ceded his professorship in 1913.
In 1891, Korteweg published two seminal papers in the same volume of the Archives Néerlandaises des Sciences Exactes et Naturelles. The first concerned critical points, the second was about folds on surfaces. 5 The French version of van der Waals’s paper on the molecular theory of mixtures 6 appeared in the same volume. Van der Waals had worked on his theory for many years, and received Korteweg’s assistance with the mathematical aspects.
The van der Waals equation
Why was van der Waals so interested in the phase behavior of fluid mixtures? Fluid criticality had been recognized since 1822, and the critical points of many fluids had been measured by the time van der Waals formulated his equation of state in 1873. Reasonable approaches had been developed for describing the properties of gaseous mixtures and liquid solutions, but there remained a no man’s land at the intermediate densities where criticality typically occurs. (For a tutorial on criticality and its relation to phase transitions, see the
Thomas Andrews published his experimental exploration of the criticality and condensation behavior of carbon dioxide in 1869. Four years later, van der Waals’s equation of state offered a satisfactory formulation of both vapor and liquid properties. 6 By 1880, Andrews, Louis Cailletet, and even van der Waals himself had experimented with the condensation of pressurized gas mixtures, but they were at a loss to interpret the results.
One could argue that the theoretical problem of phase behavior in fluid mixtures had already been solved. The seminal work of Josiah Willard Gibbs, published between 1873 and 1878, provided the theoretical tools. 7 Gibbs’s achievement was as formidable in its concepts and completeness as it was forbidding in its abstract approach. Among the few scientists grasping its significance were the omniscient James Clerk Maxwell and van der Waals. Nevertheless, even van der Waals did not know how to apply Gibbs’s theory to the mixture he had studied. Not until 1890 did van der Waals build a bridge between theory and the laboratory by generalizing his 1873 equation of state so that it could be applied to two-component systems.
Before considering those relatively complicated systems, we review some important properties of the simpler one-component systems. The van der Waals equation of state for a mole of fluid is

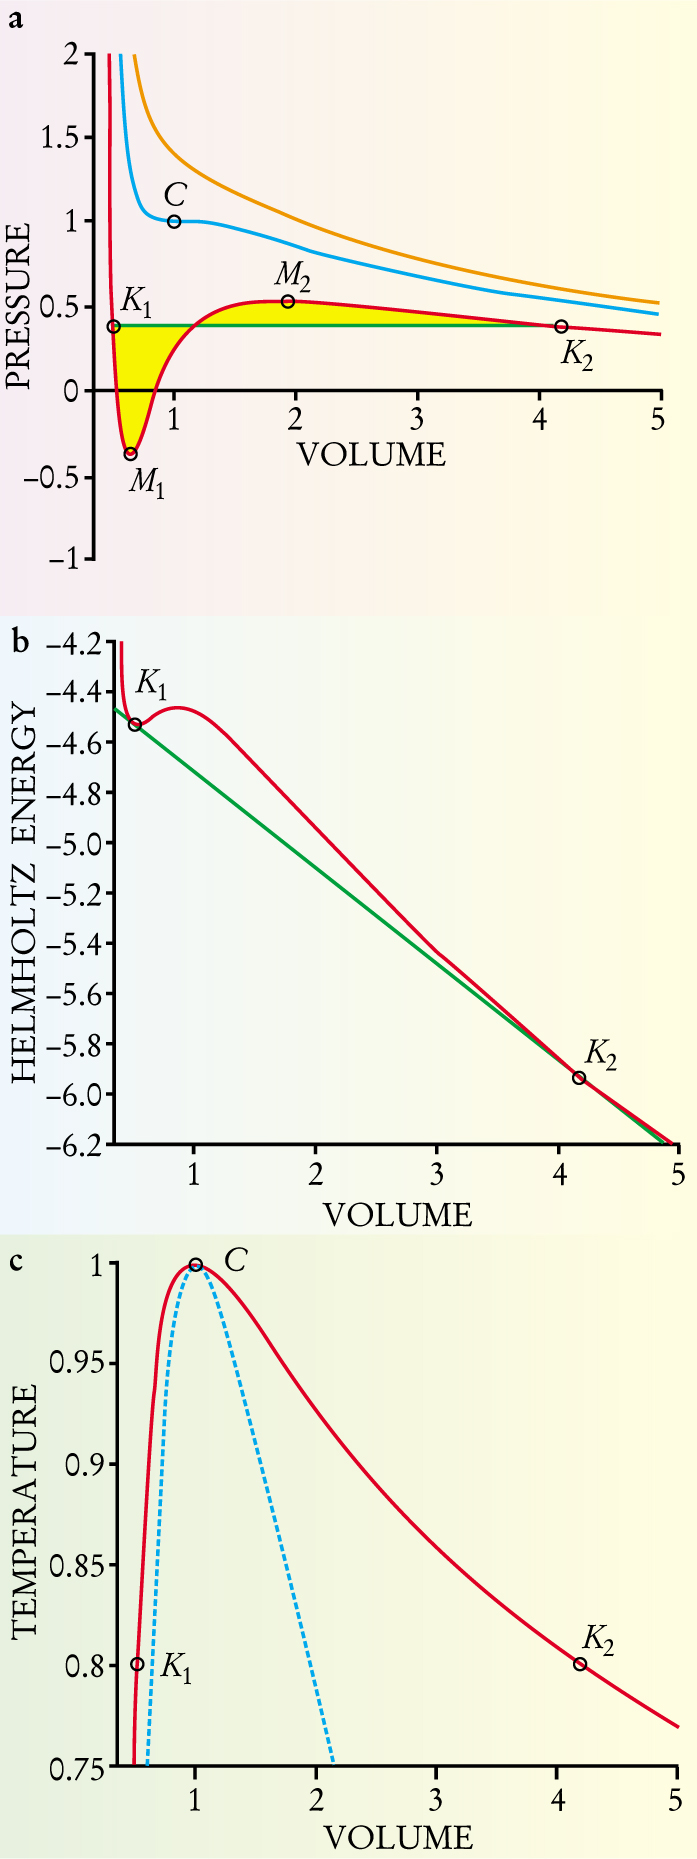
Figure 2. Thermodynamic variables for a one-component system are related by the van der Waals equation of state. (a) The relation between pressure and volume is shown along isotherms, curves of constant temperature. Pressure and volume coordinates are normalized so that the critical point C lies at (1,1). The P–V isotherm at the critical temperature (blue) has a horizontal inflection point at C, where the compressibility is infinite. The compressibility along an isotherm above the critical temperature (orange) is always finite. An isotherm below the critical temperature (red) develops a so-called van der Waals loop between the connodes K 1 and K 2. James Clerk Maxwell proved that the areas (yellow) defined by the loop and the green tie line that connects the connodes must be equal. The connecting tie line describes two-phase states of the system. The minimum (M 1) and maximum (M 2) of the subcritical isotherm are points of infinite compressibility; they are called spinodal points. Between the spinodal points, the compressibility is negative, which thermodynamics forbids. (b) The Helmholtz energy along a subcritical isotherm displays two connodes connected by a doubly tangent tie line. When the volume of the system is between the values defined by the connodes, the system can lower its free energy by following the tie line and splitting into two phases, one liquid, one vapor. The doubly tangent nature of the tie line, like Maxwell’s equal-area rule, guarantees that the two phases are in equilibrium. (c) The coexistence curve, or connodal (solid curve), connects the connodes at all temperatures. At a given subcritical temperature, a dense liquid (at K 1) coexists with a vapor (at K 2). As the temperature increases, the molar volumes of vapor and liquid approach each other. They become equal at the critical point, above which there is no longer a liquid–vapor phase transition. The dashed curve is the spinodal, the locus of extremal points as detailed in (a). It bounds a region that is thermodynamically unstable.
Solving for the pressure from equation
Figure
The T−V diagram in figure
Generalization to two components
Van der Waals generalized his equation of state from one to two components by postulating that a and b depend on the relative amounts of the two components.
6
The mole fraction X of the second component is one way to parameterize the relative quantities. The equation of state for a two-component mixture is thus
Thus, the Helmholtz energy of a binary mixture is a function of three variables: V, X, and T. According to Gibbs’s phase rule, the system will have critical curves instead of critical points, coexistence surfaces instead of coexistence curves, and up to four coexisting phases. The result is some very complicated phase behavior.
In the one-component case, as seen in figure
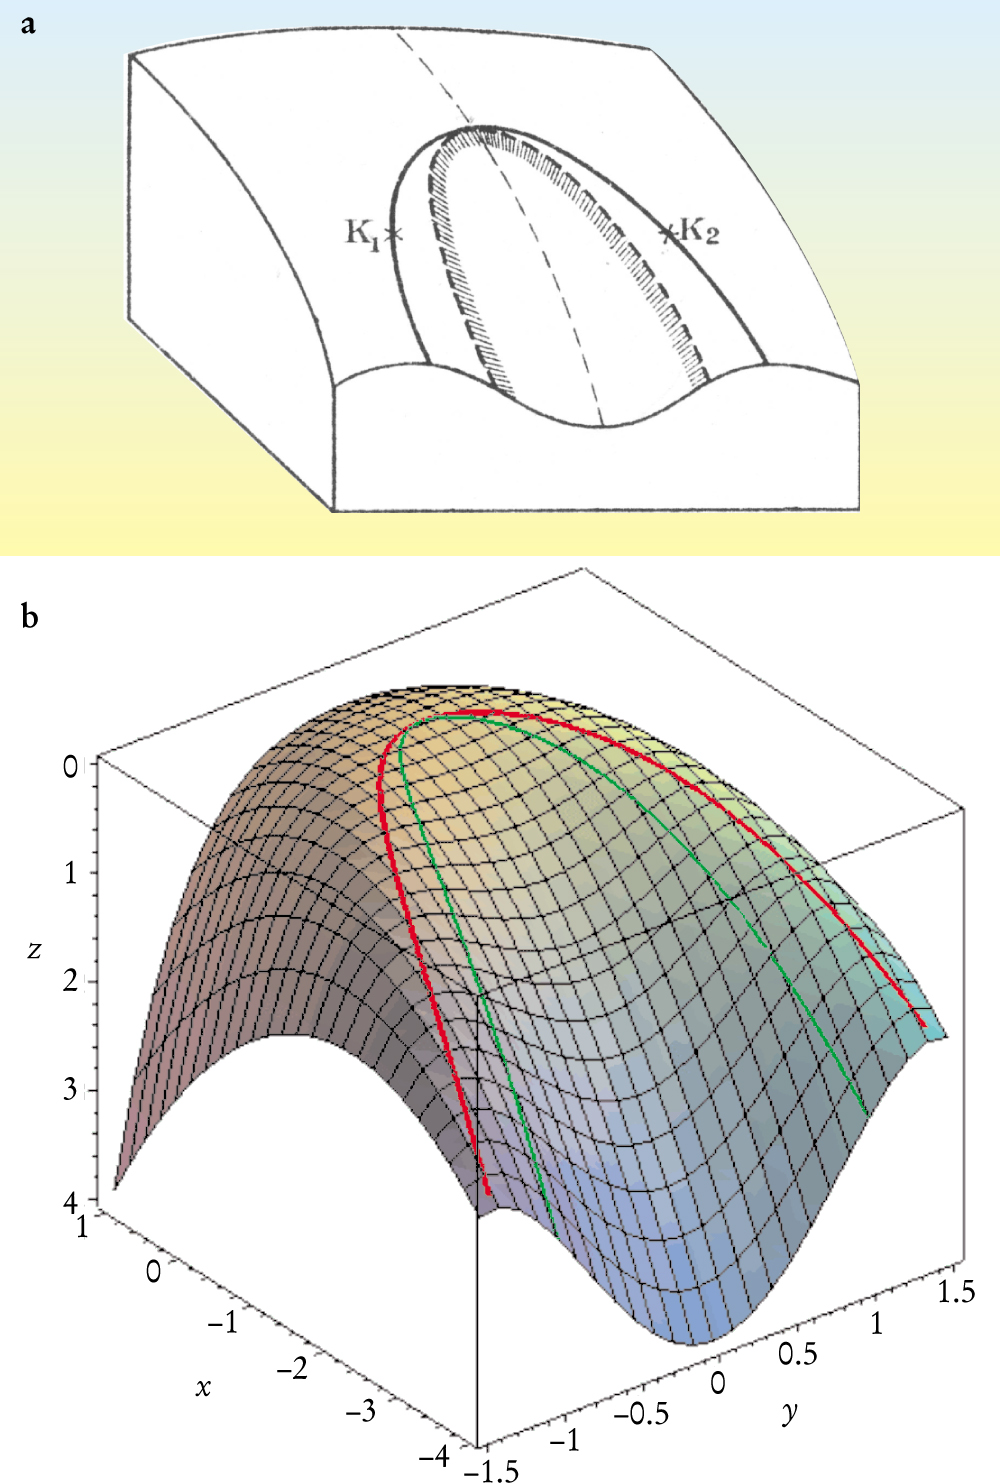
Figure 3 shows a typical region of a smooth surface z(x, y) near an ordinary critical point. At a point where the surface is bowl-shaped, the curvature is positive: All nearby points are on the same side of the tangent plane. At a point in the saddle-shaped region, the curvature is negative: There are nearby points on both sides of the tangent plane. Thermodynamic free energies are always unstable at points of negative curvature. The spinodal in figure 3 is the boundary between regions of positive and negative curvature. At spinodal points, the curvature is zero. A double-tangent plane rolling over the surface traces out a coexistence curve, or connodal. We use the word fold to describe the region bounded by the connodal. The fold shown in figure 3 ends in a critical point where the two tangent points merge. Korteweg and Maxwell credit Arthur Cayley for first defining such a point.

Figure 3. A smooth surface z(x, y) near a critical point. (a) Diederik Korteweg’s lithograph shows the spinodal (dashed curve), which bounds a saddle-shaped region. A tangent plane may touch the surface at two points, called connodes K 1 and K 2. A tie line (not shown) connects the connodes. If rolled across the surface, the double-tangent plane traces out a locus called a connodal (solid curve). Korteweg called the part of the surface inside the connodal a plait—a smooth fold. A fold may end in a plait point, nowadays called a critical point, at which two connodes coincide. If the surface is to represent a Helmholtz energy near a critical point, it needs to be turned upside down and tilted. (b) A similar surface, generated on a computer, shows the connodal in red and the spinodal in green.
Van der Waals was able to show that, when his mixture equation was applied to components not greatly dissimilar, ordinary vapor–liquid phase separation occurs at sufficiently low temperature. Thus, the isothermal surface A(V, X) has a fold running from X = 0 to X = 1 that separates a large-molar-volume gas phase and a dense liquid phase. Such a fold is called a transverse fold. Separation of liquid phases occurs if the attraction between the two components is weaker than an appropriate average, that is, if
A fold is as well characterized by its spinodal as it is by its connodal. The spinodal is the easier of the two to calculate, because it follows from a local condition on the surface: a change of the sign of the curvature. The connodal follows from a global condition—tangency in more than one point—and was rarely calculated by Korteweg.
Criticality in brief
Below its critical temperature, a pure fluid, when pressurized, passes from the vapor to the liquid phase by abruptly undergoing a large change in molar volume. Such a first-order phase transition is illustrated in figure 2(a). At the critical point of a fluid (see figure
Many systems display critical points. A partially miscible liquid mixture becomes fully miscible at such a point. Certain crystals consist of A and B atoms that, at low temperatures, are arranged in an orderly way, occupying two interlaced sublattices. That order disappears at a critical point, as does the spontaneous magnetization of a magnet. The Bragg–Williams theory of order–disorder transitions, the Weiss theory of magnetism, the van der Waals theory, and the Korteweg work discussed in this article all implicitly assume that the environment of a molecule or magnetic spin equals the bulk average. Such mean-field theories neglect fluctuations.
The modern approach to criticality began in the mid-20th century with the study of a model for the magnetic phase transition, the Ising model. In that model, lattice sites are occupied by magnetic spins that are either up or down. At low temperatures, the spins are aligned, and spontaneous magnetization results. As the temperature increases, the spins begin to flip, and the magnetization diminishes, to disappear at a critical point. If up and down spins are replaced by A and B molecules, the Ising model describes the disordering of an AB crystal, or the criticality of an incompressible binary liquid mixture. It becomes a model for the gas–liquid transition—the lattice gas—by identifying an up spin with the presence of a molecule, and down spin with an empty site. Detailed analysis of the Ising model has demonstrated that mean-field theory’s neglect of fluctuations is significant, particularly near the critical point, where the fluctuations are especially large.
In 1937, Russian physicist Lev Landau used mean-field theory to study the heat capacity of systems undergoing second-order phase transitions. 9 He introduced the fundamental concept of the order parameter. In a magnet, for example, the order parameter is the spontaneous magnetization. The magnetization is zero above, and finite, nonzero below the critical point, called a Curie point in this context. Landau proved that the curve of spontaneous magnetization versus temperature is a parabola near the Curie point. The Landau expansion at a critical point in terms of an order parameter forms the starting point for the modern renormalization-group treatment of criticality, which accounts for the effects of fluctuations. 8
When a second-order transition is a function of an additional variable such as the pressure, the additional variable leads to a curve of critical points. The curve may end at a point at which the system splits into two phases. Landau worked out the Taylor expansion of a free energy at points on the critical curve, including the point where the phase split begins. In the 1960s, a physical system was discovered that exhibited the behavior studied by Landau: The critical curve for the superfluid transition of helium-4 diluted with helium-3 ends with the mixture splitting into a superfluid phase and a normal phase, each with different composition. In 1970, Robert Griffiths called the splitting point a (symmetric) tricritical point (see ref. ). As early as 1891, however, Korteweg had thoroughly studied the Taylor expansion of the isothermal Helmholtz energy of binary mixtures at points along a critical curve, and had discovered a symmetric tricritical point.
Folds on surfaces
In his 1891 papers on criticality, 5 Korteweg analyzed the properties of critical points and the evolution of folds. In the earlier of the two papers, he studied the properties of critical points on a surface. He performed a Taylor expansion of a surface z(x, y) at the critical point. The coordinates are defined so that, at the critical point, the tangent plane is the xy plane and the y-axis is tangent to the connodal. Because the tangent plane at the critical point is the limit of double-tangent planes, the surface is very flat in the y direction near the critical point. The Taylor expansion near that point is therefore quite different from an expansion at any arbitrary point on the surface.
From the expansion, Korteweg derived the form of the connodal and spinodal at the critical point, and found that, in first approximation, they were parabolas in xy coordinates. By imposing additional conditions on the expansion coefficients, Korteweg defined and examined double critical points. He then derived a set of three simultaneous equations, which, when solved, yield all critical points on an arbitrary surface.
Next he assumed that z(x, y) depends smoothly on an additional parameter—in the application to fluid mixtures, the parameter may be the temperature or an adjustable interaction parameter. His objective was to study local deformations, that is, the effect of small changes of the parameter on the surface or on the coefficients of its Taylor expansion near the origin. Several things can happen. For instance, an ordinary or double critical point may appear or vanish, and a double critical point may split into two ordinary critical points. In modern geometry one speaks of unfoldings of z(x, y).
The Taylor expansion of the free energy at a critical point is generally credited to Lev Landau. 9 Korteweg, however, thoroughly explored such an expansion almost half a century before Landau’s classic paper.
In Korteweg’s second paper, the first objective is the global study (not restricted to the local neighborhood of a point) of surfaces, their folds, critical points, spinodals, and connodals. The next, and more difficult subject is global deformations. If the surface depends on a parameter, how do folds, critical points, spinodals and connodals evolve with changes of the parameter? When should one expect double-, triple- and quadruple-tangent planes, representing the coexistence of two, three, or even four phases? Korteweg obtained his results by exploiting the local theory of his first paper.
A special but important result described by Korteweg is the accessory fold, which is formed from a double critical point on the spinodal of an existing fold. The accessory fold may be fully formed before it protrudes beyond the connodal of the existing fold. Thus, in applications to a thermodynamic free-energy surface, folds forming in the unstable region deserve close attention.
Symmetric binary mixtures
General surfaces may have very complicated folds. In the last part of his general-theory paper, Korteweg introduced and analyzed in detail the van der Waals model for a symmetric binary mixture. That model yields interesting folds that can be completely understood. For the symmetric mixture shown in figures 4 and 5, the attraction coefficients satisfy a 1 = a 2 ≡ a. The Helmholtz energy surface of the two-component system is characterized by the single parameter κ ≡ a 12/a. If κ > 1, the only fold characterizing the system is a transverse vapor–liquid fold appearing at temperatures below the common critical temperature of the two components. The interesting case is κ < 1, in which additional phase separation occurs in the dense phase. Korteweg labeled the different ranges of κ he studied by the letters A (κ near zero) to E (κ just below unity).

Figure 5. Intermediate values of the interaction parameter κ lead to complicated phase behavior. The illustrations in the right panels are drawings from Diederik Korteweg’s analysis of his intermediate case D. The graphic conventions used here are described in figure
(copied with permission of the authors and IOP Publishing Limited, Bristol, UK).
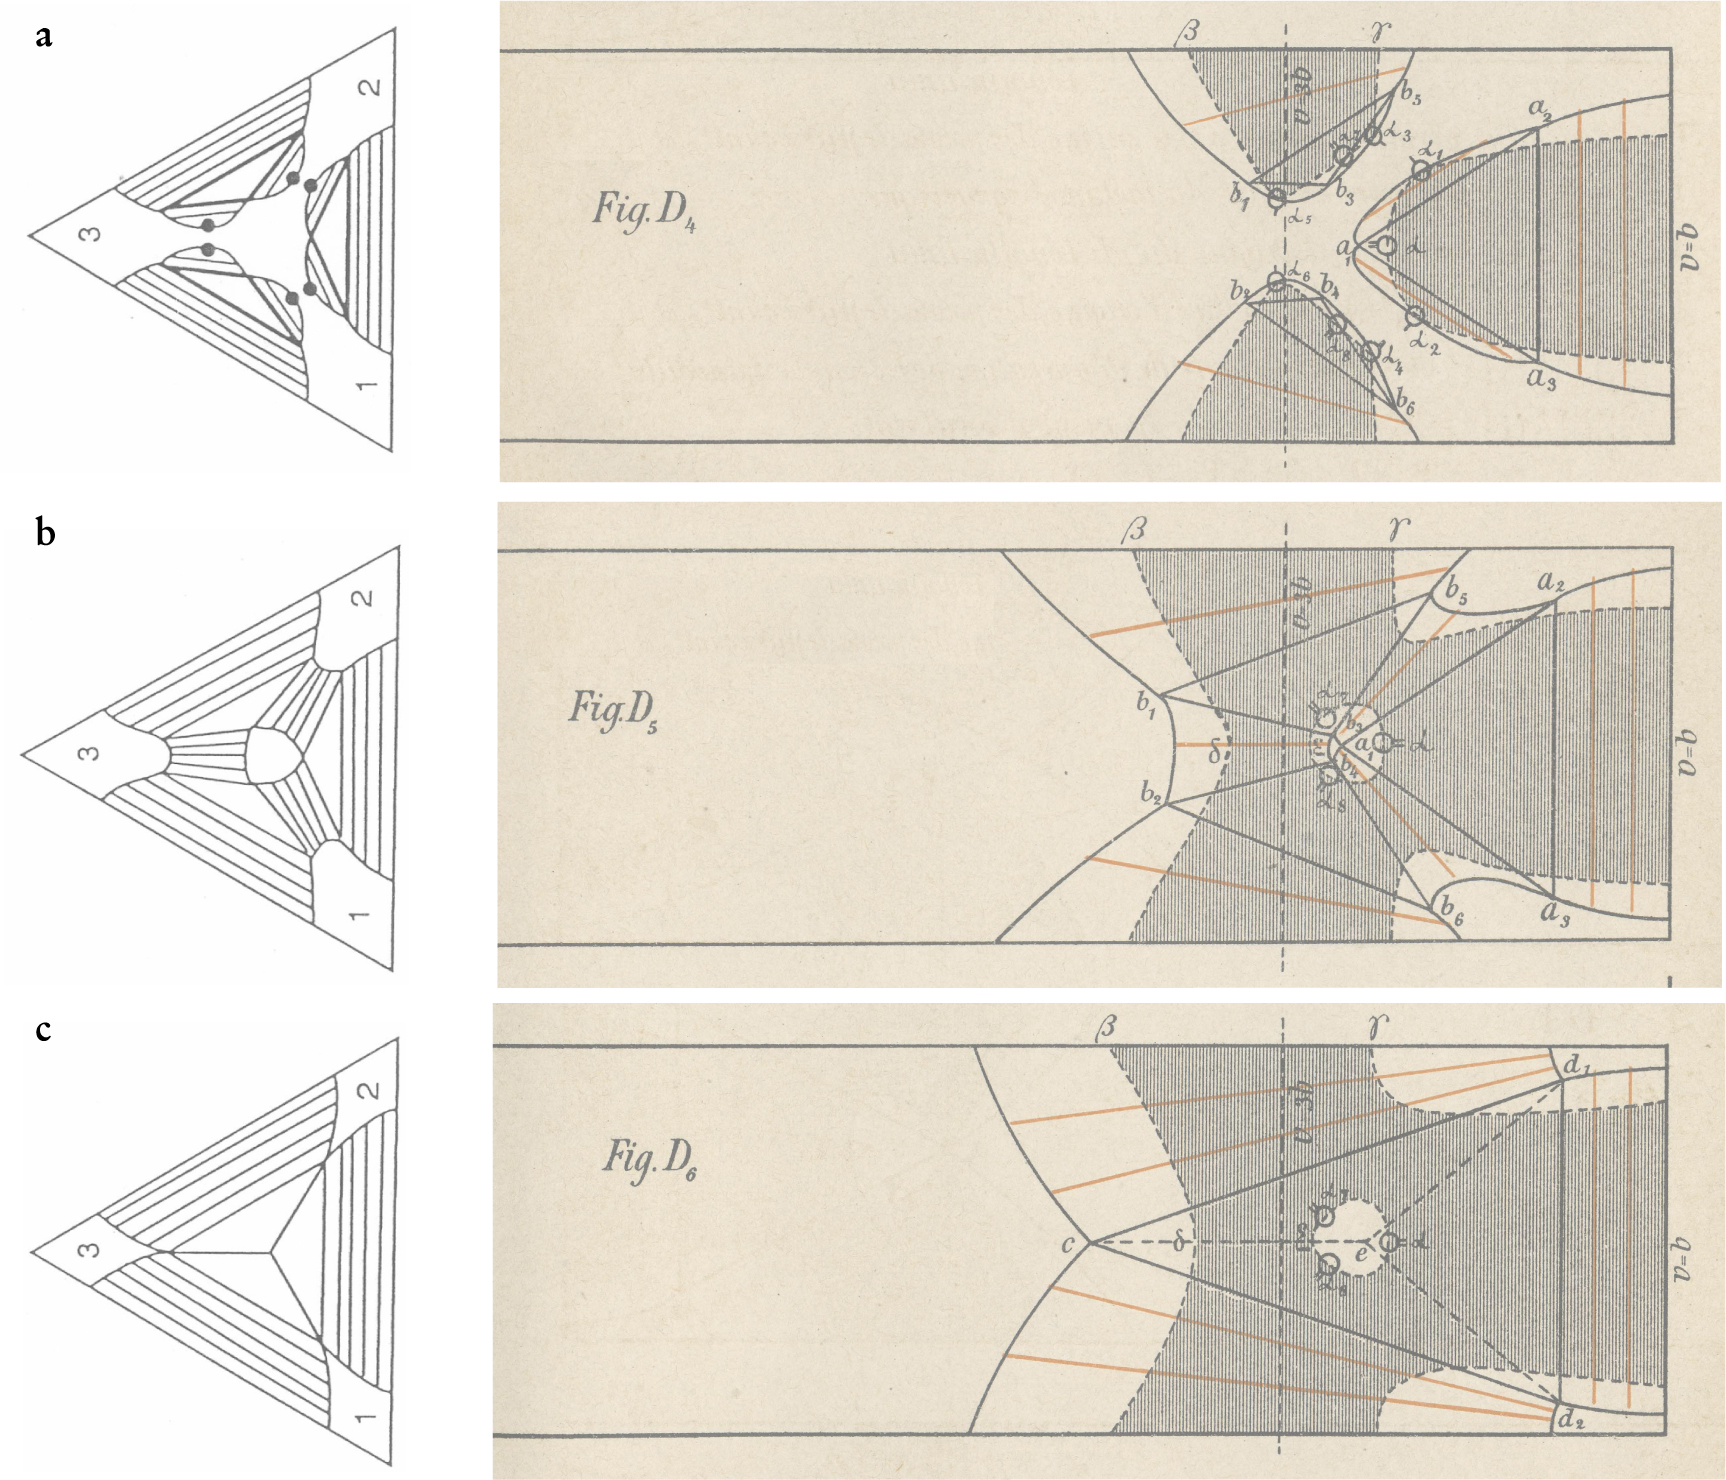

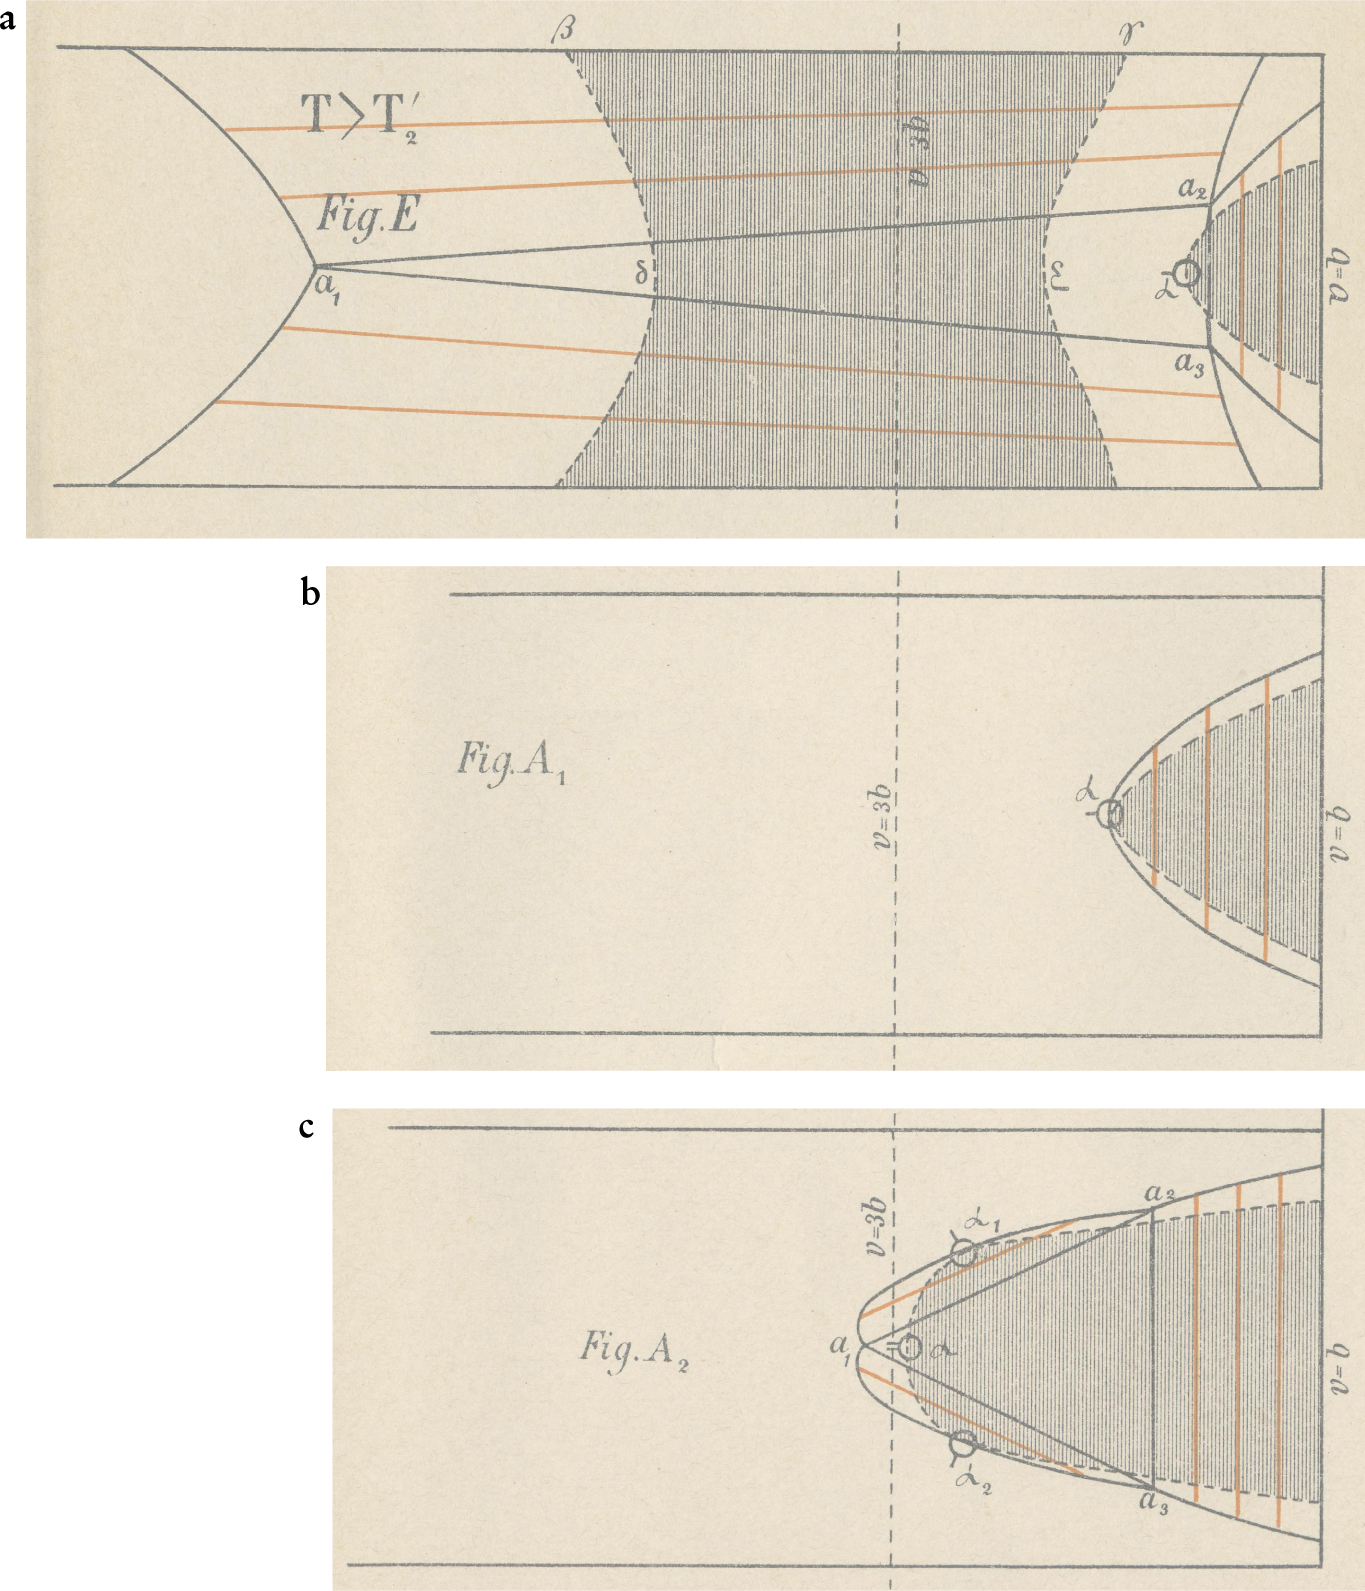
Figure 4. Phase separation of a symmetric van der Waals mixture, as drawn by Diederik Korteweg. Korteweg warned his readers that many features of the diagrams, in particular the connodals, are only qualitative. In all the diagrams, the temperature is fixed, the vertical component is the mole fraction X, and the horizontal coordinate is the volume (called v by Korteweg). The volume axis runs from the close-packed volume (V = b) on the right to larger volumes on the left. The line V = 3b indicates the critical volume of the pure components. The three plots are for different values of the interaction parameter κ, which runs from just below unity (case E) to near zero (case A). Case A2 is for lower temperature than A1. Regions where the surface has positive curvature are blank; those where it has negative curvature are shaded. Dashed curves are spinodals, solid curves are connodals. Red line segments are tie lines, and triangles represent three-phase coexistence. (a) κ is almost 1. Below the critical temperature of the two components, a transverse fold separates vapor and liquid. At a much lower temperature, a longitudinal fold appears, separating two liquid phases. As the longitudinal fold cuts the connodal of the transverse fold, a three-phase region, indicated by the triangle a 1, a 2, a 3, is formed. (b) κ is near 0. The temperature is above the critical temperature of the two components, and there is no phase separation near X = 0 and X = 1. Nevertheless, there is phase separation at small volumes, and a longitudinal fold is present. (c) κ as in (b). The temperature is below that in (b), but still above the critical temperature of the components. The longitudinal fold has split at the top and developed two accessory folds that move to the sides with falling temperature, and finally produce a complete transverse vapor–liquid fold.
In case E, a transverse fold forms, as for κ > 1, but as the temperature is lowered, separation begins in the liquid phase. As the temperature further decreases, the transverse and longitudinal folds begin to interfere, and a triple tangent plane is formed. Figure
If, as in Korteweg’s case A, the interaction between the two components is very weak, a longitudinal fold forms even in the absence of a transverse fold (see figure
The most interesting cases are at intermediate values of κ for which the transverse and longitudinal folds compete. Figure 5 shows phase diagrams at successively decreasing temperatures that Korteweg analyzed as part of case D. In figure
In figure
Modern work
By 1906, Dutch scientists had reached the limits of what they could derive, given their computational tools, from the van der Waals binary-mixture model. Progress had to wait for the advent of the computer. During that wait, much of Korteweg’s work was forgotten, although vestiges can be found in the phase diagrams that appear throughout fluid and materials science. The breakthroughs of modern physics around 1900 forced thermodynamics into the background until the rebirth of interest in critical phenomena in the mid-20th century. In the 1960s, Robert Scott and his student Peter Van Konynenburg initiated a thorough, computer-based analysis of the phase behavior of the general van der Waals binary mixture. 11 Robert Griffiths and coworkers at Carnegie Mellon University rediscovered the region of four-phase coexistence in the context of a study of the three-state Potts model, which will now be introduced.
As described in the
Griffiths and coworkers did extensive numerical studies of both the symmetric and the asymmetric three-state Potts model (including the four-phase region) in the mean-field approximation. In 1978, they looked for, and found, a four-phase region in the van der Waals binary mixture. Their lower bound and center of the four-phase region for the symmetric mixture agree with Korteweg’s 1891 results, but there is a discrepancy with Korteweg’s value for the upper bound. A symbolic-numerical solution of Korteweg’s conditions for the upper bound, by one of us (Levelt), unearthed a wrong sign in one term of Korteweg’s equations for that bound. After correction, Korteweg’s equations yield precisely the modern numerical result.
Just as physicists have overlooked Korteweg’s contributions to the thermodynamics of phase transitions, mathematicians seem to have completely forgotten Korteweg’s work on folds on surfaces. That is an amazing oversight, given the originality and generality of his results, and the notions and techniques he used—singularities, deformations, and unfoldings—that are quite characteristic of modern geometry. Korteweg exploited new mathematical ideas to describe, analyze, and understand phase equilibria in binary mixtures. The reappearance in modern singularity and catastrophe theory 12 of problems Korteweg studied, particularly in the geometry of surfaces, confirms the importance of his new ideas.
Korteweg certainly would have benefited from the computational tools available to modern researchers. Symbolic computer software 13 would have allowed him to replace his many low-order approximations to physical quantities by expressions of arbitrarily high order and precision. Symbolic computation would have saved him much tedious labor in his analysis of the van der Waals model and enabled him to produce other visualizations in addition to the beautiful diagrams he published.
Part of this work was carried out at the symbolic computation group of the University of Waterloo, where Levelt recently occupied an Ontario Research Chair in Computer Applications. The research received support from the Foundation for Fundamental Research of Matter, and the Royal Holland Society of Sciences and Humanities in the Netherlands. We thank Paul Meijer for alerting us to Korteweg’s work. We thank John Rowlinson and NIST colleagues Jeffrey Aarons, Bert Coursey, and Daniel Friend for inspiration, advice, and constructive criticism.
References
1. M. Hazewinkel, H. W. Capel, E. M. de Jager, eds., KdV ‘95: Proceedings of the International Symposium, held in Amsterdam, the Netherlands, April 23–26, 1995, to commemorate the centennial of the equation by and named after Korteweg and de Vries, Kluwer Academic, Boston (1995).
2. D. D. Joseph, Y. Y. Renardy, Fundamentals of Two-Fluid Dynamics, Springer-Verlag, New York (1991), part 2, chap. 10.
3. Korteweg’s work is treated in detail in J. Levelt Sengers, How Fluids Unmix: Discoveries by the School of Van der Waals and Kamerlingh Onnes, Edita, Royal Netherlands Academy of Arts and Sciences, Amsterdam (2002).
4. D. van Dalen, Mystic, Geometer, and Intuitionist: The Life of L. E. J. Brouwer, vol. 1, Clarendon Press, New York (1999).
5. D. J. Korteweg, Arch. Néerl. Sci. Exactes Nat. 24, 57 (1891); 24, 295 (1891).
6. J. S. Rowlinson, ed., J. D. van der Waals: On the Continuity of the Gaseous and Liquid States, North-Holland, New York (1988).
7. J. W. Gibbs, The Scientific Papers of J. Willard Gibbs. Vol. 1, Thermodynamics, Longmans, Green, New York (1906), reprinted by Ox Bow Press, Woodbridge, Conn. (1993).
8. An excellent introduction to the topics discussed in this article is H. B. Callen, Thermodynamics and an Introduction to Thermostatics, 2nd ed. Wiley, New York (1985).
9. D. ter Haar, ed., L. D. Landau, vol. 2, Pergamon Press, New York (1969).
10. C. M. Knobler, R. L. Scott, in Phase Transitions and Critical Phenomena 9, 164 (1984).
11. R. L. Scott, Acc. Chem. Res. 20, 97 (1987).https://doi.org/10.1021/ar00135a004
12. A short, readable, and elegant introduction is V. I. Arnol’d, Catastrophe Theory, 3rd ed., Springer-Verlag, New York (1992).
13. R. Taylor, Math. Comput. Simul. 45(1) 101 (1998);
R. Taylor, Math. Comput. Simul. 45(2) 121 (1998).https://doi.org/10.1016/S0378-4754(97)00090-6
More about the authors
Anneke Levelt Sengers is an emeritus scientist at the National Institute of Standards and Technology in Gaithershurg, Maryland.
Ton Levelt is an emeritus professor of mathematics at the University of Nijmegen in the Netherlands.
Johanna Levelt Sengers, 1 National Institute of Standards and Technology, Gaithersburg, Maryland, US .
Antonius H. M. Levelt, 2 University of Nijmegen, The Netherlands .


