Eclipse science today
DOI: 10.1063/PT.3.4278

Our sun is a celestial laboratory only 8 light-minutes from Earth. Its close proximity means that we can see details there that we cannot see in other stars. The Sun’s energy, formed by nuclear fusion deep inside, travels to the surface by radiation and convection until it reaches a layer in which the gas is especially transparent. The visible and IR radiation emitted from that photosphere is what heats Earth to habitable temperatures.
Just above the photosphere is the chromosphere, about one-thousandth as bright and composed of spiky structures about 10 000 km high; the name comes from the colorful, mainly hydrogen and helium emission lines seen during solar eclipses when the chromosphere is silhouetted against a dark background. (See the Quick Study by Charles Kankelborg, Physics Today, April 2012, page 72 .) Above it is the solar corona, one-thousandth as bright as the chromosphere. The visible light from the photosphere is so bright that it turns the daytime sky blue and prevents us from observing those faint outer solar layers. The upshot is that the corona is visible from Earth only when the Sun is up but the blue sky is absent. That situation happens only during a total solar eclipse.
Observing the corona
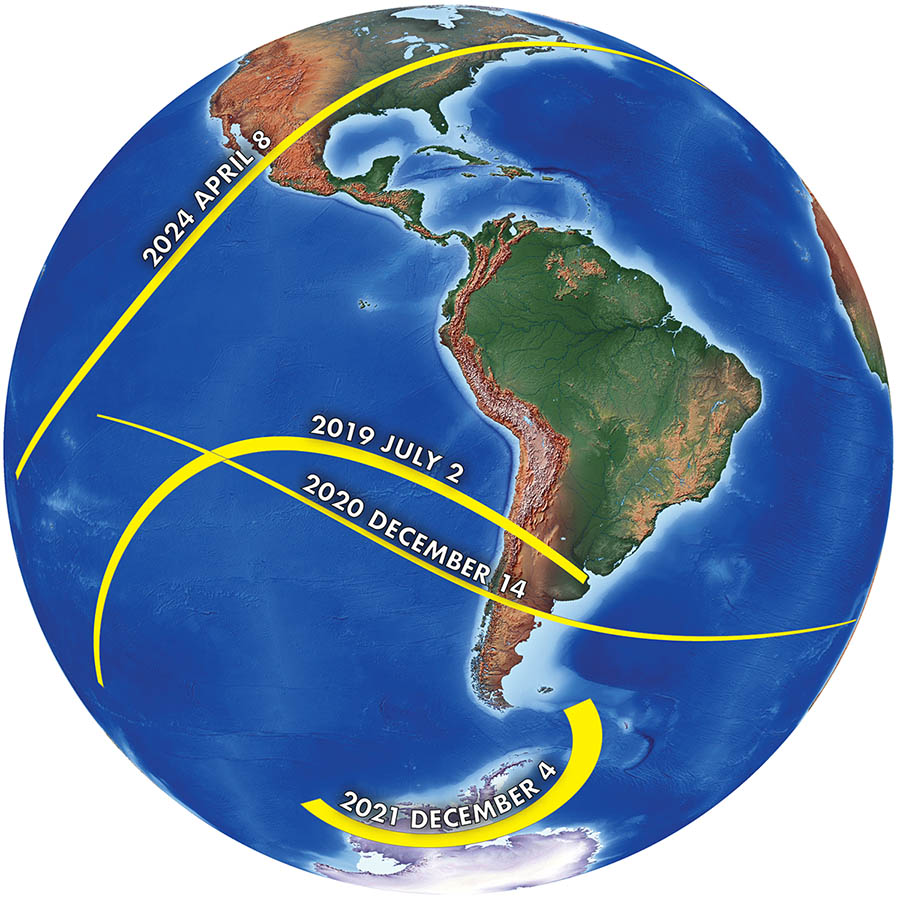
About every 18 months, the Sun, Moon, and Earth align in a syzygy in which the Moon—1/400 the size of the Sun but also about 1/400 as far from Earth—passes centrally over the solar disk and blocks out the entire photosphere. (Also about every 18 months, the Moon is farther from Earth than it usually is and a ring of photosphere remains in the sky; during almost all such annular eclipses, the sky is too bright for anyone on Earth to see the solar corona.) Figure

Figure 1. Map of total solar eclipses, 2019–24. Only within the narrow path of totality can the corona be seen by the unaided eye. During annular eclipses or partial phases close to totality, even the few percent of the photosphere that remains visible brightens the sky enough to hide the corona. The 2023 path of totality is not shown. (Courtesy of Michael Zeiler, www.eclipse-maps.com , CC BY-NC-ND 3.0 .)
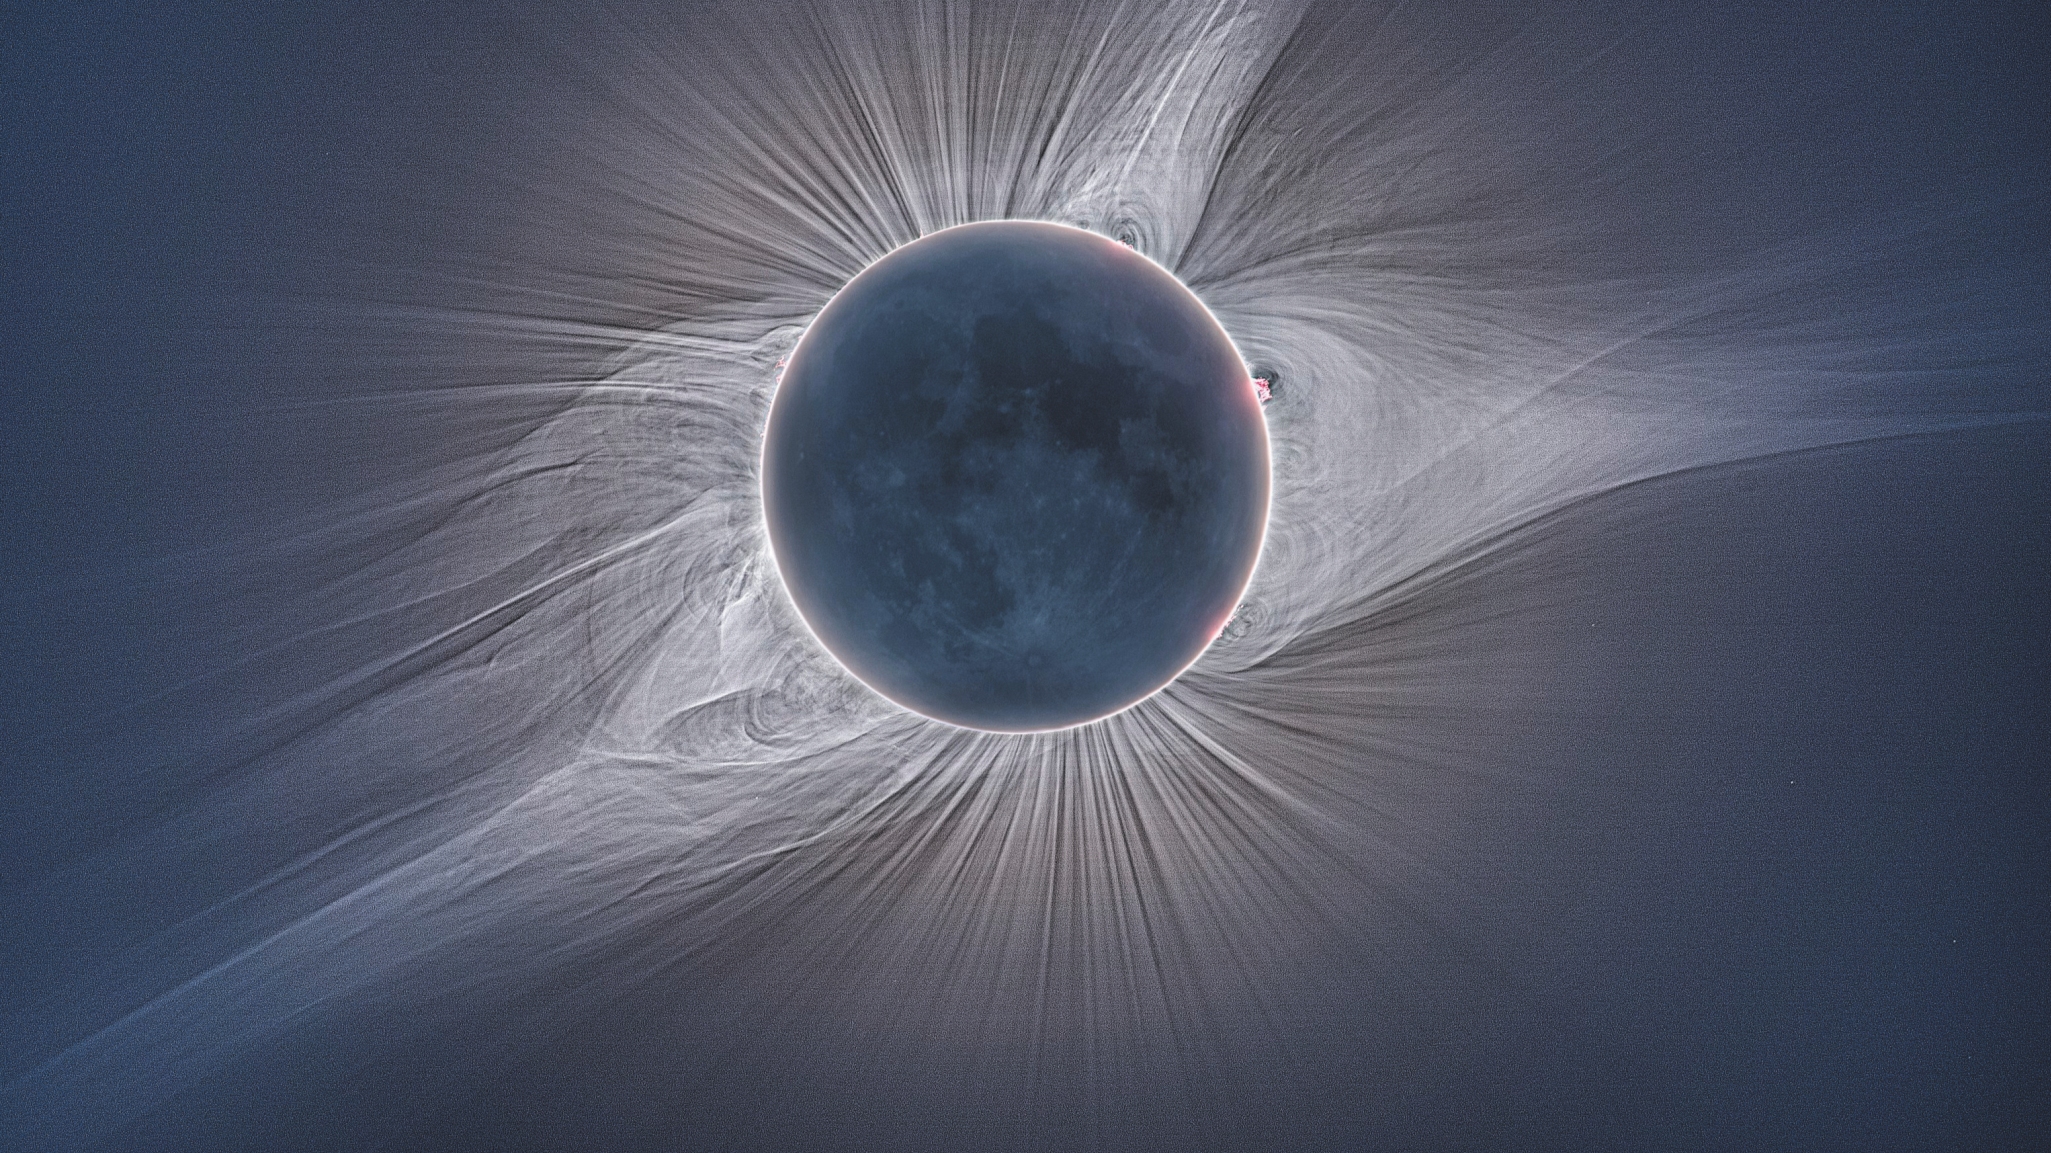
The corona varies greatly in brightness: Its magnitude falls by a factor of a thousand in the first solar radius outside the solar disk. Because that range in brightness is too great for any single detector (usually a CCD) to capture, detailed images of the corona are often composites of perhaps dozens of individual images taken with different exposure times or apertures.
In the 2017 eclipse, shown in figure

Figure 2. A composite image made from dozens of individual frames taken in Salem, Oregon, on 21 August 2017. During the recent 2 July 2019 eclipse, the corona was even more extended at the Sun’s equator than at high solar latitudes. (Image courtesy of Williams College Solar Eclipse Expedition/NSF/NatGeo. Computer synthesis by Vojtech Rusin and Roman Vanur for Jay Pasachoff.)
In anticipation of that 2017 eclipse, Hugh Hudson, Scott McIntosh, Shadia Habbal, Laura Peticolas, and I proposed a citizen science effort that ultimately included more than a thousand contributors spaced across the region of totality from coast to coast. The resulting movie of still photographs (http://eclipsemegamovie.org ) provides an archive of variations in the corona over a 90-minute period. A separate effort—Citizen CATE, for continental-America telescopic eclipse—used 60 identical telescopes across the country and had more uniform observations to compare.
Coronal heating
To appreciate the evolution of solar physics, it helps to know some eclipse history. During the total eclipse of 1868, French astronomer Jules Janssen was in India and observed a yellow line in the chromospheric spectrum with his newfangled spectroscope. Later seen by Norman Lockyer outside the eclipse, the line was named “helium” because it seemed at the time to exist only on the Sun. The following year in the US, Charles Young spectroscopically observed a green emission line in the solar corona. (For more on that 19th-century eclipse expedition, see the
A later-discovered red emission line joined the green line in being attributed to coronium. But it took about 70 years before anyone realized that the original coronium lines actually came from highly ionized iron—the green line from Fe XIV (iron that is ionized thirteen times from neutral Fe I), and the red line from Fe X. Coronal gas must be more than a million kelvins for such extreme ionization to occur. Scientists aboard NSF airplanes flown during the 2017 and 2019 eclipses took observations in the near-IR to look for additional coronal emission lines beyond the few now known. They were searching for lines that are especially sensitive to magnetism for use in future measurements of the coronal magnetic field.
The high temperature indicates extraordinarily fast motion of the coronal gas. But the gas itself is sparse, which makes the heat capacity of the corona low and raises the question, How does the coronal gas get heated to millions of kelvins? Scientists are considering more than a dozen possible answers, though the most likely processes implicate the Sun’s magnetism. (See Physics Today, May 2009, page 18 , and the article by Jack Zirker and Oddbjørn Engvold, August 2017, page 36 .)
During eclipses, my team often carries out subsecond observations through filters that transmit only the red and green coronal lines. The power spectra of that emission can be searched for the periods of vibrations on the magnetically constrained coronal loops that are visible in the lower corona.
The sunspot cycle
The corona has been drawn or photographed for 150 years. Pictures reveal helmet streamers, named for their resemblance to 19th-century police helmets. Wider at the base and narrow higher up, the streamers are bright loop-like structures whose gas is held in space by closed magnetic fields. Between them the magnetic field is open, which allows the solar wind to escape more easily. Near the solar poles, the magnetic field resembles that of a bar magnet, and plumes of streamers bristle radially.
At times near the maximum of the 11-year sunspot cycle—the most obvious visual manifestation of the Sun’s repeating magnetic activity—electrons in streamers even at high solar latitudes scatter ordinary sunlight and make the overall shape of the corona almost round. Near sunspot minimum, streamers are constrained to lower latitudes and the polar plumes are visible. Earth has now entered sunspot minimum, and the polar plumes were quite visible during the 2017 and 2019 total eclipses. Monitoring the overall shape of the corona traces the solar-activity cycle. The past three cycles have been diminishing in intensity, which has prompted varying predictions of how weak the next one might be.
Heliophysicist Zoran Mikić at Predictive Science Inc and his colleagues have used measurements of the photospheric magnetic field from the Zeeman effect to make predictions in the week or so before an eclipse of what the corona will look like. My team at Williams College made composite photographs of 2017’s and 2019’s eclipses that closely matched those predictions. The differences we found are being used to improve the theories behind the predictions and to better understand the corona and its magnetic field.
References
► L. Golub, J. M. Pasachoff, The Sun, U. Chicago Press (2017).https://www.press.uchicago.edu/ucp/books/book/distributed/S/bo26297673.html
► J. M. Pasachoff, A. Fraknoi, “Resource Letter OSE-1: Observing solar eclipses,” Am. J. Phys. 85, 485 (2017). https://authors.library.caltech.edu/78307/1/1%252E4985062.pdf
► J. M. Pasachoff, “Heliophysics at total solar eclipses,” Nat. Astron. 1, 0190 (2017).https://doi.org/10.1038/s41550-017-0190
► J. M. Pasachoff, “Science at the Great American Eclipse,” Astron. Geophys. 59, 4.19 (2018).https://doi.org/10.1088/1674-4527/9/6/001
► J. M. Pasachoff et al., “Images and spectra of the 2017 total solar eclipse corona from our Oregon site,” Front. Astron. Space Sci. 5, 37 (2018).https://doi.org/10.3389/fspas.2018.00037
► Z. Mikić et al., “Predicting the corona for the 21 August 2017 total solar eclipse,” Nat. Astron. 2, 913 (2018).https://doi.org/10.1038/s41550-018-0562-5
More about the authors
Jay Pasachoff is Field Memorial Professor of Astronomy at Williams College in Williamstown, Massachusetts, and chair of the International Astronomical Union’s working group on solar eclipses. He is coauthor with Alex Filippenko of the textbook The Cosmos: Astronomy in the New Millennium (5th edition, 2019).


